
Key Insights
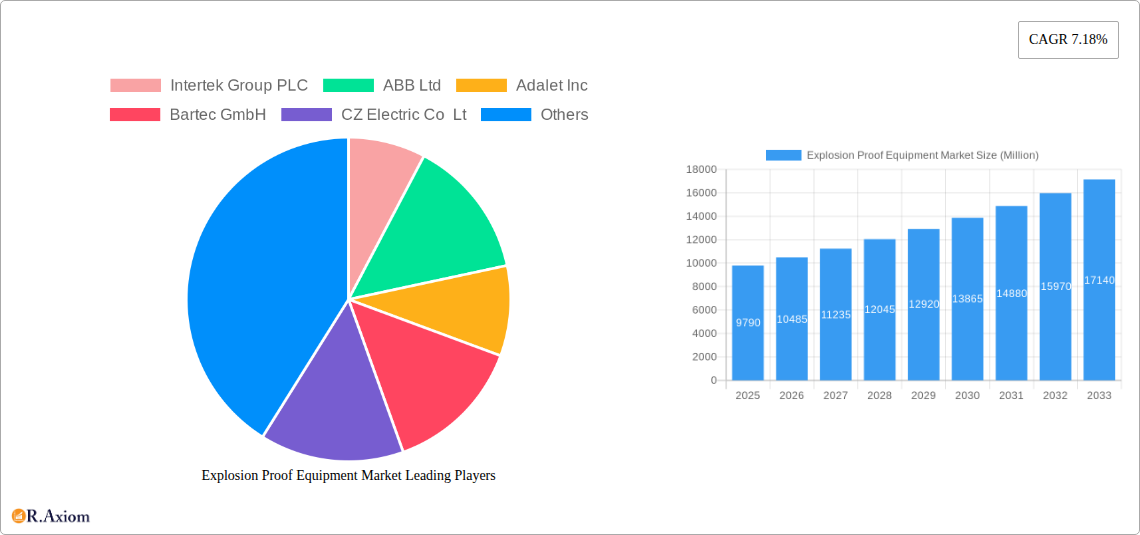
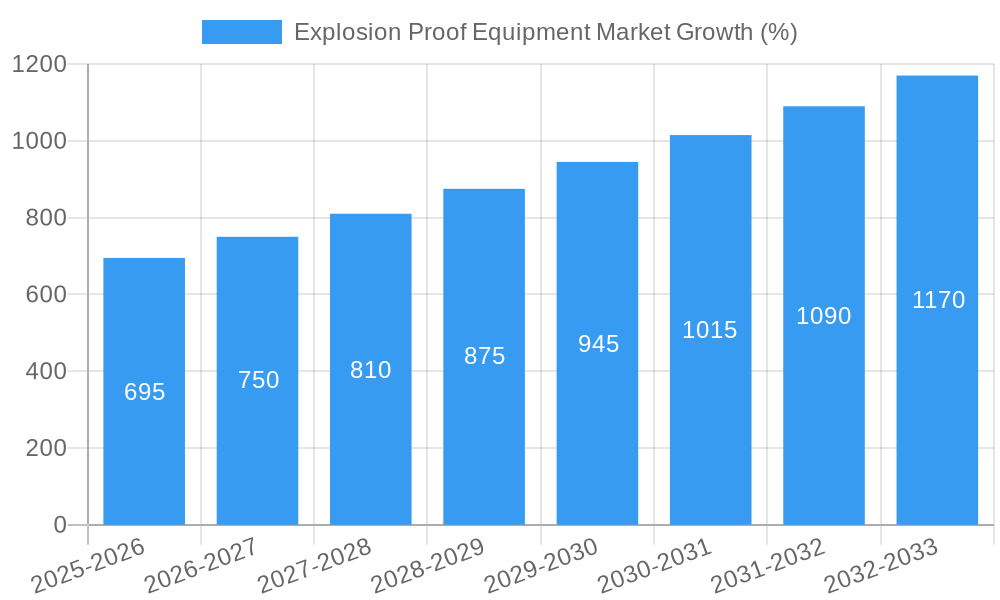
The global explosion-proof equipment market, valued at $9.79 billion in 2025, is projected to experience robust growth, driven by increasing demand across diverse industries. A Compound Annual Growth Rate (CAGR) of 7.18% from 2025 to 2033 indicates a significant expansion, primarily fueled by stringent safety regulations in hazardous environments within sectors like oil and gas, chemical processing, and mining. The rising adoption of automation and the expanding use of intrinsically safe equipment further contribute to market expansion. Growth is also influenced by the increasing focus on worker safety and the prevention of costly accidents resulting from explosions. Segmentation reveals that the pharmaceutical and chemical sectors represent significant end-user markets, while power supply systems and motor-related equipment dominate the system segment. Explosion-proof methods like explosion prevention and segregation are witnessing increased adoption, aligning with broader industry safety initiatives. Geographical analysis suggests North America and Europe currently hold substantial market shares, while the Asia-Pacific region is poised for substantial growth due to rapid industrialization and infrastructure development. Competition within the market is intense, with major players like ABB, Eaton, and Pepperl+Fuchs continuously innovating to meet evolving industry needs and regulatory compliance.
The market's future trajectory will depend on several factors, including technological advancements in explosion-proof technologies, fluctuations in global energy prices impacting demand from energy-intensive industries, and the implementation of stricter environmental and safety regulations globally. Companies will focus on developing innovative and cost-effective solutions to maintain their competitive edge. The continued emphasis on worker safety and environmental protection will remain central in shaping market growth throughout the forecast period. The adoption of Industry 4.0 technologies and the integration of smart sensors within explosion-proof equipment also present significant growth opportunities. The market is expected to witness consolidation through mergers and acquisitions as companies seek to expand their market share and product portfolios.
Explosion Proof Equipment Market: A Comprehensive Report (2019-2033)
This detailed report provides a comprehensive analysis of the global Explosion Proof Equipment market, offering actionable insights for stakeholders across the value chain. Covering the period from 2019 to 2033, with 2025 as the base year, this study meticulously examines market dynamics, growth drivers, challenges, and opportunities. The report segments the market by end-user, system, method of protection, and zone, providing granular data and forecasts to facilitate informed decision-making. The report also features in-depth company profiles of key players, highlighting recent industry developments and strategic implications. The total market size is projected to reach xx Million by 2033.
Explosion Proof Equipment Market Market Concentration & Innovation
The Explosion Proof Equipment market exhibits a moderately concentrated landscape, with several major players holding significant market share. While precise market share data for each company remains proprietary, Intertek Group PLC, ABB Ltd, Eaton Corporation PLC, and R STAHL AG are recognized as key industry leaders. The competitive landscape is characterized by both organic growth strategies, such as product innovation and expansion into new markets, and inorganic growth strategies, including mergers and acquisitions (M&A). Recent M&A activity has been modest, with deal values totaling approximately xx Million in the past year. However, strategic partnerships are increasingly common, as illustrated by the ScanReach-BARTEC collaboration.
- Innovation Drivers: Stringent safety regulations in hazardous industries, the increasing adoption of automation and Industry 4.0 technologies, and the demand for enhanced safety features are major drivers of innovation.
- Regulatory Frameworks: Compliance with international safety standards (e.g., IEC, ATEX) is crucial and significantly impacts market growth and product design. Changes in these regulations can lead to both opportunities and challenges for market players.
- Product Substitutes: While direct substitutes are limited due to the specialized nature of explosion-proof equipment, advancements in alternative technologies may pose some indirect competitive pressure.
- End-User Trends: The growing focus on safety and efficiency across diverse industries, including Oil & Gas, Chemical, and Mining, fuels market expansion.
- M&A Activities: While relatively limited in recent years (xx Million in total deal value), M&A activity is expected to increase as companies consolidate and seek to expand their market reach and product portfolios.
Explosion Proof Equipment Market Industry Trends & Insights
The global Explosion Proof Equipment market is experiencing robust growth, driven by several key factors. The increasing demand for explosion-proof equipment in hazardous industries like Oil & Gas, Chemical, and Mining is a primary growth catalyst. The market is projected to achieve a CAGR of xx% during the forecast period (2025-2033), surpassing xx Million by 2033. Technological advancements, such as the integration of IoT and wireless technologies, are driving innovation and creating new market opportunities. The adoption of explosion-proof collaborative robots, as demonstrated by FANUC's recent launch, exemplifies this trend. Market penetration of explosion-proof equipment in emerging economies is also on the rise, further contributing to market expansion. However, fluctuating raw material prices and economic downturns can impact market growth. Competitive dynamics are intensifying, with companies focusing on innovation, strategic partnerships, and expansion into new markets to maintain their edge.
Dominant Markets & Segments in Explosion Proof Equipment Market
The Oil & Gas sector currently represents the largest end-user segment for explosion-proof equipment, accounting for approximately xx% of the total market. This dominance stems from the inherent risks associated with oil and gas operations, necessitating stringent safety measures. The chemical and petrochemical industry holds the second-largest share, followed by the energy and power sector. Geographically, North America and Europe currently hold the largest market shares due to established industries and stringent safety regulations. However, Asia-Pacific is expected to exhibit the fastest growth rate over the forecast period driven by increasing industrialization and infrastructure development.
- Key Drivers for Oil & Gas Segment Dominance:
- High inherent risk requiring stringent safety measures
- Extensive use of explosion-proof equipment across various operations
- Robust investments in safety and infrastructure
- Key Drivers for Asia-Pacific Growth:
- Rapid industrialization and urbanization
- Increasing investments in energy and infrastructure projects
- Growing awareness of safety regulations
By System: The Power Supply System segment holds the largest market share, followed by Motor and Automation Systems. By Method of Protection: The "Explosion Proof" method dominates, reflecting the industry's focus on containing explosions. By Zone: Demand across all zones (Zone 0, Zone 1, Zone 2, etc.) varies based on specific application and risk assessment.
Explosion Proof Equipment Market Product Developments
Recent product developments highlight a trend toward increased integration of advanced technologies, like wireless connectivity and sensor integration, enabling improved monitoring and remote control of equipment in hazardous environments. The introduction of explosion-proof collaborative robots represents a significant leap forward, improving safety and efficiency in automated processes within hazardous areas. These advancements offer improved safety, efficiency, and ease of use, creating a significant competitive advantage for manufacturers.
Report Scope & Segmentation Analysis
This report segments the Explosion Proof Equipment market based on four key parameters:
- By End-user: Pharmaceutical, Chemical and Petrochemical, Energy and Power, Mining, Food Processing, Oil and Gas, Other End Users. Growth projections vary across segments, with Oil & Gas and Chemical projected for the highest growth.
- By System: Power Supply System, Material Handling, Motor, Automation System, Surveillance System, Other Systems. Power Supply and Motor systems are expected to dominate.
- By Method of Protection: Explosion Proof, Explosion Prevention, Explosion Segregation. Explosion-Proof remains the dominant method.
- By Zone: Zone 0, Zone 1, Zone 2, Zone 21, Zone 22. Market size varies significantly across zones based on risk levels.
Each segment's market size, growth rate, and competitive dynamics are analyzed in detail within the full report.
Key Drivers of Explosion Proof Equipment Market Growth
The Explosion Proof Equipment market is propelled by several factors: stringent safety regulations in hazardous industries, increasing automation and digitization, rising demand from emerging economies, and the growing need for efficient and reliable equipment in hazardous environments. Technological advancements leading to more compact, efficient, and user-friendly equipment also play a vital role. The growing focus on safety and environmental protection further fuels market growth.
Challenges in the Explosion Proof Equipment Market Sector
The Explosion Proof Equipment market faces challenges like stringent regulatory compliance requirements, supply chain disruptions impacting raw material availability and pricing, and intense competition from established and emerging players. Economic downturns in key industries can also curb investment in new equipment, impacting market growth. These factors can lead to unpredictable market fluctuations and potential revenue instability for market participants.
Emerging Opportunities in Explosion Proof Equipment Market
Emerging opportunities include the growing adoption of IoT and wireless technologies, increased demand for explosion-proof equipment in renewable energy sectors, the development of intrinsically safe equipment, and expansion into new, high-growth markets. The integration of AI and machine learning for predictive maintenance offers significant potential.
Leading Players in the Explosion Proof Equipment Market Market
- Intertek Group PLC
- ABB Ltd
- Adalet Inc
- Bartec GmbH
- CZ Electric Co Lt
- RAE Systems (Honeywell)
- MAM Explosion-proof Technology (Shanghai) Co Ltd
- Marechal Electric Group
- Eaton Corporation PLC
- Extronics Limited
- R STAHL AG
- G M International SRL
- Cordex Instruments Ltd
- Pepperl+Fuchs GmbH
- Alloy Industry Co Ltd
Key Developments in Explosion Proof Equipment Market Industry
- April 2024: ScanReach and BARTEC partnered to launch an explosion-proof node for seamless sensor data integration in EX zones, particularly targeting the maritime sector. This enhances data acquisition in hazardous environments.
- May 2024: FANUC America introduced the world's first explosion-proof collaborative paint robot (CRX-10iA/L Paint Cobot), setting a new standard in safety and automation for paint operations.
Strategic Outlook for Explosion Proof Equipment Market Market
The Explosion Proof Equipment market is poised for continued growth driven by technological advancements, stringent safety regulations, and increasing demand across diverse sectors. The integration of IoT, AI, and other cutting-edge technologies will shape future market dynamics, providing opportunities for innovation and creating more efficient, safer, and cost-effective solutions. Focusing on these trends and adapting to evolving industry demands will be key for sustained success in this market.
Explosion Proof Equipment Market Segmentation
-
1. Method of Protection
- 1.1. Explosion Proof
- 1.2. Explosion Prevention
- 1.3. Explosion Segregation
-
2. Zone
- 2.1. Zone 0
- 2.2. Zone 20
- 2.3. Zone 1
- 2.4. Zone 21
- 2.5. Zone 22
-
3. End-user
- 3.1. Pharmaceutical
- 3.2. Chemical and Petrochemical
- 3.3. Energy and Power
- 3.4. Mining
- 3.5. Food Processing
- 3.6. Oil and Gas
- 3.7. Other End Users
-
4. System
- 4.1. Power Supply System
- 4.2. Material Handling
- 4.3. Motor
- 4.4. Automation System
- 4.5. Surveillance System
- 4.6. Other Systems
Explosion Proof Equipment Market Segmentation By Geography
-
1. North America
- 1.1. United States
- 1.2. Canada
-
2. Europe
- 2.1. United Kingdom
- 2.2. Germany
- 2.3. France
- 2.4. Rest of Europe
-
3. Asia Pacific
- 3.1. China
- 3.2. Japan
- 3.3. India
- 3.4. Rest of Asia Pacific
- 4. Rest of the World

Explosion Proof Equipment Market REPORT HIGHLIGHTS
| Aspects | Details |
|---|---|
| Study Period | 2019-2033 |
| Base Year | 2024 |
| Estimated Year | 2025 |
| Forecast Period | 2025-2033 |
| Historical Period | 2019-2024 |
| Growth Rate | CAGR of 7.18% from 2019-2033 |
| Segmentation |
|
Table of Contents
- 1. Introduction
- 1.1. Research Scope
- 1.2. Market Segmentation
- 1.3. Research Methodology
- 1.4. Definitions and Assumptions
- 2. Executive Summary
- 2.1. Introduction
- 3. Market Dynamics
- 3.1. Introduction
- 3.2. Market Drivers
- 3.2.1. Stricter Regulations for Handling Hazardous Areas and Substances; Increasing Energy Requirements Drives the Demand for Exploration of New Mines and Oil and Gas Resources
- 3.3. Market Restrains
- 3.3.1. Slow Economic Activity Directly Affects the Market; Safety Regulations Vary Across Different Geographies
- 3.4. Market Trends
- 3.4.1. The Mining Industry is Expected to Hold a Significant Share in the Market
- 4. Market Factor Analysis
- 4.1. Porters Five Forces
- 4.2. Supply/Value Chain
- 4.3. PESTEL analysis
- 4.4. Market Entropy
- 4.5. Patent/Trademark Analysis
- 5. Global Explosion Proof Equipment Market Analysis, Insights and Forecast, 2019-2031
- 5.1. Market Analysis, Insights and Forecast - by Method of Protection
- 5.1.1. Explosion Proof
- 5.1.2. Explosion Prevention
- 5.1.3. Explosion Segregation
- 5.2. Market Analysis, Insights and Forecast - by Zone
- 5.2.1. Zone 0
- 5.2.2. Zone 20
- 5.2.3. Zone 1
- 5.2.4. Zone 21
- 5.2.5. Zone 22
- 5.3. Market Analysis, Insights and Forecast - by End-user
- 5.3.1. Pharmaceutical
- 5.3.2. Chemical and Petrochemical
- 5.3.3. Energy and Power
- 5.3.4. Mining
- 5.3.5. Food Processing
- 5.3.6. Oil and Gas
- 5.3.7. Other End Users
- 5.4. Market Analysis, Insights and Forecast - by System
- 5.4.1. Power Supply System
- 5.4.2. Material Handling
- 5.4.3. Motor
- 5.4.4. Automation System
- 5.4.5. Surveillance System
- 5.4.6. Other Systems
- 5.5. Market Analysis, Insights and Forecast - by Region
- 5.5.1. North America
- 5.5.2. Europe
- 5.5.3. Asia Pacific
- 5.5.4. Rest of the World
- 5.1. Market Analysis, Insights and Forecast - by Method of Protection
- 6. North America Explosion Proof Equipment Market Analysis, Insights and Forecast, 2019-2031
- 6.1. Market Analysis, Insights and Forecast - by Method of Protection
- 6.1.1. Explosion Proof
- 6.1.2. Explosion Prevention
- 6.1.3. Explosion Segregation
- 6.2. Market Analysis, Insights and Forecast - by Zone
- 6.2.1. Zone 0
- 6.2.2. Zone 20
- 6.2.3. Zone 1
- 6.2.4. Zone 21
- 6.2.5. Zone 22
- 6.3. Market Analysis, Insights and Forecast - by End-user
- 6.3.1. Pharmaceutical
- 6.3.2. Chemical and Petrochemical
- 6.3.3. Energy and Power
- 6.3.4. Mining
- 6.3.5. Food Processing
- 6.3.6. Oil and Gas
- 6.3.7. Other End Users
- 6.4. Market Analysis, Insights and Forecast - by System
- 6.4.1. Power Supply System
- 6.4.2. Material Handling
- 6.4.3. Motor
- 6.4.4. Automation System
- 6.4.5. Surveillance System
- 6.4.6. Other Systems
- 6.1. Market Analysis, Insights and Forecast - by Method of Protection
- 7. Europe Explosion Proof Equipment Market Analysis, Insights and Forecast, 2019-2031
- 7.1. Market Analysis, Insights and Forecast - by Method of Protection
- 7.1.1. Explosion Proof
- 7.1.2. Explosion Prevention
- 7.1.3. Explosion Segregation
- 7.2. Market Analysis, Insights and Forecast - by Zone
- 7.2.1. Zone 0
- 7.2.2. Zone 20
- 7.2.3. Zone 1
- 7.2.4. Zone 21
- 7.2.5. Zone 22
- 7.3. Market Analysis, Insights and Forecast - by End-user
- 7.3.1. Pharmaceutical
- 7.3.2. Chemical and Petrochemical
- 7.3.3. Energy and Power
- 7.3.4. Mining
- 7.3.5. Food Processing
- 7.3.6. Oil and Gas
- 7.3.7. Other End Users
- 7.4. Market Analysis, Insights and Forecast - by System
- 7.4.1. Power Supply System
- 7.4.2. Material Handling
- 7.4.3. Motor
- 7.4.4. Automation System
- 7.4.5. Surveillance System
- 7.4.6. Other Systems
- 7.1. Market Analysis, Insights and Forecast - by Method of Protection
- 8. Asia Pacific Explosion Proof Equipment Market Analysis, Insights and Forecast, 2019-2031
- 8.1. Market Analysis, Insights and Forecast - by Method of Protection
- 8.1.1. Explosion Proof
- 8.1.2. Explosion Prevention
- 8.1.3. Explosion Segregation
- 8.2. Market Analysis, Insights and Forecast - by Zone
- 8.2.1. Zone 0
- 8.2.2. Zone 20
- 8.2.3. Zone 1
- 8.2.4. Zone 21
- 8.2.5. Zone 22
- 8.3. Market Analysis, Insights and Forecast - by End-user
- 8.3.1. Pharmaceutical
- 8.3.2. Chemical and Petrochemical
- 8.3.3. Energy and Power
- 8.3.4. Mining
- 8.3.5. Food Processing
- 8.3.6. Oil and Gas
- 8.3.7. Other End Users
- 8.4. Market Analysis, Insights and Forecast - by System
- 8.4.1. Power Supply System
- 8.4.2. Material Handling
- 8.4.3. Motor
- 8.4.4. Automation System
- 8.4.5. Surveillance System
- 8.4.6. Other Systems
- 8.1. Market Analysis, Insights and Forecast - by Method of Protection
- 9. Rest of the World Explosion Proof Equipment Market Analysis, Insights and Forecast, 2019-2031
- 9.1. Market Analysis, Insights and Forecast - by Method of Protection
- 9.1.1. Explosion Proof
- 9.1.2. Explosion Prevention
- 9.1.3. Explosion Segregation
- 9.2. Market Analysis, Insights and Forecast - by Zone
- 9.2.1. Zone 0
- 9.2.2. Zone 20
- 9.2.3. Zone 1
- 9.2.4. Zone 21
- 9.2.5. Zone 22
- 9.3. Market Analysis, Insights and Forecast - by End-user
- 9.3.1. Pharmaceutical
- 9.3.2. Chemical and Petrochemical
- 9.3.3. Energy and Power
- 9.3.4. Mining
- 9.3.5. Food Processing
- 9.3.6. Oil and Gas
- 9.3.7. Other End Users
- 9.4. Market Analysis, Insights and Forecast - by System
- 9.4.1. Power Supply System
- 9.4.2. Material Handling
- 9.4.3. Motor
- 9.4.4. Automation System
- 9.4.5. Surveillance System
- 9.4.6. Other Systems
- 9.1. Market Analysis, Insights and Forecast - by Method of Protection
- 10. North America Explosion Proof Equipment Market Analysis, Insights and Forecast, 2019-2031
- 10.1. Market Analysis, Insights and Forecast - By Country/Sub-region
- 10.1.1 United States
- 10.1.2 Canada
- 11. Europe Explosion Proof Equipment Market Analysis, Insights and Forecast, 2019-2031
- 11.1. Market Analysis, Insights and Forecast - By Country/Sub-region
- 11.1.1 United Kingdom
- 11.1.2 Germany
- 11.1.3 France
- 11.1.4 Rest of Europe
- 12. Asia Pacific Explosion Proof Equipment Market Analysis, Insights and Forecast, 2019-2031
- 12.1. Market Analysis, Insights and Forecast - By Country/Sub-region
- 12.1.1 China
- 12.1.2 Japan
- 12.1.3 India
- 12.1.4 Rest of Asia Pacific
- 13. Rest of the World Explosion Proof Equipment Market Analysis, Insights and Forecast, 2019-2031
- 13.1. Market Analysis, Insights and Forecast - By Country/Sub-region
- 13.1.1.
- 14. Competitive Analysis
- 14.1. Global Market Share Analysis 2024
- 14.2. Company Profiles
- 14.2.1 Intertek Group PLC
- 14.2.1.1. Overview
- 14.2.1.2. Products
- 14.2.1.3. SWOT Analysis
- 14.2.1.4. Recent Developments
- 14.2.1.5. Financials (Based on Availability)
- 14.2.2 ABB Ltd
- 14.2.2.1. Overview
- 14.2.2.2. Products
- 14.2.2.3. SWOT Analysis
- 14.2.2.4. Recent Developments
- 14.2.2.5. Financials (Based on Availability)
- 14.2.3 Adalet Inc
- 14.2.3.1. Overview
- 14.2.3.2. Products
- 14.2.3.3. SWOT Analysis
- 14.2.3.4. Recent Developments
- 14.2.3.5. Financials (Based on Availability)
- 14.2.4 Bartec GmbH
- 14.2.4.1. Overview
- 14.2.4.2. Products
- 14.2.4.3. SWOT Analysis
- 14.2.4.4. Recent Developments
- 14.2.4.5. Financials (Based on Availability)
- 14.2.5 CZ Electric Co Lt
- 14.2.5.1. Overview
- 14.2.5.2. Products
- 14.2.5.3. SWOT Analysis
- 14.2.5.4. Recent Developments
- 14.2.5.5. Financials (Based on Availability)
- 14.2.6 RAE Systems (Honeywell)
- 14.2.6.1. Overview
- 14.2.6.2. Products
- 14.2.6.3. SWOT Analysis
- 14.2.6.4. Recent Developments
- 14.2.6.5. Financials (Based on Availability)
- 14.2.7 MAM Explosion-proof Technology (Shanghai) Co Ltd
- 14.2.7.1. Overview
- 14.2.7.2. Products
- 14.2.7.3. SWOT Analysis
- 14.2.7.4. Recent Developments
- 14.2.7.5. Financials (Based on Availability)
- 14.2.8 Marechal Electric Group
- 14.2.8.1. Overview
- 14.2.8.2. Products
- 14.2.8.3. SWOT Analysis
- 14.2.8.4. Recent Developments
- 14.2.8.5. Financials (Based on Availability)
- 14.2.9 Eaton Corporation PLC
- 14.2.9.1. Overview
- 14.2.9.2. Products
- 14.2.9.3. SWOT Analysis
- 14.2.9.4. Recent Developments
- 14.2.9.5. Financials (Based on Availability)
- 14.2.10 Extronics Limited
- 14.2.10.1. Overview
- 14.2.10.2. Products
- 14.2.10.3. SWOT Analysis
- 14.2.10.4. Recent Developments
- 14.2.10.5. Financials (Based on Availability)
- 14.2.11 R STAHL AG
- 14.2.11.1. Overview
- 14.2.11.2. Products
- 14.2.11.3. SWOT Analysis
- 14.2.11.4. Recent Developments
- 14.2.11.5. Financials (Based on Availability)
- 14.2.12 G M International SRL
- 14.2.12.1. Overview
- 14.2.12.2. Products
- 14.2.12.3. SWOT Analysis
- 14.2.12.4. Recent Developments
- 14.2.12.5. Financials (Based on Availability)
- 14.2.13 Cordex Instruments Ltd
- 14.2.13.1. Overview
- 14.2.13.2. Products
- 14.2.13.3. SWOT Analysis
- 14.2.13.4. Recent Developments
- 14.2.13.5. Financials (Based on Availability)
- 14.2.14 Pepperl+Fuchs GmbH
- 14.2.14.1. Overview
- 14.2.14.2. Products
- 14.2.14.3. SWOT Analysis
- 14.2.14.4. Recent Developments
- 14.2.14.5. Financials (Based on Availability)
- 14.2.15 Alloy Industry Co Ltd
- 14.2.15.1. Overview
- 14.2.15.2. Products
- 14.2.15.3. SWOT Analysis
- 14.2.15.4. Recent Developments
- 14.2.15.5. Financials (Based on Availability)
- 14.2.1 Intertek Group PLC
List of Figures
- Figure 1: Global Explosion Proof Equipment Market Revenue Breakdown (Million, %) by Region 2024 & 2032
- Figure 2: North America Explosion Proof Equipment Market Revenue (Million), by Country 2024 & 2032
- Figure 3: North America Explosion Proof Equipment Market Revenue Share (%), by Country 2024 & 2032
- Figure 4: Europe Explosion Proof Equipment Market Revenue (Million), by Country 2024 & 2032
- Figure 5: Europe Explosion Proof Equipment Market Revenue Share (%), by Country 2024 & 2032
- Figure 6: Asia Pacific Explosion Proof Equipment Market Revenue (Million), by Country 2024 & 2032
- Figure 7: Asia Pacific Explosion Proof Equipment Market Revenue Share (%), by Country 2024 & 2032
- Figure 8: Rest of the World Explosion Proof Equipment Market Revenue (Million), by Country 2024 & 2032
- Figure 9: Rest of the World Explosion Proof Equipment Market Revenue Share (%), by Country 2024 & 2032
- Figure 10: North America Explosion Proof Equipment Market Revenue (Million), by Method of Protection 2024 & 2032
- Figure 11: North America Explosion Proof Equipment Market Revenue Share (%), by Method of Protection 2024 & 2032
- Figure 12: North America Explosion Proof Equipment Market Revenue (Million), by Zone 2024 & 2032
- Figure 13: North America Explosion Proof Equipment Market Revenue Share (%), by Zone 2024 & 2032
- Figure 14: North America Explosion Proof Equipment Market Revenue (Million), by End-user 2024 & 2032
- Figure 15: North America Explosion Proof Equipment Market Revenue Share (%), by End-user 2024 & 2032
- Figure 16: North America Explosion Proof Equipment Market Revenue (Million), by System 2024 & 2032
- Figure 17: North America Explosion Proof Equipment Market Revenue Share (%), by System 2024 & 2032
- Figure 18: North America Explosion Proof Equipment Market Revenue (Million), by Country 2024 & 2032
- Figure 19: North America Explosion Proof Equipment Market Revenue Share (%), by Country 2024 & 2032
- Figure 20: Europe Explosion Proof Equipment Market Revenue (Million), by Method of Protection 2024 & 2032
- Figure 21: Europe Explosion Proof Equipment Market Revenue Share (%), by Method of Protection 2024 & 2032
- Figure 22: Europe Explosion Proof Equipment Market Revenue (Million), by Zone 2024 & 2032
- Figure 23: Europe Explosion Proof Equipment Market Revenue Share (%), by Zone 2024 & 2032
- Figure 24: Europe Explosion Proof Equipment Market Revenue (Million), by End-user 2024 & 2032
- Figure 25: Europe Explosion Proof Equipment Market Revenue Share (%), by End-user 2024 & 2032
- Figure 26: Europe Explosion Proof Equipment Market Revenue (Million), by System 2024 & 2032
- Figure 27: Europe Explosion Proof Equipment Market Revenue Share (%), by System 2024 & 2032
- Figure 28: Europe Explosion Proof Equipment Market Revenue (Million), by Country 2024 & 2032
- Figure 29: Europe Explosion Proof Equipment Market Revenue Share (%), by Country 2024 & 2032
- Figure 30: Asia Pacific Explosion Proof Equipment Market Revenue (Million), by Method of Protection 2024 & 2032
- Figure 31: Asia Pacific Explosion Proof Equipment Market Revenue Share (%), by Method of Protection 2024 & 2032
- Figure 32: Asia Pacific Explosion Proof Equipment Market Revenue (Million), by Zone 2024 & 2032
- Figure 33: Asia Pacific Explosion Proof Equipment Market Revenue Share (%), by Zone 2024 & 2032
- Figure 34: Asia Pacific Explosion Proof Equipment Market Revenue (Million), by End-user 2024 & 2032
- Figure 35: Asia Pacific Explosion Proof Equipment Market Revenue Share (%), by End-user 2024 & 2032
- Figure 36: Asia Pacific Explosion Proof Equipment Market Revenue (Million), by System 2024 & 2032
- Figure 37: Asia Pacific Explosion Proof Equipment Market Revenue Share (%), by System 2024 & 2032
- Figure 38: Asia Pacific Explosion Proof Equipment Market Revenue (Million), by Country 2024 & 2032
- Figure 39: Asia Pacific Explosion Proof Equipment Market Revenue Share (%), by Country 2024 & 2032
- Figure 40: Rest of the World Explosion Proof Equipment Market Revenue (Million), by Method of Protection 2024 & 2032
- Figure 41: Rest of the World Explosion Proof Equipment Market Revenue Share (%), by Method of Protection 2024 & 2032
- Figure 42: Rest of the World Explosion Proof Equipment Market Revenue (Million), by Zone 2024 & 2032
- Figure 43: Rest of the World Explosion Proof Equipment Market Revenue Share (%), by Zone 2024 & 2032
- Figure 44: Rest of the World Explosion Proof Equipment Market Revenue (Million), by End-user 2024 & 2032
- Figure 45: Rest of the World Explosion Proof Equipment Market Revenue Share (%), by End-user 2024 & 2032
- Figure 46: Rest of the World Explosion Proof Equipment Market Revenue (Million), by System 2024 & 2032
- Figure 47: Rest of the World Explosion Proof Equipment Market Revenue Share (%), by System 2024 & 2032
- Figure 48: Rest of the World Explosion Proof Equipment Market Revenue (Million), by Country 2024 & 2032
- Figure 49: Rest of the World Explosion Proof Equipment Market Revenue Share (%), by Country 2024 & 2032
List of Tables
- Table 1: Global Explosion Proof Equipment Market Revenue Million Forecast, by Region 2019 & 2032
- Table 2: Global Explosion Proof Equipment Market Revenue Million Forecast, by Method of Protection 2019 & 2032
- Table 3: Global Explosion Proof Equipment Market Revenue Million Forecast, by Zone 2019 & 2032
- Table 4: Global Explosion Proof Equipment Market Revenue Million Forecast, by End-user 2019 & 2032
- Table 5: Global Explosion Proof Equipment Market Revenue Million Forecast, by System 2019 & 2032
- Table 6: Global Explosion Proof Equipment Market Revenue Million Forecast, by Region 2019 & 2032
- Table 7: Global Explosion Proof Equipment Market Revenue Million Forecast, by Country 2019 & 2032
- Table 8: United States Explosion Proof Equipment Market Revenue (Million) Forecast, by Application 2019 & 2032
- Table 9: Canada Explosion Proof Equipment Market Revenue (Million) Forecast, by Application 2019 & 2032
- Table 10: Global Explosion Proof Equipment Market Revenue Million Forecast, by Country 2019 & 2032
- Table 11: United Kingdom Explosion Proof Equipment Market Revenue (Million) Forecast, by Application 2019 & 2032
- Table 12: Germany Explosion Proof Equipment Market Revenue (Million) Forecast, by Application 2019 & 2032
- Table 13: France Explosion Proof Equipment Market Revenue (Million) Forecast, by Application 2019 & 2032
- Table 14: Rest of Europe Explosion Proof Equipment Market Revenue (Million) Forecast, by Application 2019 & 2032
- Table 15: Global Explosion Proof Equipment Market Revenue Million Forecast, by Country 2019 & 2032
- Table 16: China Explosion Proof Equipment Market Revenue (Million) Forecast, by Application 2019 & 2032
- Table 17: Japan Explosion Proof Equipment Market Revenue (Million) Forecast, by Application 2019 & 2032
- Table 18: India Explosion Proof Equipment Market Revenue (Million) Forecast, by Application 2019 & 2032
- Table 19: Rest of Asia Pacific Explosion Proof Equipment Market Revenue (Million) Forecast, by Application 2019 & 2032
- Table 20: Global Explosion Proof Equipment Market Revenue Million Forecast, by Country 2019 & 2032
- Table 21: Explosion Proof Equipment Market Revenue (Million) Forecast, by Application 2019 & 2032
- Table 22: Global Explosion Proof Equipment Market Revenue Million Forecast, by Method of Protection 2019 & 2032
- Table 23: Global Explosion Proof Equipment Market Revenue Million Forecast, by Zone 2019 & 2032
- Table 24: Global Explosion Proof Equipment Market Revenue Million Forecast, by End-user 2019 & 2032
- Table 25: Global Explosion Proof Equipment Market Revenue Million Forecast, by System 2019 & 2032
- Table 26: Global Explosion Proof Equipment Market Revenue Million Forecast, by Country 2019 & 2032
- Table 27: United States Explosion Proof Equipment Market Revenue (Million) Forecast, by Application 2019 & 2032
- Table 28: Canada Explosion Proof Equipment Market Revenue (Million) Forecast, by Application 2019 & 2032
- Table 29: Global Explosion Proof Equipment Market Revenue Million Forecast, by Method of Protection 2019 & 2032
- Table 30: Global Explosion Proof Equipment Market Revenue Million Forecast, by Zone 2019 & 2032
- Table 31: Global Explosion Proof Equipment Market Revenue Million Forecast, by End-user 2019 & 2032
- Table 32: Global Explosion Proof Equipment Market Revenue Million Forecast, by System 2019 & 2032
- Table 33: Global Explosion Proof Equipment Market Revenue Million Forecast, by Country 2019 & 2032
- Table 34: United Kingdom Explosion Proof Equipment Market Revenue (Million) Forecast, by Application 2019 & 2032
- Table 35: Germany Explosion Proof Equipment Market Revenue (Million) Forecast, by Application 2019 & 2032
- Table 36: France Explosion Proof Equipment Market Revenue (Million) Forecast, by Application 2019 & 2032
- Table 37: Rest of Europe Explosion Proof Equipment Market Revenue (Million) Forecast, by Application 2019 & 2032
- Table 38: Global Explosion Proof Equipment Market Revenue Million Forecast, by Method of Protection 2019 & 2032
- Table 39: Global Explosion Proof Equipment Market Revenue Million Forecast, by Zone 2019 & 2032
- Table 40: Global Explosion Proof Equipment Market Revenue Million Forecast, by End-user 2019 & 2032
- Table 41: Global Explosion Proof Equipment Market Revenue Million Forecast, by System 2019 & 2032
- Table 42: Global Explosion Proof Equipment Market Revenue Million Forecast, by Country 2019 & 2032
- Table 43: China Explosion Proof Equipment Market Revenue (Million) Forecast, by Application 2019 & 2032
- Table 44: Japan Explosion Proof Equipment Market Revenue (Million) Forecast, by Application 2019 & 2032
- Table 45: India Explosion Proof Equipment Market Revenue (Million) Forecast, by Application 2019 & 2032
- Table 46: Rest of Asia Pacific Explosion Proof Equipment Market Revenue (Million) Forecast, by Application 2019 & 2032
- Table 47: Global Explosion Proof Equipment Market Revenue Million Forecast, by Method of Protection 2019 & 2032
- Table 48: Global Explosion Proof Equipment Market Revenue Million Forecast, by Zone 2019 & 2032
- Table 49: Global Explosion Proof Equipment Market Revenue Million Forecast, by End-user 2019 & 2032
- Table 50: Global Explosion Proof Equipment Market Revenue Million Forecast, by System 2019 & 2032
- Table 51: Global Explosion Proof Equipment Market Revenue Million Forecast, by Country 2019 & 2032
Frequently Asked Questions
1. What is the projected Compound Annual Growth Rate (CAGR) of the Explosion Proof Equipment Market?
The projected CAGR is approximately 7.18%.
2. Which companies are prominent players in the Explosion Proof Equipment Market?
Key companies in the market include Intertek Group PLC, ABB Ltd, Adalet Inc, Bartec GmbH, CZ Electric Co Lt, RAE Systems (Honeywell), MAM Explosion-proof Technology (Shanghai) Co Ltd, Marechal Electric Group, Eaton Corporation PLC, Extronics Limited, R STAHL AG, G M International SRL, Cordex Instruments Ltd, Pepperl+Fuchs GmbH, Alloy Industry Co Ltd.
3. What are the main segments of the Explosion Proof Equipment Market?
The market segments include Method of Protection, Zone, End-user, System.
4. Can you provide details about the market size?
The market size is estimated to be USD 9.79 Million as of 2022.
5. What are some drivers contributing to market growth?
Stricter Regulations for Handling Hazardous Areas and Substances; Increasing Energy Requirements Drives the Demand for Exploration of New Mines and Oil and Gas Resources.
6. What are the notable trends driving market growth?
The Mining Industry is Expected to Hold a Significant Share in the Market.
7. Are there any restraints impacting market growth?
Slow Economic Activity Directly Affects the Market; Safety Regulations Vary Across Different Geographies.
8. Can you provide examples of recent developments in the market?
April 2024: ScanReach, a wireless IoT networking company, unveiled a strategic partnership with BARTEC. Together, they aim to introduce an explosion-proof node tailored for seamless sensor data integration in EX zones, specifically targeting the maritime sector. This innovative node, designed for hazardous environments, seamlessly integrates with ScanReach's OWC (Onboard Wireless Connectivity) network, enabling wireless data ingestion and sharing.
9. What pricing options are available for accessing the report?
Pricing options include single-user, multi-user, and enterprise licenses priced at USD 4750, USD 5250, and USD 8750 respectively.
10. Is the market size provided in terms of value or volume?
The market size is provided in terms of value, measured in Million.
11. Are there any specific market keywords associated with the report?
Yes, the market keyword associated with the report is "Explosion Proof Equipment Market," which aids in identifying and referencing the specific market segment covered.
12. How do I determine which pricing option suits my needs best?
The pricing options vary based on user requirements and access needs. Individual users may opt for single-user licenses, while businesses requiring broader access may choose multi-user or enterprise licenses for cost-effective access to the report.
13. Are there any additional resources or data provided in the Explosion Proof Equipment Market report?
While the report offers comprehensive insights, it's advisable to review the specific contents or supplementary materials provided to ascertain if additional resources or data are available.
14. How can I stay updated on further developments or reports in the Explosion Proof Equipment Market?
To stay informed about further developments, trends, and reports in the Explosion Proof Equipment Market, consider subscribing to industry newsletters, following relevant companies and organizations, or regularly checking reputable industry news sources and publications.
Methodology
Step 1 - Identification of Relevant Samples Size from Population Database


Step 2 - Approaches for Defining Global Market Size (Value, Volume* & Price*)

Note*: In applicable scenarios
Step 3 - Data Sources
Primary Research
- Web Analytics
- Survey Reports
- Research Institute
- Latest Research Reports
- Opinion Leaders
Secondary Research
- Annual Reports
- White Paper
- Latest Press Release
- Industry Association
- Paid Database
- Investor Presentations

Step 4 - Data Triangulation
Involves using different sources of information in order to increase the validity of a study
These sources are likely to be stakeholders in a program - participants, other researchers, program staff, other community members, and so on.
Then we put all data in single framework & apply various statistical tools to find out the dynamic on the market.
During the analysis stage, feedback from the stakeholder groups would be compared to determine areas of agreement as well as areas of divergence


