
Key Insights
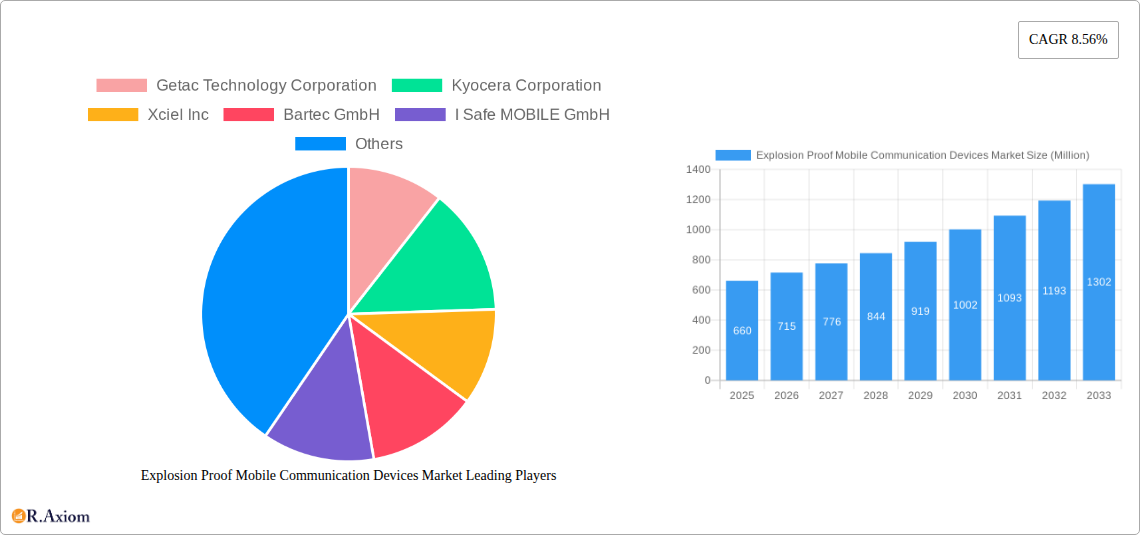
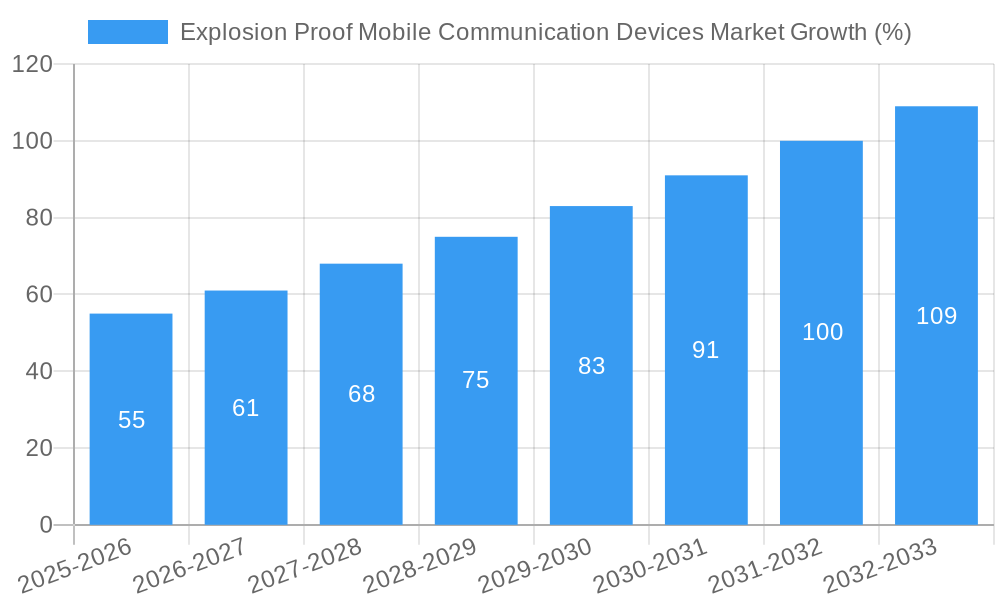
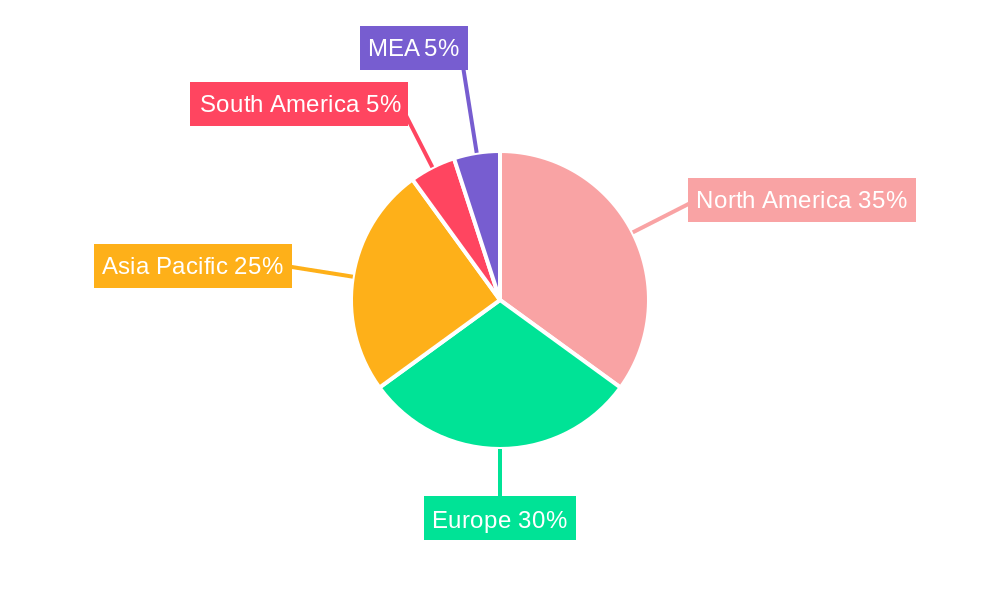
The Explosion Proof Mobile Communication Devices market is poised for significant growth, projected to reach \$660 million in 2025 and expanding at a Compound Annual Growth Rate (CAGR) of 8.56% from 2025 to 2033. This robust growth is driven by increasing demand across hazardous environments like oil and gas, mining, and manufacturing. Stringent safety regulations mandating explosion-proof communication equipment in these industries are a key market driver. Furthermore, technological advancements in ruggedized devices, offering enhanced durability and functionality, are fueling market expansion. The rising adoption of smartphones and tablets tailored for hazardous environments, alongside the increasing integration of advanced communication technologies like 5G, contribute to market dynamism. Growth is anticipated across all major geographic regions, with North America and Europe currently dominating the market, followed by a rapidly expanding Asia-Pacific region driven by industrial growth in countries like China and India. The market is segmented by product type (smartphones, two-way radios, handheld PCs, headsets, tablets, and other products) and end-user industry, reflecting the diverse applications of these devices. Competitive landscape analysis reveals key players such as Getac, Kyocera, and Sonim Technologies, continuously innovating to meet evolving industry demands and safety standards.
The market's growth trajectory is expected to remain positive throughout the forecast period (2025-2033). However, certain challenges exist. High initial investment costs associated with explosion-proof equipment could restrain market penetration, especially for smaller companies. Furthermore, the need for regular maintenance and potential obsolescence of technology could also impact overall market growth. To mitigate these challenges, manufacturers are focusing on developing cost-effective solutions and incorporating longer lifecycles into product design. The ongoing focus on improving worker safety and efficiency in hazardous environments, coupled with continuous technological advancements, will be crucial in shaping the future of the Explosion Proof Mobile Communication Devices market. The market is projected to see further consolidation through mergers and acquisitions as companies strive for greater market share and broader product portfolios.
Explosion Proof Mobile Communication Devices Market: A Comprehensive Report (2019-2033)
This detailed report provides a comprehensive analysis of the Explosion Proof Mobile Communication Devices market, offering invaluable insights for stakeholders seeking to navigate this dynamic sector. The study covers the period 2019-2033, with a focus on the 2025-2033 forecast period, leveraging data from the base year 2025 and historical data from 2019-2024. The report segments the market by product type (Smartphones and Cellphones, Two-way Radios, Handheld PCs, Headsets, Tablets, Other Products) and end-user industry (Oil and Gas, Mining, Manufacturing and Processing, Chemical and Pharmaceutical, Defense, Other End-user Industries), providing granular analysis of market size, growth projections, and competitive dynamics.
Explosion Proof Mobile Communication Devices Market Concentration & Innovation
The Explosion Proof Mobile Communication Devices market exhibits a moderately concentrated landscape, with a few key players holding significant market share. Getac Technology Corporation, Kyocera Corporation, and Sonim Technologies Inc are among the dominant players, collectively accounting for approximately xx% of the market in 2025. However, the market also features several smaller, specialized companies like Bartec GmbH, I Safe MOBILE GmbH, and Aegex Technologies LLC, catering to niche segments.
Market innovation is driven primarily by advancements in communication technologies (e.g., 5G), enhanced durability and ruggedization features to withstand harsh environments, and improved battery life. Stringent safety regulations, particularly in hazardous industries, act as a major driver of innovation, compelling manufacturers to develop increasingly sophisticated explosion-proof devices. The regulatory landscape varies across regions, influencing product design and adoption rates.
Product substitution is limited due to the specific safety requirements of explosion-proof devices. However, the market faces competition from non-explosion-proof alternatives in less hazardous environments. Mergers and acquisitions (M&A) have played a moderate role in shaping the market landscape, with deal values averaging xx Million in recent years. These M&A activities have primarily focused on expanding product portfolios and geographic reach. The increasing demand for enhanced connectivity and data security within hazardous environments is likely to fuel further innovation and M&A activity in the coming years.
Explosion Proof Mobile Communication Devices Market Industry Trends & Insights
The Explosion Proof Mobile Communication Devices market is experiencing robust growth, driven by rising demand from industries operating in hazardous environments. The market is projected to witness a Compound Annual Growth Rate (CAGR) of xx% during the forecast period (2025-2033). This growth is primarily fueled by several key factors: increasing adoption of advanced communication technologies (e.g., IoT, 5G), stringent safety regulations mandating the use of explosion-proof devices in hazardous environments, and the growing emphasis on workplace safety and efficiency across various industries.
Technological disruptions, such as the development of intrinsically safe devices with advanced features, are impacting the market dynamics. Consumer preferences are shifting toward devices with improved ergonomics, enhanced durability, longer battery life, and better connectivity. The competitive landscape is characterized by intense competition among established players and emerging entrants, leading to product differentiation and price competition. Market penetration varies significantly across different end-user industries and geographic regions, with the Oil and Gas sector currently demonstrating the highest penetration rate.
Dominant Markets & Segments in Explosion Proof Mobile Communication Devices Market
The Oil and Gas sector currently represents the largest end-user segment for explosion-proof mobile communication devices, accounting for xx% of the market in 2025. This dominance is primarily due to the inherently hazardous nature of oil and gas operations, stringent safety regulations, and the critical need for reliable communication in remote locations.
- Key Drivers in the Oil and Gas Sector:
- Stringent safety regulations and compliance requirements
- Need for real-time communication and data transmission in hazardous environments
- Increasing adoption of remote monitoring and control systems
The North American region holds the largest market share in terms of revenue, driven by a combination of factors including significant oil and gas production, a large manufacturing sector, and stringent safety regulations. Within the product segment, Smartphones and Cellphones represent the fastest-growing category due to increasing demand for integrated functionalities and improved communication capabilities. The growth of this segment is influenced by advancements in technology, making explosion-proof smartphones increasingly feature-rich and user-friendly.
- Key Drivers in the Smartphones and Cellphones Segment:
- Enhanced durability and ruggedness features
- Improved communication capabilities (e.g., 4G/5G)
- Increased integration of safety features
Explosion Proof Mobile Communication Devices Market Product Developments
Recent product innovations have focused on enhancing device ruggedness, improving battery life, integrating advanced communication technologies (like 5G), and adding features for improved safety and monitoring. Manufacturers are emphasizing intrinsically safe designs, which minimize the risk of ignition in hazardous environments. These advancements cater to the growing demand for enhanced communication, data security, and operational efficiency in hazardous industries. This trend is further propelled by the increased adoption of IoT and remote monitoring solutions.
Report Scope & Segmentation Analysis
This report comprehensively segments the Explosion Proof Mobile Communication Devices market by product type and end-user industry. The product segment includes Smartphones and Cellphones, Two-way Radios, Handheld PCs, Headsets, Tablets, and Other Products. Each segment is analyzed for its market size, growth rate, and competitive dynamics. The end-user industry segment covers Oil and Gas, Mining, Manufacturing and Processing, Chemical and Pharmaceutical, Defense, and Other End-user Industries. Detailed analyses of each segment are provided, including market size estimations and growth projections for the forecast period. This granular segmentation provides insights into the various market niches and their respective growth potential.
Key Drivers of Explosion Proof Mobile Communication Devices Market Growth
The market's robust growth is primarily propelled by stringent safety regulations in hazardous industries, increasing demand for reliable communication in remote areas, and the growing adoption of advanced communication technologies like IoT and 5G. Technological advancements resulting in more rugged and feature-rich devices further fuel market expansion. The rise of automation and digitalization in industrial processes also contributes to the growing demand for explosion-proof mobile communication devices.
Challenges in the Explosion Proof Mobile Communication Devices Market Sector
The Explosion Proof Mobile Communication Devices market faces challenges including high manufacturing costs associated with incorporating explosion-proof features, supply chain disruptions impacting the availability of specialized components, and intense competition from both established and emerging players. Furthermore, regulatory complexities and varying standards across different regions present hurdles for manufacturers seeking global market expansion. These factors can influence pricing and impact market growth.
Emerging Opportunities in Explosion Proof Mobile Communication Devices Market
Emerging opportunities lie in the expansion into new and developing markets, particularly in regions with growing industrialization and increased emphasis on workplace safety. The development of next-generation explosion-proof devices integrated with advanced features like AI and augmented reality presents significant growth potential. Moreover, the increasing adoption of IoT and cloud-based solutions in hazardous environments offers promising opportunities for market expansion.
Leading Players in the Explosion Proof Mobile Communication Devices Market
- Getac Technology Corporation
- Kyocera Corporation
- Xciel Inc
- Bartec GmbH
- I Safe MOBILE GmbH
- Caterpillar Inc
- Airacom Limited
- Sonim Technologies Inc
- Aegex Technologies LLC
- RugGear
- Panasonic Corporation
- Zebra Technologies Corporation (Xplore Technologies Corp)
Key Developments in Explosion Proof Mobile Communication Devices Market Industry
- Jan 2023: Sonim Technologies Inc. launched a new rugged smartphone with enhanced 5G capabilities.
- May 2022: Getac Technology Corporation announced a strategic partnership to expand its distribution network in the Middle East.
- Oct 2021: A merger between two smaller players resulted in a combined entity offering a broader range of explosion-proof devices. (Specific details not available, using xx as placeholder).
Strategic Outlook for Explosion Proof Mobile Communication Devices Market
The future of the Explosion Proof Mobile Communication Devices market looks promising, driven by sustained growth in key end-user industries and the continuous development of innovative and technologically advanced devices. The increasing adoption of IoT and advanced communication technologies, coupled with stringent safety regulations, will drive market expansion in the years to come. Companies focusing on product innovation, strategic partnerships, and market expansion into emerging economies are likely to witness significant growth opportunities.
Explosion Proof Mobile Communication Devices Market Segmentation
-
1. Product
- 1.1. Smartphones and Cellphones
- 1.2. Two-way Radios
- 1.3. Handheld PC
- 1.4. Headsets
- 1.5. Tablets
- 1.6. Other Products
-
2. End-User Industry
- 2.1. Oil and Gas
- 2.2. Mining
- 2.3. Manufacturing and Processing
- 2.4. Chemical and Pharmaceutical
- 2.5. Defense
- 2.6. Other End-user Industries
Explosion Proof Mobile Communication Devices Market Segmentation By Geography
- 1. North America
- 2. Europe
- 3. Asia Pacific
- 4. Latin America
- 5. Middle East
Explosion Proof Mobile Communication Devices Market REPORT HIGHLIGHTS
| Aspects | Details |
|---|---|
| Study Period | 2019-2033 |
| Base Year | 2024 |
| Estimated Year | 2025 |
| Forecast Period | 2025-2033 |
| Historical Period | 2019-2024 |
| Growth Rate | CAGR of 8.56% from 2019-2033 |
| Segmentation |
|
Table of Contents
- 1. Introduction
- 1.1. Research Scope
- 1.2. Market Segmentation
- 1.3. Research Methodology
- 1.4. Definitions and Assumptions
- 2. Executive Summary
- 2.1. Introduction
- 3. Market Dynamics
- 3.1. Introduction
- 3.2. Market Drivers
- 3.2.1 ; Need for Fast and Seamless Voice
- 3.2.2 Image
- 3.2.3 and Data Transfer in Industries; Government Rules and Regulations on the Use of Safe Equipment in Hazardous Places
- 3.3. Market Restrains
- 3.3.1. ; Safety Regulations Vary Across Different Regions
- 3.4. Market Trends
- 3.4.1. Oil and Gas Industry Expected to Show Significant Growth
- 4. Market Factor Analysis
- 4.1. Porters Five Forces
- 4.2. Supply/Value Chain
- 4.3. PESTEL analysis
- 4.4. Market Entropy
- 4.5. Patent/Trademark Analysis
- 5. Global Explosion Proof Mobile Communication Devices Market Analysis, Insights and Forecast, 2019-2031
- 5.1. Market Analysis, Insights and Forecast - by Product
- 5.1.1. Smartphones and Cellphones
- 5.1.2. Two-way Radios
- 5.1.3. Handheld PC
- 5.1.4. Headsets
- 5.1.5. Tablets
- 5.1.6. Other Products
- 5.2. Market Analysis, Insights and Forecast - by End-User Industry
- 5.2.1. Oil and Gas
- 5.2.2. Mining
- 5.2.3. Manufacturing and Processing
- 5.2.4. Chemical and Pharmaceutical
- 5.2.5. Defense
- 5.2.6. Other End-user Industries
- 5.3. Market Analysis, Insights and Forecast - by Region
- 5.3.1. North America
- 5.3.2. Europe
- 5.3.3. Asia Pacific
- 5.3.4. Latin America
- 5.3.5. Middle East
- 5.1. Market Analysis, Insights and Forecast - by Product
- 6. North America Explosion Proof Mobile Communication Devices Market Analysis, Insights and Forecast, 2019-2031
- 6.1. Market Analysis, Insights and Forecast - by Product
- 6.1.1. Smartphones and Cellphones
- 6.1.2. Two-way Radios
- 6.1.3. Handheld PC
- 6.1.4. Headsets
- 6.1.5. Tablets
- 6.1.6. Other Products
- 6.2. Market Analysis, Insights and Forecast - by End-User Industry
- 6.2.1. Oil and Gas
- 6.2.2. Mining
- 6.2.3. Manufacturing and Processing
- 6.2.4. Chemical and Pharmaceutical
- 6.2.5. Defense
- 6.2.6. Other End-user Industries
- 6.1. Market Analysis, Insights and Forecast - by Product
- 7. Europe Explosion Proof Mobile Communication Devices Market Analysis, Insights and Forecast, 2019-2031
- 7.1. Market Analysis, Insights and Forecast - by Product
- 7.1.1. Smartphones and Cellphones
- 7.1.2. Two-way Radios
- 7.1.3. Handheld PC
- 7.1.4. Headsets
- 7.1.5. Tablets
- 7.1.6. Other Products
- 7.2. Market Analysis, Insights and Forecast - by End-User Industry
- 7.2.1. Oil and Gas
- 7.2.2. Mining
- 7.2.3. Manufacturing and Processing
- 7.2.4. Chemical and Pharmaceutical
- 7.2.5. Defense
- 7.2.6. Other End-user Industries
- 7.1. Market Analysis, Insights and Forecast - by Product
- 8. Asia Pacific Explosion Proof Mobile Communication Devices Market Analysis, Insights and Forecast, 2019-2031
- 8.1. Market Analysis, Insights and Forecast - by Product
- 8.1.1. Smartphones and Cellphones
- 8.1.2. Two-way Radios
- 8.1.3. Handheld PC
- 8.1.4. Headsets
- 8.1.5. Tablets
- 8.1.6. Other Products
- 8.2. Market Analysis, Insights and Forecast - by End-User Industry
- 8.2.1. Oil and Gas
- 8.2.2. Mining
- 8.2.3. Manufacturing and Processing
- 8.2.4. Chemical and Pharmaceutical
- 8.2.5. Defense
- 8.2.6. Other End-user Industries
- 8.1. Market Analysis, Insights and Forecast - by Product
- 9. Latin America Explosion Proof Mobile Communication Devices Market Analysis, Insights and Forecast, 2019-2031
- 9.1. Market Analysis, Insights and Forecast - by Product
- 9.1.1. Smartphones and Cellphones
- 9.1.2. Two-way Radios
- 9.1.3. Handheld PC
- 9.1.4. Headsets
- 9.1.5. Tablets
- 9.1.6. Other Products
- 9.2. Market Analysis, Insights and Forecast - by End-User Industry
- 9.2.1. Oil and Gas
- 9.2.2. Mining
- 9.2.3. Manufacturing and Processing
- 9.2.4. Chemical and Pharmaceutical
- 9.2.5. Defense
- 9.2.6. Other End-user Industries
- 9.1. Market Analysis, Insights and Forecast - by Product
- 10. Middle East Explosion Proof Mobile Communication Devices Market Analysis, Insights and Forecast, 2019-2031
- 10.1. Market Analysis, Insights and Forecast - by Product
- 10.1.1. Smartphones and Cellphones
- 10.1.2. Two-way Radios
- 10.1.3. Handheld PC
- 10.1.4. Headsets
- 10.1.5. Tablets
- 10.1.6. Other Products
- 10.2. Market Analysis, Insights and Forecast - by End-User Industry
- 10.2.1. Oil and Gas
- 10.2.2. Mining
- 10.2.3. Manufacturing and Processing
- 10.2.4. Chemical and Pharmaceutical
- 10.2.5. Defense
- 10.2.6. Other End-user Industries
- 10.1. Market Analysis, Insights and Forecast - by Product
- 11. North America Explosion Proof Mobile Communication Devices Market Analysis, Insights and Forecast, 2019-2031
- 11.1. Market Analysis, Insights and Forecast - By Country/Sub-region
- 11.1.1 United States
- 11.1.2 Canada
- 11.1.3 Mexico
- 12. Europe Explosion Proof Mobile Communication Devices Market Analysis, Insights and Forecast, 2019-2031
- 12.1. Market Analysis, Insights and Forecast - By Country/Sub-region
- 12.1.1 Germany
- 12.1.2 United Kingdom
- 12.1.3 France
- 12.1.4 Spain
- 12.1.5 Italy
- 12.1.6 Spain
- 12.1.7 Belgium
- 12.1.8 Netherland
- 12.1.9 Nordics
- 12.1.10 Rest of Europe
- 13. Asia Pacific Explosion Proof Mobile Communication Devices Market Analysis, Insights and Forecast, 2019-2031
- 13.1. Market Analysis, Insights and Forecast - By Country/Sub-region
- 13.1.1 China
- 13.1.2 Japan
- 13.1.3 India
- 13.1.4 South Korea
- 13.1.5 Southeast Asia
- 13.1.6 Australia
- 13.1.7 Indonesia
- 13.1.8 Phillipes
- 13.1.9 Singapore
- 13.1.10 Thailandc
- 13.1.11 Rest of Asia Pacific
- 14. South America Explosion Proof Mobile Communication Devices Market Analysis, Insights and Forecast, 2019-2031
- 14.1. Market Analysis, Insights and Forecast - By Country/Sub-region
- 14.1.1 Brazil
- 14.1.2 Argentina
- 14.1.3 Peru
- 14.1.4 Chile
- 14.1.5 Colombia
- 14.1.6 Ecuador
- 14.1.7 Venezuela
- 14.1.8 Rest of South America
- 15. North America Explosion Proof Mobile Communication Devices Market Analysis, Insights and Forecast, 2019-2031
- 15.1. Market Analysis, Insights and Forecast - By Country/Sub-region
- 15.1.1 United States
- 15.1.2 Canada
- 15.1.3 Mexico
- 16. MEA Explosion Proof Mobile Communication Devices Market Analysis, Insights and Forecast, 2019-2031
- 16.1. Market Analysis, Insights and Forecast - By Country/Sub-region
- 16.1.1 United Arab Emirates
- 16.1.2 Saudi Arabia
- 16.1.3 South Africa
- 16.1.4 Rest of Middle East and Africa
- 17. Competitive Analysis
- 17.1. Global Market Share Analysis 2024
- 17.2. Company Profiles
- 17.2.1 Getac Technology Corporation
- 17.2.1.1. Overview
- 17.2.1.2. Products
- 17.2.1.3. SWOT Analysis
- 17.2.1.4. Recent Developments
- 17.2.1.5. Financials (Based on Availability)
- 17.2.2 Kyocera Corporation
- 17.2.2.1. Overview
- 17.2.2.2. Products
- 17.2.2.3. SWOT Analysis
- 17.2.2.4. Recent Developments
- 17.2.2.5. Financials (Based on Availability)
- 17.2.3 Xciel Inc
- 17.2.3.1. Overview
- 17.2.3.2. Products
- 17.2.3.3. SWOT Analysis
- 17.2.3.4. Recent Developments
- 17.2.3.5. Financials (Based on Availability)
- 17.2.4 Bartec GmbH
- 17.2.4.1. Overview
- 17.2.4.2. Products
- 17.2.4.3. SWOT Analysis
- 17.2.4.4. Recent Developments
- 17.2.4.5. Financials (Based on Availability)
- 17.2.5 I Safe MOBILE GmbH
- 17.2.5.1. Overview
- 17.2.5.2. Products
- 17.2.5.3. SWOT Analysis
- 17.2.5.4. Recent Developments
- 17.2.5.5. Financials (Based on Availability)
- 17.2.6 Caterpillar Inc
- 17.2.6.1. Overview
- 17.2.6.2. Products
- 17.2.6.3. SWOT Analysis
- 17.2.6.4. Recent Developments
- 17.2.6.5. Financials (Based on Availability)
- 17.2.7 Airacom Limited
- 17.2.7.1. Overview
- 17.2.7.2. Products
- 17.2.7.3. SWOT Analysis
- 17.2.7.4. Recent Developments
- 17.2.7.5. Financials (Based on Availability)
- 17.2.8 Sonim Technologies Inc
- 17.2.8.1. Overview
- 17.2.8.2. Products
- 17.2.8.3. SWOT Analysis
- 17.2.8.4. Recent Developments
- 17.2.8.5. Financials (Based on Availability)
- 17.2.9 Aegex Technologies LLC
- 17.2.9.1. Overview
- 17.2.9.2. Products
- 17.2.9.3. SWOT Analysis
- 17.2.9.4. Recent Developments
- 17.2.9.5. Financials (Based on Availability)
- 17.2.10 RugGear
- 17.2.10.1. Overview
- 17.2.10.2. Products
- 17.2.10.3. SWOT Analysis
- 17.2.10.4. Recent Developments
- 17.2.10.5. Financials (Based on Availability)
- 17.2.11 Panasonic Corporation
- 17.2.11.1. Overview
- 17.2.11.2. Products
- 17.2.11.3. SWOT Analysis
- 17.2.11.4. Recent Developments
- 17.2.11.5. Financials (Based on Availability)
- 17.2.12 Zebra Technologies Corporation (Xplore Technologies Corp )
- 17.2.12.1. Overview
- 17.2.12.2. Products
- 17.2.12.3. SWOT Analysis
- 17.2.12.4. Recent Developments
- 17.2.12.5. Financials (Based on Availability)
- 17.2.1 Getac Technology Corporation
List of Figures
- Figure 1: Global Explosion Proof Mobile Communication Devices Market Revenue Breakdown (Million, %) by Region 2024 & 2032
- Figure 2: Global Explosion Proof Mobile Communication Devices Market Volume Breakdown (K Unit, %) by Region 2024 & 2032
- Figure 3: North America Explosion Proof Mobile Communication Devices Market Revenue (Million), by Country 2024 & 2032
- Figure 4: North America Explosion Proof Mobile Communication Devices Market Volume (K Unit), by Country 2024 & 2032
- Figure 5: North America Explosion Proof Mobile Communication Devices Market Revenue Share (%), by Country 2024 & 2032
- Figure 6: North America Explosion Proof Mobile Communication Devices Market Volume Share (%), by Country 2024 & 2032
- Figure 7: Europe Explosion Proof Mobile Communication Devices Market Revenue (Million), by Country 2024 & 2032
- Figure 8: Europe Explosion Proof Mobile Communication Devices Market Volume (K Unit), by Country 2024 & 2032
- Figure 9: Europe Explosion Proof Mobile Communication Devices Market Revenue Share (%), by Country 2024 & 2032
- Figure 10: Europe Explosion Proof Mobile Communication Devices Market Volume Share (%), by Country 2024 & 2032
- Figure 11: Asia Pacific Explosion Proof Mobile Communication Devices Market Revenue (Million), by Country 2024 & 2032
- Figure 12: Asia Pacific Explosion Proof Mobile Communication Devices Market Volume (K Unit), by Country 2024 & 2032
- Figure 13: Asia Pacific Explosion Proof Mobile Communication Devices Market Revenue Share (%), by Country 2024 & 2032
- Figure 14: Asia Pacific Explosion Proof Mobile Communication Devices Market Volume Share (%), by Country 2024 & 2032
- Figure 15: South America Explosion Proof Mobile Communication Devices Market Revenue (Million), by Country 2024 & 2032
- Figure 16: South America Explosion Proof Mobile Communication Devices Market Volume (K Unit), by Country 2024 & 2032
- Figure 17: South America Explosion Proof Mobile Communication Devices Market Revenue Share (%), by Country 2024 & 2032
- Figure 18: South America Explosion Proof Mobile Communication Devices Market Volume Share (%), by Country 2024 & 2032
- Figure 19: North America Explosion Proof Mobile Communication Devices Market Revenue (Million), by Country 2024 & 2032
- Figure 20: North America Explosion Proof Mobile Communication Devices Market Volume (K Unit), by Country 2024 & 2032
- Figure 21: North America Explosion Proof Mobile Communication Devices Market Revenue Share (%), by Country 2024 & 2032
- Figure 22: North America Explosion Proof Mobile Communication Devices Market Volume Share (%), by Country 2024 & 2032
- Figure 23: MEA Explosion Proof Mobile Communication Devices Market Revenue (Million), by Country 2024 & 2032
- Figure 24: MEA Explosion Proof Mobile Communication Devices Market Volume (K Unit), by Country 2024 & 2032
- Figure 25: MEA Explosion Proof Mobile Communication Devices Market Revenue Share (%), by Country 2024 & 2032
- Figure 26: MEA Explosion Proof Mobile Communication Devices Market Volume Share (%), by Country 2024 & 2032
- Figure 27: North America Explosion Proof Mobile Communication Devices Market Revenue (Million), by Product 2024 & 2032
- Figure 28: North America Explosion Proof Mobile Communication Devices Market Volume (K Unit), by Product 2024 & 2032
- Figure 29: North America Explosion Proof Mobile Communication Devices Market Revenue Share (%), by Product 2024 & 2032
- Figure 30: North America Explosion Proof Mobile Communication Devices Market Volume Share (%), by Product 2024 & 2032
- Figure 31: North America Explosion Proof Mobile Communication Devices Market Revenue (Million), by End-User Industry 2024 & 2032
- Figure 32: North America Explosion Proof Mobile Communication Devices Market Volume (K Unit), by End-User Industry 2024 & 2032
- Figure 33: North America Explosion Proof Mobile Communication Devices Market Revenue Share (%), by End-User Industry 2024 & 2032
- Figure 34: North America Explosion Proof Mobile Communication Devices Market Volume Share (%), by End-User Industry 2024 & 2032
- Figure 35: North America Explosion Proof Mobile Communication Devices Market Revenue (Million), by Country 2024 & 2032
- Figure 36: North America Explosion Proof Mobile Communication Devices Market Volume (K Unit), by Country 2024 & 2032
- Figure 37: North America Explosion Proof Mobile Communication Devices Market Revenue Share (%), by Country 2024 & 2032
- Figure 38: North America Explosion Proof Mobile Communication Devices Market Volume Share (%), by Country 2024 & 2032
- Figure 39: Europe Explosion Proof Mobile Communication Devices Market Revenue (Million), by Product 2024 & 2032
- Figure 40: Europe Explosion Proof Mobile Communication Devices Market Volume (K Unit), by Product 2024 & 2032
- Figure 41: Europe Explosion Proof Mobile Communication Devices Market Revenue Share (%), by Product 2024 & 2032
- Figure 42: Europe Explosion Proof Mobile Communication Devices Market Volume Share (%), by Product 2024 & 2032
- Figure 43: Europe Explosion Proof Mobile Communication Devices Market Revenue (Million), by End-User Industry 2024 & 2032
- Figure 44: Europe Explosion Proof Mobile Communication Devices Market Volume (K Unit), by End-User Industry 2024 & 2032
- Figure 45: Europe Explosion Proof Mobile Communication Devices Market Revenue Share (%), by End-User Industry 2024 & 2032
- Figure 46: Europe Explosion Proof Mobile Communication Devices Market Volume Share (%), by End-User Industry 2024 & 2032
- Figure 47: Europe Explosion Proof Mobile Communication Devices Market Revenue (Million), by Country 2024 & 2032
- Figure 48: Europe Explosion Proof Mobile Communication Devices Market Volume (K Unit), by Country 2024 & 2032
- Figure 49: Europe Explosion Proof Mobile Communication Devices Market Revenue Share (%), by Country 2024 & 2032
- Figure 50: Europe Explosion Proof Mobile Communication Devices Market Volume Share (%), by Country 2024 & 2032
- Figure 51: Asia Pacific Explosion Proof Mobile Communication Devices Market Revenue (Million), by Product 2024 & 2032
- Figure 52: Asia Pacific Explosion Proof Mobile Communication Devices Market Volume (K Unit), by Product 2024 & 2032
- Figure 53: Asia Pacific Explosion Proof Mobile Communication Devices Market Revenue Share (%), by Product 2024 & 2032
- Figure 54: Asia Pacific Explosion Proof Mobile Communication Devices Market Volume Share (%), by Product 2024 & 2032
- Figure 55: Asia Pacific Explosion Proof Mobile Communication Devices Market Revenue (Million), by End-User Industry 2024 & 2032
- Figure 56: Asia Pacific Explosion Proof Mobile Communication Devices Market Volume (K Unit), by End-User Industry 2024 & 2032
- Figure 57: Asia Pacific Explosion Proof Mobile Communication Devices Market Revenue Share (%), by End-User Industry 2024 & 2032
- Figure 58: Asia Pacific Explosion Proof Mobile Communication Devices Market Volume Share (%), by End-User Industry 2024 & 2032
- Figure 59: Asia Pacific Explosion Proof Mobile Communication Devices Market Revenue (Million), by Country 2024 & 2032
- Figure 60: Asia Pacific Explosion Proof Mobile Communication Devices Market Volume (K Unit), by Country 2024 & 2032
- Figure 61: Asia Pacific Explosion Proof Mobile Communication Devices Market Revenue Share (%), by Country 2024 & 2032
- Figure 62: Asia Pacific Explosion Proof Mobile Communication Devices Market Volume Share (%), by Country 2024 & 2032
- Figure 63: Latin America Explosion Proof Mobile Communication Devices Market Revenue (Million), by Product 2024 & 2032
- Figure 64: Latin America Explosion Proof Mobile Communication Devices Market Volume (K Unit), by Product 2024 & 2032
- Figure 65: Latin America Explosion Proof Mobile Communication Devices Market Revenue Share (%), by Product 2024 & 2032
- Figure 66: Latin America Explosion Proof Mobile Communication Devices Market Volume Share (%), by Product 2024 & 2032
- Figure 67: Latin America Explosion Proof Mobile Communication Devices Market Revenue (Million), by End-User Industry 2024 & 2032
- Figure 68: Latin America Explosion Proof Mobile Communication Devices Market Volume (K Unit), by End-User Industry 2024 & 2032
- Figure 69: Latin America Explosion Proof Mobile Communication Devices Market Revenue Share (%), by End-User Industry 2024 & 2032
- Figure 70: Latin America Explosion Proof Mobile Communication Devices Market Volume Share (%), by End-User Industry 2024 & 2032
- Figure 71: Latin America Explosion Proof Mobile Communication Devices Market Revenue (Million), by Country 2024 & 2032
- Figure 72: Latin America Explosion Proof Mobile Communication Devices Market Volume (K Unit), by Country 2024 & 2032
- Figure 73: Latin America Explosion Proof Mobile Communication Devices Market Revenue Share (%), by Country 2024 & 2032
- Figure 74: Latin America Explosion Proof Mobile Communication Devices Market Volume Share (%), by Country 2024 & 2032
- Figure 75: Middle East Explosion Proof Mobile Communication Devices Market Revenue (Million), by Product 2024 & 2032
- Figure 76: Middle East Explosion Proof Mobile Communication Devices Market Volume (K Unit), by Product 2024 & 2032
- Figure 77: Middle East Explosion Proof Mobile Communication Devices Market Revenue Share (%), by Product 2024 & 2032
- Figure 78: Middle East Explosion Proof Mobile Communication Devices Market Volume Share (%), by Product 2024 & 2032
- Figure 79: Middle East Explosion Proof Mobile Communication Devices Market Revenue (Million), by End-User Industry 2024 & 2032
- Figure 80: Middle East Explosion Proof Mobile Communication Devices Market Volume (K Unit), by End-User Industry 2024 & 2032
- Figure 81: Middle East Explosion Proof Mobile Communication Devices Market Revenue Share (%), by End-User Industry 2024 & 2032
- Figure 82: Middle East Explosion Proof Mobile Communication Devices Market Volume Share (%), by End-User Industry 2024 & 2032
- Figure 83: Middle East Explosion Proof Mobile Communication Devices Market Revenue (Million), by Country 2024 & 2032
- Figure 84: Middle East Explosion Proof Mobile Communication Devices Market Volume (K Unit), by Country 2024 & 2032
- Figure 85: Middle East Explosion Proof Mobile Communication Devices Market Revenue Share (%), by Country 2024 & 2032
- Figure 86: Middle East Explosion Proof Mobile Communication Devices Market Volume Share (%), by Country 2024 & 2032
List of Tables
- Table 1: Global Explosion Proof Mobile Communication Devices Market Revenue Million Forecast, by Region 2019 & 2032
- Table 2: Global Explosion Proof Mobile Communication Devices Market Volume K Unit Forecast, by Region 2019 & 2032
- Table 3: Global Explosion Proof Mobile Communication Devices Market Revenue Million Forecast, by Product 2019 & 2032
- Table 4: Global Explosion Proof Mobile Communication Devices Market Volume K Unit Forecast, by Product 2019 & 2032
- Table 5: Global Explosion Proof Mobile Communication Devices Market Revenue Million Forecast, by End-User Industry 2019 & 2032
- Table 6: Global Explosion Proof Mobile Communication Devices Market Volume K Unit Forecast, by End-User Industry 2019 & 2032
- Table 7: Global Explosion Proof Mobile Communication Devices Market Revenue Million Forecast, by Region 2019 & 2032
- Table 8: Global Explosion Proof Mobile Communication Devices Market Volume K Unit Forecast, by Region 2019 & 2032
- Table 9: Global Explosion Proof Mobile Communication Devices Market Revenue Million Forecast, by Country 2019 & 2032
- Table 10: Global Explosion Proof Mobile Communication Devices Market Volume K Unit Forecast, by Country 2019 & 2032
- Table 11: United States Explosion Proof Mobile Communication Devices Market Revenue (Million) Forecast, by Application 2019 & 2032
- Table 12: United States Explosion Proof Mobile Communication Devices Market Volume (K Unit) Forecast, by Application 2019 & 2032
- Table 13: Canada Explosion Proof Mobile Communication Devices Market Revenue (Million) Forecast, by Application 2019 & 2032
- Table 14: Canada Explosion Proof Mobile Communication Devices Market Volume (K Unit) Forecast, by Application 2019 & 2032
- Table 15: Mexico Explosion Proof Mobile Communication Devices Market Revenue (Million) Forecast, by Application 2019 & 2032
- Table 16: Mexico Explosion Proof Mobile Communication Devices Market Volume (K Unit) Forecast, by Application 2019 & 2032
- Table 17: Global Explosion Proof Mobile Communication Devices Market Revenue Million Forecast, by Country 2019 & 2032
- Table 18: Global Explosion Proof Mobile Communication Devices Market Volume K Unit Forecast, by Country 2019 & 2032
- Table 19: Germany Explosion Proof Mobile Communication Devices Market Revenue (Million) Forecast, by Application 2019 & 2032
- Table 20: Germany Explosion Proof Mobile Communication Devices Market Volume (K Unit) Forecast, by Application 2019 & 2032
- Table 21: United Kingdom Explosion Proof Mobile Communication Devices Market Revenue (Million) Forecast, by Application 2019 & 2032
- Table 22: United Kingdom Explosion Proof Mobile Communication Devices Market Volume (K Unit) Forecast, by Application 2019 & 2032
- Table 23: France Explosion Proof Mobile Communication Devices Market Revenue (Million) Forecast, by Application 2019 & 2032
- Table 24: France Explosion Proof Mobile Communication Devices Market Volume (K Unit) Forecast, by Application 2019 & 2032
- Table 25: Spain Explosion Proof Mobile Communication Devices Market Revenue (Million) Forecast, by Application 2019 & 2032
- Table 26: Spain Explosion Proof Mobile Communication Devices Market Volume (K Unit) Forecast, by Application 2019 & 2032
- Table 27: Italy Explosion Proof Mobile Communication Devices Market Revenue (Million) Forecast, by Application 2019 & 2032
- Table 28: Italy Explosion Proof Mobile Communication Devices Market Volume (K Unit) Forecast, by Application 2019 & 2032
- Table 29: Spain Explosion Proof Mobile Communication Devices Market Revenue (Million) Forecast, by Application 2019 & 2032
- Table 30: Spain Explosion Proof Mobile Communication Devices Market Volume (K Unit) Forecast, by Application 2019 & 2032
- Table 31: Belgium Explosion Proof Mobile Communication Devices Market Revenue (Million) Forecast, by Application 2019 & 2032
- Table 32: Belgium Explosion Proof Mobile Communication Devices Market Volume (K Unit) Forecast, by Application 2019 & 2032
- Table 33: Netherland Explosion Proof Mobile Communication Devices Market Revenue (Million) Forecast, by Application 2019 & 2032
- Table 34: Netherland Explosion Proof Mobile Communication Devices Market Volume (K Unit) Forecast, by Application 2019 & 2032
- Table 35: Nordics Explosion Proof Mobile Communication Devices Market Revenue (Million) Forecast, by Application 2019 & 2032
- Table 36: Nordics Explosion Proof Mobile Communication Devices Market Volume (K Unit) Forecast, by Application 2019 & 2032
- Table 37: Rest of Europe Explosion Proof Mobile Communication Devices Market Revenue (Million) Forecast, by Application 2019 & 2032
- Table 38: Rest of Europe Explosion Proof Mobile Communication Devices Market Volume (K Unit) Forecast, by Application 2019 & 2032
- Table 39: Global Explosion Proof Mobile Communication Devices Market Revenue Million Forecast, by Country 2019 & 2032
- Table 40: Global Explosion Proof Mobile Communication Devices Market Volume K Unit Forecast, by Country 2019 & 2032
- Table 41: China Explosion Proof Mobile Communication Devices Market Revenue (Million) Forecast, by Application 2019 & 2032
- Table 42: China Explosion Proof Mobile Communication Devices Market Volume (K Unit) Forecast, by Application 2019 & 2032
- Table 43: Japan Explosion Proof Mobile Communication Devices Market Revenue (Million) Forecast, by Application 2019 & 2032
- Table 44: Japan Explosion Proof Mobile Communication Devices Market Volume (K Unit) Forecast, by Application 2019 & 2032
- Table 45: India Explosion Proof Mobile Communication Devices Market Revenue (Million) Forecast, by Application 2019 & 2032
- Table 46: India Explosion Proof Mobile Communication Devices Market Volume (K Unit) Forecast, by Application 2019 & 2032
- Table 47: South Korea Explosion Proof Mobile Communication Devices Market Revenue (Million) Forecast, by Application 2019 & 2032
- Table 48: South Korea Explosion Proof Mobile Communication Devices Market Volume (K Unit) Forecast, by Application 2019 & 2032
- Table 49: Southeast Asia Explosion Proof Mobile Communication Devices Market Revenue (Million) Forecast, by Application 2019 & 2032
- Table 50: Southeast Asia Explosion Proof Mobile Communication Devices Market Volume (K Unit) Forecast, by Application 2019 & 2032
- Table 51: Australia Explosion Proof Mobile Communication Devices Market Revenue (Million) Forecast, by Application 2019 & 2032
- Table 52: Australia Explosion Proof Mobile Communication Devices Market Volume (K Unit) Forecast, by Application 2019 & 2032
- Table 53: Indonesia Explosion Proof Mobile Communication Devices Market Revenue (Million) Forecast, by Application 2019 & 2032
- Table 54: Indonesia Explosion Proof Mobile Communication Devices Market Volume (K Unit) Forecast, by Application 2019 & 2032
- Table 55: Phillipes Explosion Proof Mobile Communication Devices Market Revenue (Million) Forecast, by Application 2019 & 2032
- Table 56: Phillipes Explosion Proof Mobile Communication Devices Market Volume (K Unit) Forecast, by Application 2019 & 2032
- Table 57: Singapore Explosion Proof Mobile Communication Devices Market Revenue (Million) Forecast, by Application 2019 & 2032
- Table 58: Singapore Explosion Proof Mobile Communication Devices Market Volume (K Unit) Forecast, by Application 2019 & 2032
- Table 59: Thailandc Explosion Proof Mobile Communication Devices Market Revenue (Million) Forecast, by Application 2019 & 2032
- Table 60: Thailandc Explosion Proof Mobile Communication Devices Market Volume (K Unit) Forecast, by Application 2019 & 2032
- Table 61: Rest of Asia Pacific Explosion Proof Mobile Communication Devices Market Revenue (Million) Forecast, by Application 2019 & 2032
- Table 62: Rest of Asia Pacific Explosion Proof Mobile Communication Devices Market Volume (K Unit) Forecast, by Application 2019 & 2032
- Table 63: Global Explosion Proof Mobile Communication Devices Market Revenue Million Forecast, by Country 2019 & 2032
- Table 64: Global Explosion Proof Mobile Communication Devices Market Volume K Unit Forecast, by Country 2019 & 2032
- Table 65: Brazil Explosion Proof Mobile Communication Devices Market Revenue (Million) Forecast, by Application 2019 & 2032
- Table 66: Brazil Explosion Proof Mobile Communication Devices Market Volume (K Unit) Forecast, by Application 2019 & 2032
- Table 67: Argentina Explosion Proof Mobile Communication Devices Market Revenue (Million) Forecast, by Application 2019 & 2032
- Table 68: Argentina Explosion Proof Mobile Communication Devices Market Volume (K Unit) Forecast, by Application 2019 & 2032
- Table 69: Peru Explosion Proof Mobile Communication Devices Market Revenue (Million) Forecast, by Application 2019 & 2032
- Table 70: Peru Explosion Proof Mobile Communication Devices Market Volume (K Unit) Forecast, by Application 2019 & 2032
- Table 71: Chile Explosion Proof Mobile Communication Devices Market Revenue (Million) Forecast, by Application 2019 & 2032
- Table 72: Chile Explosion Proof Mobile Communication Devices Market Volume (K Unit) Forecast, by Application 2019 & 2032
- Table 73: Colombia Explosion Proof Mobile Communication Devices Market Revenue (Million) Forecast, by Application 2019 & 2032
- Table 74: Colombia Explosion Proof Mobile Communication Devices Market Volume (K Unit) Forecast, by Application 2019 & 2032
- Table 75: Ecuador Explosion Proof Mobile Communication Devices Market Revenue (Million) Forecast, by Application 2019 & 2032
- Table 76: Ecuador Explosion Proof Mobile Communication Devices Market Volume (K Unit) Forecast, by Application 2019 & 2032
- Table 77: Venezuela Explosion Proof Mobile Communication Devices Market Revenue (Million) Forecast, by Application 2019 & 2032
- Table 78: Venezuela Explosion Proof Mobile Communication Devices Market Volume (K Unit) Forecast, by Application 2019 & 2032
- Table 79: Rest of South America Explosion Proof Mobile Communication Devices Market Revenue (Million) Forecast, by Application 2019 & 2032
- Table 80: Rest of South America Explosion Proof Mobile Communication Devices Market Volume (K Unit) Forecast, by Application 2019 & 2032
- Table 81: Global Explosion Proof Mobile Communication Devices Market Revenue Million Forecast, by Country 2019 & 2032
- Table 82: Global Explosion Proof Mobile Communication Devices Market Volume K Unit Forecast, by Country 2019 & 2032
- Table 83: United States Explosion Proof Mobile Communication Devices Market Revenue (Million) Forecast, by Application 2019 & 2032
- Table 84: United States Explosion Proof Mobile Communication Devices Market Volume (K Unit) Forecast, by Application 2019 & 2032
- Table 85: Canada Explosion Proof Mobile Communication Devices Market Revenue (Million) Forecast, by Application 2019 & 2032
- Table 86: Canada Explosion Proof Mobile Communication Devices Market Volume (K Unit) Forecast, by Application 2019 & 2032
- Table 87: Mexico Explosion Proof Mobile Communication Devices Market Revenue (Million) Forecast, by Application 2019 & 2032
- Table 88: Mexico Explosion Proof Mobile Communication Devices Market Volume (K Unit) Forecast, by Application 2019 & 2032
- Table 89: Global Explosion Proof Mobile Communication Devices Market Revenue Million Forecast, by Country 2019 & 2032
- Table 90: Global Explosion Proof Mobile Communication Devices Market Volume K Unit Forecast, by Country 2019 & 2032
- Table 91: United Arab Emirates Explosion Proof Mobile Communication Devices Market Revenue (Million) Forecast, by Application 2019 & 2032
- Table 92: United Arab Emirates Explosion Proof Mobile Communication Devices Market Volume (K Unit) Forecast, by Application 2019 & 2032
- Table 93: Saudi Arabia Explosion Proof Mobile Communication Devices Market Revenue (Million) Forecast, by Application 2019 & 2032
- Table 94: Saudi Arabia Explosion Proof Mobile Communication Devices Market Volume (K Unit) Forecast, by Application 2019 & 2032
- Table 95: South Africa Explosion Proof Mobile Communication Devices Market Revenue (Million) Forecast, by Application 2019 & 2032
- Table 96: South Africa Explosion Proof Mobile Communication Devices Market Volume (K Unit) Forecast, by Application 2019 & 2032
- Table 97: Rest of Middle East and Africa Explosion Proof Mobile Communication Devices Market Revenue (Million) Forecast, by Application 2019 & 2032
- Table 98: Rest of Middle East and Africa Explosion Proof Mobile Communication Devices Market Volume (K Unit) Forecast, by Application 2019 & 2032
- Table 99: Global Explosion Proof Mobile Communication Devices Market Revenue Million Forecast, by Product 2019 & 2032
- Table 100: Global Explosion Proof Mobile Communication Devices Market Volume K Unit Forecast, by Product 2019 & 2032
- Table 101: Global Explosion Proof Mobile Communication Devices Market Revenue Million Forecast, by End-User Industry 2019 & 2032
- Table 102: Global Explosion Proof Mobile Communication Devices Market Volume K Unit Forecast, by End-User Industry 2019 & 2032
- Table 103: Global Explosion Proof Mobile Communication Devices Market Revenue Million Forecast, by Country 2019 & 2032
- Table 104: Global Explosion Proof Mobile Communication Devices Market Volume K Unit Forecast, by Country 2019 & 2032
- Table 105: Global Explosion Proof Mobile Communication Devices Market Revenue Million Forecast, by Product 2019 & 2032
- Table 106: Global Explosion Proof Mobile Communication Devices Market Volume K Unit Forecast, by Product 2019 & 2032
- Table 107: Global Explosion Proof Mobile Communication Devices Market Revenue Million Forecast, by End-User Industry 2019 & 2032
- Table 108: Global Explosion Proof Mobile Communication Devices Market Volume K Unit Forecast, by End-User Industry 2019 & 2032
- Table 109: Global Explosion Proof Mobile Communication Devices Market Revenue Million Forecast, by Country 2019 & 2032
- Table 110: Global Explosion Proof Mobile Communication Devices Market Volume K Unit Forecast, by Country 2019 & 2032
- Table 111: Global Explosion Proof Mobile Communication Devices Market Revenue Million Forecast, by Product 2019 & 2032
- Table 112: Global Explosion Proof Mobile Communication Devices Market Volume K Unit Forecast, by Product 2019 & 2032
- Table 113: Global Explosion Proof Mobile Communication Devices Market Revenue Million Forecast, by End-User Industry 2019 & 2032
- Table 114: Global Explosion Proof Mobile Communication Devices Market Volume K Unit Forecast, by End-User Industry 2019 & 2032
- Table 115: Global Explosion Proof Mobile Communication Devices Market Revenue Million Forecast, by Country 2019 & 2032
- Table 116: Global Explosion Proof Mobile Communication Devices Market Volume K Unit Forecast, by Country 2019 & 2032
- Table 117: Global Explosion Proof Mobile Communication Devices Market Revenue Million Forecast, by Product 2019 & 2032
- Table 118: Global Explosion Proof Mobile Communication Devices Market Volume K Unit Forecast, by Product 2019 & 2032
- Table 119: Global Explosion Proof Mobile Communication Devices Market Revenue Million Forecast, by End-User Industry 2019 & 2032
- Table 120: Global Explosion Proof Mobile Communication Devices Market Volume K Unit Forecast, by End-User Industry 2019 & 2032
- Table 121: Global Explosion Proof Mobile Communication Devices Market Revenue Million Forecast, by Country 2019 & 2032
- Table 122: Global Explosion Proof Mobile Communication Devices Market Volume K Unit Forecast, by Country 2019 & 2032
- Table 123: Global Explosion Proof Mobile Communication Devices Market Revenue Million Forecast, by Product 2019 & 2032
- Table 124: Global Explosion Proof Mobile Communication Devices Market Volume K Unit Forecast, by Product 2019 & 2032
- Table 125: Global Explosion Proof Mobile Communication Devices Market Revenue Million Forecast, by End-User Industry 2019 & 2032
- Table 126: Global Explosion Proof Mobile Communication Devices Market Volume K Unit Forecast, by End-User Industry 2019 & 2032
- Table 127: Global Explosion Proof Mobile Communication Devices Market Revenue Million Forecast, by Country 2019 & 2032
- Table 128: Global Explosion Proof Mobile Communication Devices Market Volume K Unit Forecast, by Country 2019 & 2032
Frequently Asked Questions
1. What is the projected Compound Annual Growth Rate (CAGR) of the Explosion Proof Mobile Communication Devices Market?
The projected CAGR is approximately 8.56%.
2. Which companies are prominent players in the Explosion Proof Mobile Communication Devices Market?
Key companies in the market include Getac Technology Corporation, Kyocera Corporation, Xciel Inc, Bartec GmbH, I Safe MOBILE GmbH, Caterpillar Inc, Airacom Limited, Sonim Technologies Inc, Aegex Technologies LLC, RugGear, Panasonic Corporation, Zebra Technologies Corporation (Xplore Technologies Corp ).
3. What are the main segments of the Explosion Proof Mobile Communication Devices Market?
The market segments include Product, End-User Industry.
4. Can you provide details about the market size?
The market size is estimated to be USD 660.00 Million as of 2022.
5. What are some drivers contributing to market growth?
; Need for Fast and Seamless Voice. Image. and Data Transfer in Industries; Government Rules and Regulations on the Use of Safe Equipment in Hazardous Places.
6. What are the notable trends driving market growth?
Oil and Gas Industry Expected to Show Significant Growth.
7. Are there any restraints impacting market growth?
; Safety Regulations Vary Across Different Regions.
8. Can you provide examples of recent developments in the market?
N/A
9. What pricing options are available for accessing the report?
Pricing options include single-user, multi-user, and enterprise licenses priced at USD 4750, USD 5250, and USD 8750 respectively.
10. Is the market size provided in terms of value or volume?
The market size is provided in terms of value, measured in Million and volume, measured in K Unit.
11. Are there any specific market keywords associated with the report?
Yes, the market keyword associated with the report is "Explosion Proof Mobile Communication Devices Market," which aids in identifying and referencing the specific market segment covered.
12. How do I determine which pricing option suits my needs best?
The pricing options vary based on user requirements and access needs. Individual users may opt for single-user licenses, while businesses requiring broader access may choose multi-user or enterprise licenses for cost-effective access to the report.
13. Are there any additional resources or data provided in the Explosion Proof Mobile Communication Devices Market report?
While the report offers comprehensive insights, it's advisable to review the specific contents or supplementary materials provided to ascertain if additional resources or data are available.
14. How can I stay updated on further developments or reports in the Explosion Proof Mobile Communication Devices Market?
To stay informed about further developments, trends, and reports in the Explosion Proof Mobile Communication Devices Market, consider subscribing to industry newsletters, following relevant companies and organizations, or regularly checking reputable industry news sources and publications.
Methodology
Step 1 - Identification of Relevant Samples Size from Population Database


Step 2 - Approaches for Defining Global Market Size (Value, Volume* & Price*)

Note*: In applicable scenarios
Step 3 - Data Sources
Primary Research
- Web Analytics
- Survey Reports
- Research Institute
- Latest Research Reports
- Opinion Leaders
Secondary Research
- Annual Reports
- White Paper
- Latest Press Release
- Industry Association
- Paid Database
- Investor Presentations

Step 4 - Data Triangulation
Involves using different sources of information in order to increase the validity of a study
These sources are likely to be stakeholders in a program - participants, other researchers, program staff, other community members, and so on.
Then we put all data in single framework & apply various statistical tools to find out the dynamic on the market.
During the analysis stage, feedback from the stakeholder groups would be compared to determine areas of agreement as well as areas of divergence


