
Key Insights
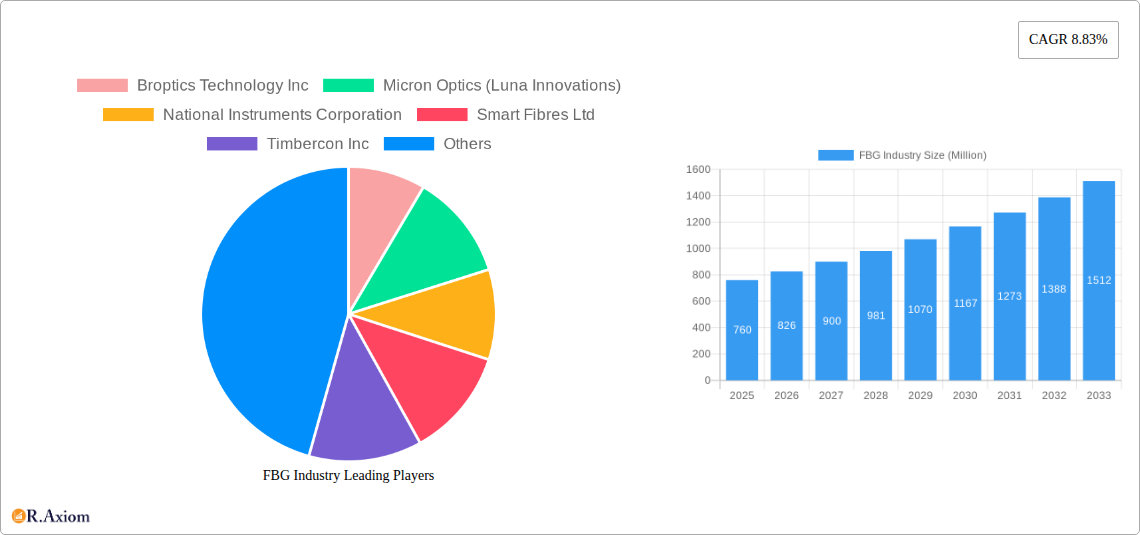
The Fiber Bragg Grating (FBG) sensor market, valued at $0.76 billion in 2025, is projected to experience robust growth, driven by increasing demand across diverse sectors. A compound annual growth rate (CAGR) of 8.83% from 2025 to 2033 indicates a significant expansion, reaching an estimated market size of approximately $1.7 billion by 2033. This growth is fueled by several key factors. The rising adoption of FBG sensors in telecommunications for network monitoring and management is a primary driver. Furthermore, the aerospace and construction industries are increasingly leveraging FBG sensors for structural health monitoring and improved safety measures. The energy and power sector's reliance on FBG sensors for pipeline monitoring and smart grid applications further contributes to market expansion. Technological advancements leading to higher sensitivity, improved durability, and miniaturization of FBG sensors are also key enablers of market growth. While the market faces challenges such as high initial investment costs and the need for specialized expertise in installation and maintenance, these are being mitigated by increasing technological advancements and the overall cost-effectiveness of FBG sensors in the long run compared to traditional sensing methods.
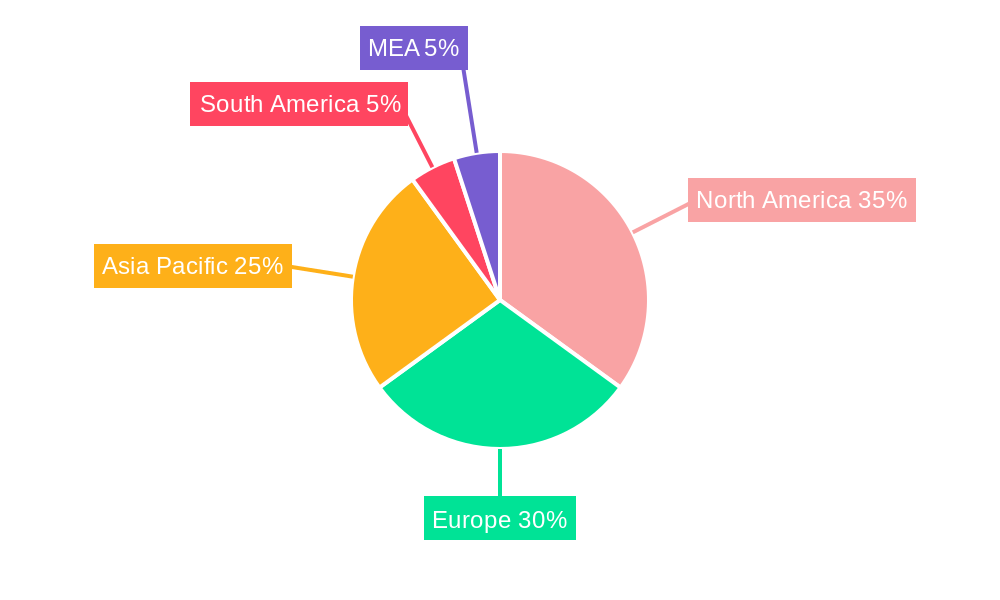
Market segmentation reveals a diverse landscape. Temperature sensors currently hold a significant share of the FBG market, owing to widespread applications in various industries. However, the segments for strain and pressure sensors are also witnessing rapid growth, indicating diversification and potential for future dominance. Geographically, North America and Europe are currently leading the market, driven by established technological infrastructure and early adoption. However, the Asia-Pacific region is expected to demonstrate significant growth in the coming years, fueled by substantial infrastructure development and increasing industrialization in countries like China and India. The competitive landscape is marked by a mix of established players and emerging innovative companies, fostering innovation and competition within the market. The continued development of advanced FBG sensor technologies and their integration into diverse applications promises sustained market growth throughout the forecast period.
FBG Industry Market Report: 2019-2033
This comprehensive report provides an in-depth analysis of the Fiber Bragg Grating (FBG) industry, offering invaluable insights for stakeholders seeking to understand market dynamics, technological advancements, and future growth opportunities. The study period covers 2019-2033, with 2025 as the base and estimated year. The report projects a market value exceeding xx Million by 2033, driven by strong growth across various segments and end-user industries. This report is crucial for strategic decision-making and investment planning within the FBG sensor market.
FBG Industry Market Concentration & Innovation
The FBG industry exhibits a moderately concentrated market structure, with several key players holding significant market share. While precise market share figures for each company require further proprietary data analysis, Micron Optics (Luna Innovations), National Instruments Corporation, and FBGS International NV are estimated to be among the leading companies, collectively accounting for approximately xx% of the global market in 2025. The remaining share is distributed across numerous smaller players, including Broptics Technology Inc, Smart Fibres Ltd, Timbercon Inc, ITF Technologies, HBM Inc (An HBK Company), Technica Optical Components LLC, and Advanced Optics Solutions (AOS) GmbH.
Innovation is a key driver in the FBG industry, with companies focusing on:
- Enhanced Sensor Performance: Improvements in sensitivity, accuracy, and operational temperature ranges are constantly being pursued.
- Miniaturization and Cost Reduction: Smaller, more cost-effective FBG sensors are driving wider adoption across various applications.
- Advanced Manufacturing Techniques: New manufacturing processes are enhancing the efficiency and scalability of FBG sensor production.
- Data Analytics and Integration: The integration of FBG sensor data with advanced analytics platforms enables more sophisticated monitoring and control systems.
Regulatory frameworks, particularly those related to safety and environmental standards in specific end-user industries (e.g., aerospace, energy), significantly influence market growth. While there aren't direct substitutes for FBG sensors in many applications, alternative sensing technologies, like fiber optic sensors using different principles, present competitive pressure. Mergers and acquisitions (M&A) activity has been relatively modest in recent years, with deal values typically below xx Million, primarily focused on enhancing technological capabilities or expanding market reach.
FBG Industry Industry Trends & Insights
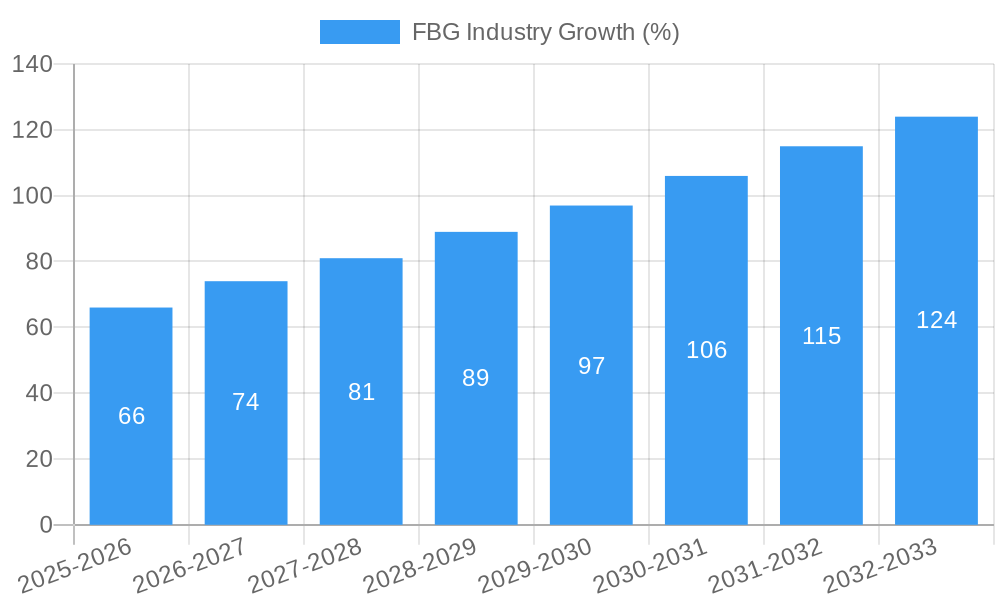
The FBG industry is experiencing robust growth, driven by a confluence of factors. The Compound Annual Growth Rate (CAGR) during the forecast period (2025-2033) is projected to be xx%, exceeding the historical CAGR (2019-2024) of xx%. Key growth drivers include:
- Increasing Demand in Infrastructure Monitoring: The need for structural health monitoring in buildings, bridges, and other infrastructure is fueling significant demand for FBG strain sensors.
- Expansion in the Energy and Power Sector: FBG sensors are increasingly deployed in power grids, pipelines, and renewable energy installations for monitoring and control purposes.
- Advancements in Telecommunications: The growth of high-speed networks and the need for reliable infrastructure is driving demand for FBG sensors in optical fiber applications.
- Technological Advancements: Continuous improvements in sensor technology, such as enhanced sensitivity and miniaturization, are broadening applications across various industries.
- Rising Adoption in Aerospace: The aerospace industry has demonstrated significant interest in FBG sensors, as evidenced by their inclusion in sophisticated aircraft landing gear.
Market penetration varies significantly across different end-user industries. While the telecommunication sector currently boasts high penetration, considerable untapped potential exists in emerging sectors like construction and infrastructure. This suggests strong growth opportunities for players who can successfully penetrate these segments. Competition in the industry is relatively intense, particularly among larger companies offering integrated sensor solutions. The market is characterized by a combination of established players and emerging companies focused on niche applications or technological advancements.
Dominant Markets & Segments in FBG Industry
Leading Regions/Countries: The North American and European markets currently represent the largest share of the FBG industry, due to established infrastructure, robust research and development activities, and significant adoption across various sectors. However, the Asia-Pacific region is projected to experience the fastest growth during the forecast period, driven by rapid industrialization and infrastructure development.
Dominant Segments:
- By Type: Strain sensors currently dominate the FBG market, driven by widespread applications in structural health monitoring and other infrastructure-related applications. However, temperature sensors are also experiencing strong growth due to increasing demand in various industrial and energy applications.
- By End-user Industry: The telecommunications sector is currently the leading end-user industry for FBG sensors, followed by the aerospace industry, and the Energy and Power sector which shows promising growth.
Key Drivers of Segment Dominance:
- Telecommunications: High investment in broadband infrastructure, demand for robust and reliable optical fiber networks.
- Aerospace: Stringent safety requirements, demand for reliable and lightweight sensor systems.
- Energy and Power: Growing need for monitoring and control of power grids, pipelines, and renewable energy assets.
- Construction and Infrastructure: Increasing focus on structural health monitoring and asset management.
Further expansion in these segments is anticipated, fueled by government policies, private sector initiatives, and advancements in FBG technology. The construction and infrastructure sectors, along with the energy sector, present the most promising opportunities for future growth.
FBG Industry Product Developments
Recent product innovations have focused on miniaturizing FBG sensors, improving their sensitivity and accuracy, and integrating them with advanced data processing and analytics platforms. Companies are also developing specialized FBG sensors for specific applications, like those designed for extreme temperature environments or harsh industrial settings. Key competitive advantages lie in sensor performance, cost-effectiveness, and the ability to provide integrated solutions that meet specific end-user needs. The integration of FBG sensors with the Internet of Things (IoT) is also transforming the industry, enabling real-time data monitoring and remote control capabilities.
Report Scope & Segmentation Analysis
This report segments the FBG market by type (Temperature Sensor, Strain Sensor, Pressure Sensor, Other Types) and by end-user industry (Telecommunication, Aerospace, Construction and Infrastructure, Energy and Power, Mining, Other End-user Industries). Each segment's growth projections are detailed in the full report, with market size estimates provided for both historical and forecast periods. The report also analyzes the competitive dynamics within each segment, identifying key players and their strategies. The market is highly fragmented, with many companies specializing in specific types or end-user applications.
Key Drivers of FBG Industry Growth
The FBG industry's growth is fueled by several key drivers:
- Technological advancements: Continuous improvements in sensor technology are broadening applications across diverse industries.
- Economic growth: Expansion in infrastructure development across various nations, notably in emerging economies.
- Government regulations: Stringent safety and environmental regulations in sectors like aerospace and energy driving demand for reliable monitoring systems.
- Increased focus on structural health monitoring: Growing awareness of the importance of infrastructure maintenance.
Challenges in the FBG Industry Sector
The FBG industry faces several challenges, including:
- High initial investment costs: The cost of implementing FBG sensor systems can be high for smaller companies.
- Supply chain disruptions: The complexity of FBG sensor manufacturing can lead to vulnerabilities in the supply chain.
- Intense competition: The market is characterized by numerous players, creating price pressure.
- Technological limitations: Some applications require specialized FBG sensors that are still under development.
Emerging Opportunities in FBG Industry
Emerging opportunities in the FBG industry include:
- Expansion into new markets: Untapped potential exists in emerging economies experiencing rapid infrastructure growth.
- Development of new applications: Exploration of novel applications in areas like healthcare and environmental monitoring.
- Integration with IoT and advanced analytics: Combining FBG sensors with data processing platforms to deliver advanced capabilities.
Leading Players in the FBG Industry Market
- Broptics Technology Inc
- Micron Optics (Luna Innovations)
- National Instruments Corporation
- Smart Fibres Ltd
- Timbercon Inc
- ITF Technologies
- HBM Inc (An HBK Company)
- FBGS International NV
- Technica Optical Components LLC
- Advanced Optics Solutions (AOS) GmbH
Key Developments in FBG Industry Industry
March 2022: The ANGELA Consortium's successful integration of FBG sensors into a flight-ready landing gear system for Airbus Helicopters highlights the growing adoption of FBG technology in the aerospace industry. This signifies a substantial technological leap and market validation.
October 2022: The French government's Energy Efficiency Plan aims for a 10% reduction in energy consumption by 2024. The projected annual reduction of 50 TWh underscores the importance of energy-efficient technologies, creating significant demand for FBG sensors in monitoring and optimizing energy systems. This policy initiative boosts the market significantly.
Strategic Outlook for FBG Industry Market
The FBG industry is poised for sustained growth, driven by technological advancements, increasing demand across diverse end-user industries, and supportive government policies. Future opportunities lie in the expansion into new markets, particularly in emerging economies, along with the development of innovative applications and the integration of FBG sensors with advanced data analytics platforms. The market's future success hinges on continuous innovation, strategic partnerships, and an ability to meet the evolving needs of various industries.
FBG Industry Segmentation
-
1. Type
- 1.1. Temperature Sensor
- 1.2. Strain Sensor
- 1.3. Pressure Sensor
- 1.4. Other Types
-
2. End-user Industry
- 2.1. Telecommunication
- 2.2. Aerospace
- 2.3. Construction and Infrastructure
- 2.4. Energy and Power
- 2.5. Mining
- 2.6. Other End-user Industries
FBG Industry Segmentation By Geography
- 1. North America
- 2. Europe
- 3. Asia Pacific
- 4. Rest of the World
FBG Industry REPORT HIGHLIGHTS
| Aspects | Details |
|---|---|
| Study Period | 2019-2033 |
| Base Year | 2024 |
| Estimated Year | 2025 |
| Forecast Period | 2025-2033 |
| Historical Period | 2019-2024 |
| Growth Rate | CAGR of 8.83% from 2019-2033 |
| Segmentation |
|
Table of Contents
- 1. Introduction
- 1.1. Research Scope
- 1.2. Market Segmentation
- 1.3. Research Methodology
- 1.4. Definitions and Assumptions
- 2. Executive Summary
- 2.1. Introduction
- 3. Market Dynamics
- 3.1. Introduction
- 3.2. Market Drivers
- 3.2.1. Increasing Usage in the Aircraft; Built-in Calibration Artifacts and Longer Lifetime
- 3.3. Market Restrains
- 3.3.1. Thermal and Transverse Strain Sensitivity
- 3.4. Market Trends
- 3.4.1. Aerospace to be Among the Fastest Growing End User for FBG Sensors
- 4. Market Factor Analysis
- 4.1. Porters Five Forces
- 4.2. Supply/Value Chain
- 4.3. PESTEL analysis
- 4.4. Market Entropy
- 4.5. Patent/Trademark Analysis
- 5. Global FBG Industry Analysis, Insights and Forecast, 2019-2031
- 5.1. Market Analysis, Insights and Forecast - by Type
- 5.1.1. Temperature Sensor
- 5.1.2. Strain Sensor
- 5.1.3. Pressure Sensor
- 5.1.4. Other Types
- 5.2. Market Analysis, Insights and Forecast - by End-user Industry
- 5.2.1. Telecommunication
- 5.2.2. Aerospace
- 5.2.3. Construction and Infrastructure
- 5.2.4. Energy and Power
- 5.2.5. Mining
- 5.2.6. Other End-user Industries
- 5.3. Market Analysis, Insights and Forecast - by Region
- 5.3.1. North America
- 5.3.2. Europe
- 5.3.3. Asia Pacific
- 5.3.4. Rest of the World
- 5.1. Market Analysis, Insights and Forecast - by Type
- 6. North America FBG Industry Analysis, Insights and Forecast, 2019-2031
- 6.1. Market Analysis, Insights and Forecast - by Type
- 6.1.1. Temperature Sensor
- 6.1.2. Strain Sensor
- 6.1.3. Pressure Sensor
- 6.1.4. Other Types
- 6.2. Market Analysis, Insights and Forecast - by End-user Industry
- 6.2.1. Telecommunication
- 6.2.2. Aerospace
- 6.2.3. Construction and Infrastructure
- 6.2.4. Energy and Power
- 6.2.5. Mining
- 6.2.6. Other End-user Industries
- 6.1. Market Analysis, Insights and Forecast - by Type
- 7. Europe FBG Industry Analysis, Insights and Forecast, 2019-2031
- 7.1. Market Analysis, Insights and Forecast - by Type
- 7.1.1. Temperature Sensor
- 7.1.2. Strain Sensor
- 7.1.3. Pressure Sensor
- 7.1.4. Other Types
- 7.2. Market Analysis, Insights and Forecast - by End-user Industry
- 7.2.1. Telecommunication
- 7.2.2. Aerospace
- 7.2.3. Construction and Infrastructure
- 7.2.4. Energy and Power
- 7.2.5. Mining
- 7.2.6. Other End-user Industries
- 7.1. Market Analysis, Insights and Forecast - by Type
- 8. Asia Pacific FBG Industry Analysis, Insights and Forecast, 2019-2031
- 8.1. Market Analysis, Insights and Forecast - by Type
- 8.1.1. Temperature Sensor
- 8.1.2. Strain Sensor
- 8.1.3. Pressure Sensor
- 8.1.4. Other Types
- 8.2. Market Analysis, Insights and Forecast - by End-user Industry
- 8.2.1. Telecommunication
- 8.2.2. Aerospace
- 8.2.3. Construction and Infrastructure
- 8.2.4. Energy and Power
- 8.2.5. Mining
- 8.2.6. Other End-user Industries
- 8.1. Market Analysis, Insights and Forecast - by Type
- 9. Rest of the World FBG Industry Analysis, Insights and Forecast, 2019-2031
- 9.1. Market Analysis, Insights and Forecast - by Type
- 9.1.1. Temperature Sensor
- 9.1.2. Strain Sensor
- 9.1.3. Pressure Sensor
- 9.1.4. Other Types
- 9.2. Market Analysis, Insights and Forecast - by End-user Industry
- 9.2.1. Telecommunication
- 9.2.2. Aerospace
- 9.2.3. Construction and Infrastructure
- 9.2.4. Energy and Power
- 9.2.5. Mining
- 9.2.6. Other End-user Industries
- 9.1. Market Analysis, Insights and Forecast - by Type
- 10. North America FBG Industry Analysis, Insights and Forecast, 2019-2031
- 10.1. Market Analysis, Insights and Forecast - By Country/Sub-region
- 10.1.1 United States
- 10.1.2 Canada
- 10.1.3 Mexico
- 11. Europe FBG Industry Analysis, Insights and Forecast, 2019-2031
- 11.1. Market Analysis, Insights and Forecast - By Country/Sub-region
- 11.1.1 Germany
- 11.1.2 United Kingdom
- 11.1.3 France
- 11.1.4 Spain
- 11.1.5 Italy
- 11.1.6 Spain
- 11.1.7 Belgium
- 11.1.8 Netherland
- 11.1.9 Nordics
- 11.1.10 Rest of Europe
- 12. Asia Pacific FBG Industry Analysis, Insights and Forecast, 2019-2031
- 12.1. Market Analysis, Insights and Forecast - By Country/Sub-region
- 12.1.1 China
- 12.1.2 Japan
- 12.1.3 India
- 12.1.4 South Korea
- 12.1.5 Southeast Asia
- 12.1.6 Australia
- 12.1.7 Indonesia
- 12.1.8 Phillipes
- 12.1.9 Singapore
- 12.1.10 Thailandc
- 12.1.11 Rest of Asia Pacific
- 13. South America FBG Industry Analysis, Insights and Forecast, 2019-2031
- 13.1. Market Analysis, Insights and Forecast - By Country/Sub-region
- 13.1.1 Brazil
- 13.1.2 Argentina
- 13.1.3 Peru
- 13.1.4 Chile
- 13.1.5 Colombia
- 13.1.6 Ecuador
- 13.1.7 Venezuela
- 13.1.8 Rest of South America
- 14. North America FBG Industry Analysis, Insights and Forecast, 2019-2031
- 14.1. Market Analysis, Insights and Forecast - By Country/Sub-region
- 14.1.1 United States
- 14.1.2 Canada
- 14.1.3 Mexico
- 15. MEA FBG Industry Analysis, Insights and Forecast, 2019-2031
- 15.1. Market Analysis, Insights and Forecast - By Country/Sub-region
- 15.1.1 United Arab Emirates
- 15.1.2 Saudi Arabia
- 15.1.3 South Africa
- 15.1.4 Rest of Middle East and Africa
- 16. Competitive Analysis
- 16.1. Global Market Share Analysis 2024
- 16.2. Company Profiles
- 16.2.1 Broptics Technology Inc
- 16.2.1.1. Overview
- 16.2.1.2. Products
- 16.2.1.3. SWOT Analysis
- 16.2.1.4. Recent Developments
- 16.2.1.5. Financials (Based on Availability)
- 16.2.2 Micron Optics (Luna Innovations)
- 16.2.2.1. Overview
- 16.2.2.2. Products
- 16.2.2.3. SWOT Analysis
- 16.2.2.4. Recent Developments
- 16.2.2.5. Financials (Based on Availability)
- 16.2.3 National Instruments Corporation
- 16.2.3.1. Overview
- 16.2.3.2. Products
- 16.2.3.3. SWOT Analysis
- 16.2.3.4. Recent Developments
- 16.2.3.5. Financials (Based on Availability)
- 16.2.4 Smart Fibres Ltd
- 16.2.4.1. Overview
- 16.2.4.2. Products
- 16.2.4.3. SWOT Analysis
- 16.2.4.4. Recent Developments
- 16.2.4.5. Financials (Based on Availability)
- 16.2.5 Timbercon Inc
- 16.2.5.1. Overview
- 16.2.5.2. Products
- 16.2.5.3. SWOT Analysis
- 16.2.5.4. Recent Developments
- 16.2.5.5. Financials (Based on Availability)
- 16.2.6 ITF Technologies
- 16.2.6.1. Overview
- 16.2.6.2. Products
- 16.2.6.3. SWOT Analysis
- 16.2.6.4. Recent Developments
- 16.2.6.5. Financials (Based on Availability)
- 16.2.7 HBM Inc (An HBK Company)
- 16.2.7.1. Overview
- 16.2.7.2. Products
- 16.2.7.3. SWOT Analysis
- 16.2.7.4. Recent Developments
- 16.2.7.5. Financials (Based on Availability)
- 16.2.8 FBGS International NV
- 16.2.8.1. Overview
- 16.2.8.2. Products
- 16.2.8.3. SWOT Analysis
- 16.2.8.4. Recent Developments
- 16.2.8.5. Financials (Based on Availability)
- 16.2.9 Technica Optical Components LLC
- 16.2.9.1. Overview
- 16.2.9.2. Products
- 16.2.9.3. SWOT Analysis
- 16.2.9.4. Recent Developments
- 16.2.9.5. Financials (Based on Availability)
- 16.2.10 Advanced Optics Solutions (AOS) GmbH
- 16.2.10.1. Overview
- 16.2.10.2. Products
- 16.2.10.3. SWOT Analysis
- 16.2.10.4. Recent Developments
- 16.2.10.5. Financials (Based on Availability)
- 16.2.1 Broptics Technology Inc
List of Figures
- Figure 1: Global FBG Industry Revenue Breakdown (Million, %) by Region 2024 & 2032
- Figure 2: North America FBG Industry Revenue (Million), by Country 2024 & 2032
- Figure 3: North America FBG Industry Revenue Share (%), by Country 2024 & 2032
- Figure 4: Europe FBG Industry Revenue (Million), by Country 2024 & 2032
- Figure 5: Europe FBG Industry Revenue Share (%), by Country 2024 & 2032
- Figure 6: Asia Pacific FBG Industry Revenue (Million), by Country 2024 & 2032
- Figure 7: Asia Pacific FBG Industry Revenue Share (%), by Country 2024 & 2032
- Figure 8: South America FBG Industry Revenue (Million), by Country 2024 & 2032
- Figure 9: South America FBG Industry Revenue Share (%), by Country 2024 & 2032
- Figure 10: North America FBG Industry Revenue (Million), by Country 2024 & 2032
- Figure 11: North America FBG Industry Revenue Share (%), by Country 2024 & 2032
- Figure 12: MEA FBG Industry Revenue (Million), by Country 2024 & 2032
- Figure 13: MEA FBG Industry Revenue Share (%), by Country 2024 & 2032
- Figure 14: North America FBG Industry Revenue (Million), by Type 2024 & 2032
- Figure 15: North America FBG Industry Revenue Share (%), by Type 2024 & 2032
- Figure 16: North America FBG Industry Revenue (Million), by End-user Industry 2024 & 2032
- Figure 17: North America FBG Industry Revenue Share (%), by End-user Industry 2024 & 2032
- Figure 18: North America FBG Industry Revenue (Million), by Country 2024 & 2032
- Figure 19: North America FBG Industry Revenue Share (%), by Country 2024 & 2032
- Figure 20: Europe FBG Industry Revenue (Million), by Type 2024 & 2032
- Figure 21: Europe FBG Industry Revenue Share (%), by Type 2024 & 2032
- Figure 22: Europe FBG Industry Revenue (Million), by End-user Industry 2024 & 2032
- Figure 23: Europe FBG Industry Revenue Share (%), by End-user Industry 2024 & 2032
- Figure 24: Europe FBG Industry Revenue (Million), by Country 2024 & 2032
- Figure 25: Europe FBG Industry Revenue Share (%), by Country 2024 & 2032
- Figure 26: Asia Pacific FBG Industry Revenue (Million), by Type 2024 & 2032
- Figure 27: Asia Pacific FBG Industry Revenue Share (%), by Type 2024 & 2032
- Figure 28: Asia Pacific FBG Industry Revenue (Million), by End-user Industry 2024 & 2032
- Figure 29: Asia Pacific FBG Industry Revenue Share (%), by End-user Industry 2024 & 2032
- Figure 30: Asia Pacific FBG Industry Revenue (Million), by Country 2024 & 2032
- Figure 31: Asia Pacific FBG Industry Revenue Share (%), by Country 2024 & 2032
- Figure 32: Rest of the World FBG Industry Revenue (Million), by Type 2024 & 2032
- Figure 33: Rest of the World FBG Industry Revenue Share (%), by Type 2024 & 2032
- Figure 34: Rest of the World FBG Industry Revenue (Million), by End-user Industry 2024 & 2032
- Figure 35: Rest of the World FBG Industry Revenue Share (%), by End-user Industry 2024 & 2032
- Figure 36: Rest of the World FBG Industry Revenue (Million), by Country 2024 & 2032
- Figure 37: Rest of the World FBG Industry Revenue Share (%), by Country 2024 & 2032
List of Tables
- Table 1: Global FBG Industry Revenue Million Forecast, by Region 2019 & 2032
- Table 2: Global FBG Industry Revenue Million Forecast, by Type 2019 & 2032
- Table 3: Global FBG Industry Revenue Million Forecast, by End-user Industry 2019 & 2032
- Table 4: Global FBG Industry Revenue Million Forecast, by Region 2019 & 2032
- Table 5: Global FBG Industry Revenue Million Forecast, by Country 2019 & 2032
- Table 6: United States FBG Industry Revenue (Million) Forecast, by Application 2019 & 2032
- Table 7: Canada FBG Industry Revenue (Million) Forecast, by Application 2019 & 2032
- Table 8: Mexico FBG Industry Revenue (Million) Forecast, by Application 2019 & 2032
- Table 9: Global FBG Industry Revenue Million Forecast, by Country 2019 & 2032
- Table 10: Germany FBG Industry Revenue (Million) Forecast, by Application 2019 & 2032
- Table 11: United Kingdom FBG Industry Revenue (Million) Forecast, by Application 2019 & 2032
- Table 12: France FBG Industry Revenue (Million) Forecast, by Application 2019 & 2032
- Table 13: Spain FBG Industry Revenue (Million) Forecast, by Application 2019 & 2032
- Table 14: Italy FBG Industry Revenue (Million) Forecast, by Application 2019 & 2032
- Table 15: Spain FBG Industry Revenue (Million) Forecast, by Application 2019 & 2032
- Table 16: Belgium FBG Industry Revenue (Million) Forecast, by Application 2019 & 2032
- Table 17: Netherland FBG Industry Revenue (Million) Forecast, by Application 2019 & 2032
- Table 18: Nordics FBG Industry Revenue (Million) Forecast, by Application 2019 & 2032
- Table 19: Rest of Europe FBG Industry Revenue (Million) Forecast, by Application 2019 & 2032
- Table 20: Global FBG Industry Revenue Million Forecast, by Country 2019 & 2032
- Table 21: China FBG Industry Revenue (Million) Forecast, by Application 2019 & 2032
- Table 22: Japan FBG Industry Revenue (Million) Forecast, by Application 2019 & 2032
- Table 23: India FBG Industry Revenue (Million) Forecast, by Application 2019 & 2032
- Table 24: South Korea FBG Industry Revenue (Million) Forecast, by Application 2019 & 2032
- Table 25: Southeast Asia FBG Industry Revenue (Million) Forecast, by Application 2019 & 2032
- Table 26: Australia FBG Industry Revenue (Million) Forecast, by Application 2019 & 2032
- Table 27: Indonesia FBG Industry Revenue (Million) Forecast, by Application 2019 & 2032
- Table 28: Phillipes FBG Industry Revenue (Million) Forecast, by Application 2019 & 2032
- Table 29: Singapore FBG Industry Revenue (Million) Forecast, by Application 2019 & 2032
- Table 30: Thailandc FBG Industry Revenue (Million) Forecast, by Application 2019 & 2032
- Table 31: Rest of Asia Pacific FBG Industry Revenue (Million) Forecast, by Application 2019 & 2032
- Table 32: Global FBG Industry Revenue Million Forecast, by Country 2019 & 2032
- Table 33: Brazil FBG Industry Revenue (Million) Forecast, by Application 2019 & 2032
- Table 34: Argentina FBG Industry Revenue (Million) Forecast, by Application 2019 & 2032
- Table 35: Peru FBG Industry Revenue (Million) Forecast, by Application 2019 & 2032
- Table 36: Chile FBG Industry Revenue (Million) Forecast, by Application 2019 & 2032
- Table 37: Colombia FBG Industry Revenue (Million) Forecast, by Application 2019 & 2032
- Table 38: Ecuador FBG Industry Revenue (Million) Forecast, by Application 2019 & 2032
- Table 39: Venezuela FBG Industry Revenue (Million) Forecast, by Application 2019 & 2032
- Table 40: Rest of South America FBG Industry Revenue (Million) Forecast, by Application 2019 & 2032
- Table 41: Global FBG Industry Revenue Million Forecast, by Country 2019 & 2032
- Table 42: United States FBG Industry Revenue (Million) Forecast, by Application 2019 & 2032
- Table 43: Canada FBG Industry Revenue (Million) Forecast, by Application 2019 & 2032
- Table 44: Mexico FBG Industry Revenue (Million) Forecast, by Application 2019 & 2032
- Table 45: Global FBG Industry Revenue Million Forecast, by Country 2019 & 2032
- Table 46: United Arab Emirates FBG Industry Revenue (Million) Forecast, by Application 2019 & 2032
- Table 47: Saudi Arabia FBG Industry Revenue (Million) Forecast, by Application 2019 & 2032
- Table 48: South Africa FBG Industry Revenue (Million) Forecast, by Application 2019 & 2032
- Table 49: Rest of Middle East and Africa FBG Industry Revenue (Million) Forecast, by Application 2019 & 2032
- Table 50: Global FBG Industry Revenue Million Forecast, by Type 2019 & 2032
- Table 51: Global FBG Industry Revenue Million Forecast, by End-user Industry 2019 & 2032
- Table 52: Global FBG Industry Revenue Million Forecast, by Country 2019 & 2032
- Table 53: Global FBG Industry Revenue Million Forecast, by Type 2019 & 2032
- Table 54: Global FBG Industry Revenue Million Forecast, by End-user Industry 2019 & 2032
- Table 55: Global FBG Industry Revenue Million Forecast, by Country 2019 & 2032
- Table 56: Global FBG Industry Revenue Million Forecast, by Type 2019 & 2032
- Table 57: Global FBG Industry Revenue Million Forecast, by End-user Industry 2019 & 2032
- Table 58: Global FBG Industry Revenue Million Forecast, by Country 2019 & 2032
- Table 59: Global FBG Industry Revenue Million Forecast, by Type 2019 & 2032
- Table 60: Global FBG Industry Revenue Million Forecast, by End-user Industry 2019 & 2032
- Table 61: Global FBG Industry Revenue Million Forecast, by Country 2019 & 2032
Frequently Asked Questions
1. What is the projected Compound Annual Growth Rate (CAGR) of the FBG Industry?
The projected CAGR is approximately 8.83%.
2. Which companies are prominent players in the FBG Industry?
Key companies in the market include Broptics Technology Inc, Micron Optics (Luna Innovations), National Instruments Corporation, Smart Fibres Ltd, Timbercon Inc, ITF Technologies, HBM Inc (An HBK Company), FBGS International NV, Technica Optical Components LLC, Advanced Optics Solutions (AOS) GmbH.
3. What are the main segments of the FBG Industry?
The market segments include Type, End-user Industry.
4. Can you provide details about the market size?
The market size is estimated to be USD 0.76 Million as of 2022.
5. What are some drivers contributing to market growth?
Increasing Usage in the Aircraft; Built-in Calibration Artifacts and Longer Lifetime.
6. What are the notable trends driving market growth?
Aerospace to be Among the Fastest Growing End User for FBG Sensors.
7. Are there any restraints impacting market growth?
Thermal and Transverse Strain Sensitivity.
8. Can you provide examples of recent developments in the market?
October 2022: The French government unveiled its ambitious Energy Efficiency Plan, with the objective of achieving a 10% reduction in energy consumption by 2024. The government's comprehensive set of measures is expected to result in a substantial reduction of approximately 50 terawatt hours (TWh) annually. This initiative marks a crucial initial stride toward achieving carbon neutrality by 2050, necessitating a 40% decrease in energy consumption. As a result, the demand for Fiber Bragg Grating (FBG) sensors is set to rise, bolstering growth in the sensor market.
9. What pricing options are available for accessing the report?
Pricing options include single-user, multi-user, and enterprise licenses priced at USD 4750, USD 5250, and USD 8750 respectively.
10. Is the market size provided in terms of value or volume?
The market size is provided in terms of value, measured in Million.
11. Are there any specific market keywords associated with the report?
Yes, the market keyword associated with the report is "FBG Industry," which aids in identifying and referencing the specific market segment covered.
12. How do I determine which pricing option suits my needs best?
The pricing options vary based on user requirements and access needs. Individual users may opt for single-user licenses, while businesses requiring broader access may choose multi-user or enterprise licenses for cost-effective access to the report.
13. Are there any additional resources or data provided in the FBG Industry report?
While the report offers comprehensive insights, it's advisable to review the specific contents or supplementary materials provided to ascertain if additional resources or data are available.
14. How can I stay updated on further developments or reports in the FBG Industry?
To stay informed about further developments, trends, and reports in the FBG Industry, consider subscribing to industry newsletters, following relevant companies and organizations, or regularly checking reputable industry news sources and publications.
Methodology
Step 1 - Identification of Relevant Samples Size from Population Database


Step 2 - Approaches for Defining Global Market Size (Value, Volume* & Price*)

Note*: In applicable scenarios
Step 3 - Data Sources
Primary Research
- Web Analytics
- Survey Reports
- Research Institute
- Latest Research Reports
- Opinion Leaders
Secondary Research
- Annual Reports
- White Paper
- Latest Press Release
- Industry Association
- Paid Database
- Investor Presentations

Step 4 - Data Triangulation
Involves using different sources of information in order to increase the validity of a study
These sources are likely to be stakeholders in a program - participants, other researchers, program staff, other community members, and so on.
Then we put all data in single framework & apply various statistical tools to find out the dynamic on the market.
During the analysis stage, feedback from the stakeholder groups would be compared to determine areas of agreement as well as areas of divergence


