
Key Insights
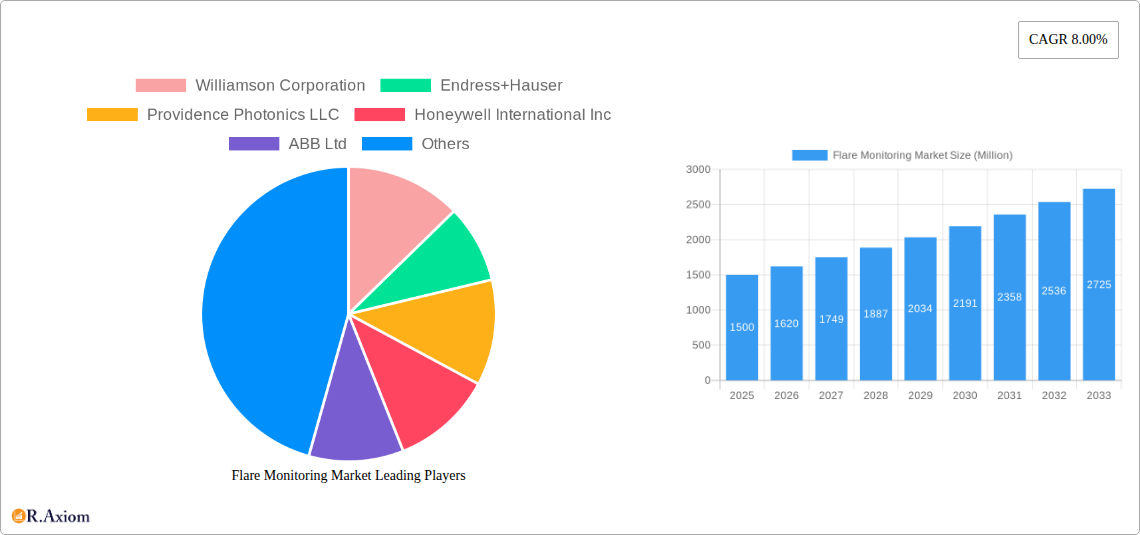
The global flare monitoring market is experiencing robust growth, driven by stringent environmental regulations aimed at reducing greenhouse gas emissions and minimizing the environmental impact of industrial operations. The increasing demand for enhanced safety and operational efficiency in refineries, petrochemical plants, and oil & gas facilities is further fueling market expansion. A compound annual growth rate (CAGR) of 8.00% from 2019 to 2033 suggests a significant market expansion over this period. Technological advancements in flare monitoring systems, such as the adoption of advanced sensors and data analytics, are contributing to improved accuracy, reliability, and remote monitoring capabilities. This enables proactive maintenance, optimized flare system performance, and reduced operational downtime. The market is segmented by end-user (refinery, landfill, petrochemical, oil & gas, other), mounting method (in-process, remote), and gas chromatograph type, offering diverse solutions tailored to specific industrial needs. Key players, including Williamson Corporation, Endress+Hauser, and Honeywell International Inc., are actively investing in research and development to enhance product offerings and expand their market share.
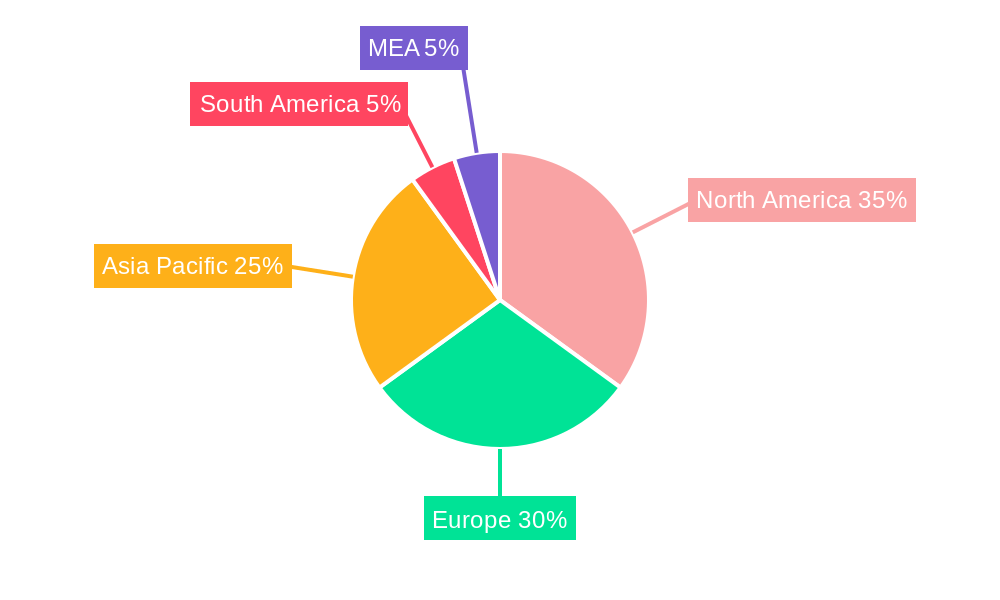
The North American and European regions currently hold significant market share due to established industrial infrastructure and stricter environmental regulations. However, the Asia-Pacific region is poised for rapid growth, driven by increasing industrialization and investments in oil & gas infrastructure. Market restraints include the high initial investment costs associated with implementing advanced flare monitoring systems and the need for skilled personnel to operate and maintain these systems. However, the long-term benefits of reduced environmental penalties, improved safety, and enhanced operational efficiency are likely to outweigh these initial costs, driving sustained market growth. The forecast period of 2025-2033 is expected to witness considerable expansion, propelled by ongoing technological advancements and rising environmental concerns across various industries. The competitive landscape is characterized by both established industry players and emerging technology providers, fostering innovation and driving down costs.
Flare Monitoring Market: A Comprehensive Report (2019-2033)
This in-depth report provides a comprehensive analysis of the global Flare Monitoring Market, covering the period from 2019 to 2033. It offers valuable insights into market dynamics, competitive landscape, and future growth prospects, equipping stakeholders with actionable intelligence for strategic decision-making. The report leverages extensive primary and secondary research to provide accurate and reliable data, including market sizing, segmentation, and growth forecasts. The Base Year for this report is 2025, with the Estimated Year also being 2025, and the Forecast Period spanning from 2025 to 2033. The Historical Period covered is 2019-2024.
Flare Monitoring Market Concentration & Innovation
The Flare Monitoring Market exhibits a moderately concentrated landscape, with a few dominant players holding significant market share. Williamson Corporation, Endress+Hauser, and Honeywell International Inc. are amongst the key players, collectively accounting for an estimated xx% of the market in 2025. However, the market also features several smaller, specialized companies contributing to innovation and competition.
- Market Concentration: The Herfindahl-Hirschman Index (HHI) is estimated at xx in 2025, indicating a moderately concentrated market.
- Innovation Drivers: Stringent environmental regulations driving the adoption of advanced monitoring technologies, the need for improved safety and operational efficiency in oil & gas and petrochemical industries, and advancements in sensor technology are major innovation drivers.
- Regulatory Frameworks: The increasing stringency of emission regulations globally is a key factor shaping market growth. Compliance needs are fueling the demand for sophisticated flare monitoring solutions.
- Product Substitutes: While there are no direct substitutes for flare monitoring systems, companies are increasingly incorporating data analytics and remote monitoring capabilities to enhance the value proposition of their offerings.
- End-User Trends: The growing adoption of digitalization and Industry 4.0 principles in the oil & gas and petrochemical sectors is driving demand for connected and data-driven flare monitoring systems.
- M&A Activities: The market has witnessed xx M&A deals in the past five years, with an aggregate deal value of approximately $xx Million. These activities reflect the ongoing consolidation and strategic expansion efforts within the industry.
Flare Monitoring Market Industry Trends & Insights
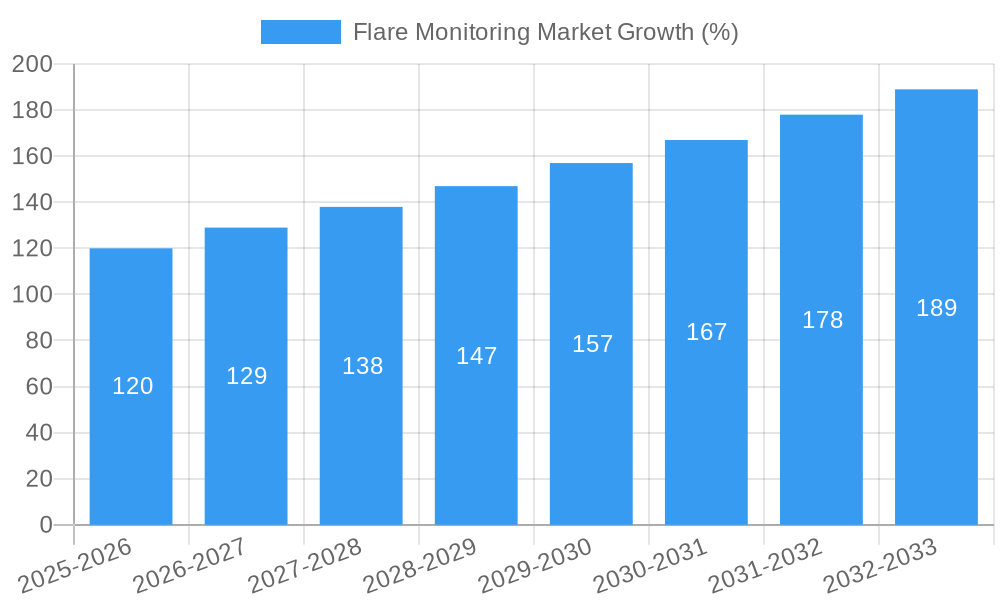
The global Flare Monitoring Market is projected to witness significant growth, with a Compound Annual Growth Rate (CAGR) of xx% during the forecast period (2025-2033). This growth is primarily attributed to the increasing demand for enhanced environmental compliance, stricter regulations on greenhouse gas emissions, and the rising need for efficient process optimization in various end-user industries. Technological advancements, particularly in sensor technology and data analytics, are further driving market expansion. The market penetration of advanced flare monitoring systems is steadily increasing, with a projected xx% penetration rate by 2033, particularly in developed regions. The competitive landscape is characterized by both established players and emerging companies, leading to intense innovation and product differentiation. Consumer preferences are shifting towards integrated solutions that offer real-time monitoring, predictive maintenance, and data-driven insights.
Dominant Markets & Segments in Flare Monitoring Market
The Oil & Gas sector represents the largest segment within the Flare Monitoring Market, accounting for approximately xx% of the total market revenue in 2025. This dominance is driven by stringent environmental regulations and the inherent safety risks associated with flaring operations in the oil and gas industry. Geographically, North America and Europe are the leading regions, owing to their established oil & gas infrastructure and stringent environmental regulations.
- Dominant End-User Segment: Oil & Gas
- Key Drivers: Stringent environmental regulations, safety concerns, operational efficiency requirements.
- Dominant Mounting Method: In-process mounting, due to its seamless integration with existing flare systems and improved accuracy.
- Dominant Geographic Region: North America
- Key Drivers: Stringent emission standards, robust oil & gas infrastructure, high investment in technological upgrades.
- Dominant Gas Chromatograph Mounting Method: Remote Mounting, driven by safety considerations and ease of maintenance.
Flare Monitoring Market Product Developments
Recent product innovations focus on improving accuracy, reliability, and data analytics capabilities. New systems incorporate advanced sensors, cloud-based data platforms, and AI-powered predictive analytics to enhance efficiency and compliance. The integration of these features provides end-users with real-time monitoring, data-driven insights, and improved decision-making capabilities, resulting in better environmental compliance and cost optimization. Manufacturers are also focusing on developing compact, robust, and easy-to-install systems to cater to diverse applications and customer needs.
Report Scope & Segmentation Analysis
This report segments the Flare Monitoring Market based on end-user (Refinery, Landfill, Petrochemical, Oil & Gas, Other End Users), mounting method (In-process mounting, Gas Chromatograph: Remote Mounting). Each segment is analyzed in terms of market size, growth projections, and competitive dynamics. For instance, the Oil & Gas segment is projected to maintain its dominant position throughout the forecast period, driven by stringent environmental regulations. The In-process mounting method is expected to experience significant growth due to its advantages in terms of accuracy and integration. The competitive landscape varies across segments, with some segments exhibiting higher concentration than others.
Key Drivers of Flare Monitoring Market Growth
Several factors are driving the growth of the Flare Monitoring Market. Stringent environmental regulations aimed at reducing greenhouse gas emissions are a primary driver, necessitating advanced monitoring solutions. The increasing focus on operational efficiency and safety in the oil and gas industry is another key factor. Technological advancements, particularly in sensor technology and data analytics, are enabling the development of more accurate, reliable, and cost-effective monitoring systems. Finally, growing awareness of environmental sustainability is further fueling market demand.
Challenges in the Flare Monitoring Market Sector
The Flare Monitoring Market faces several challenges. High initial investment costs for advanced systems can be a barrier to entry for smaller companies. The complexity of integrating new monitoring systems into existing infrastructure can also pose challenges. Furthermore, the need for skilled personnel to operate and maintain these systems presents an ongoing hurdle. Finally, intense competition among established players and emerging companies is creating a dynamic and challenging market environment.
Emerging Opportunities in Flare Monitoring Market
The Flare Monitoring Market presents several emerging opportunities. The rising demand for integrated solutions incorporating data analytics and predictive maintenance capabilities offers significant potential. The increasing adoption of digitalization and Industry 4.0 technologies is creating opportunities for connected and data-driven monitoring systems. Finally, expanding into new and emerging markets, particularly in developing economies with growing oil & gas industries, presents substantial growth opportunities.
Leading Players in the Flare Monitoring Market
- Williamson Corporation
- Endress+Hauser
- Providence Photonics LLC
- Honeywell International Inc
- ABB Ltd
- Zeeco Inc
- John Zink Company LLC
- Emerson Electric Co
- Siemens AG
- Lumasense Technologies Inc
- Ametek Inc
- Oleumtech Corporation
- MKS Instruments Inc
- Fluenta
- Thermo Fisher Scientific
- Eaton Hernis Scan Systems
- FLIR Systems
Key Developments in Flare Monitoring Market Industry
- Q2 2023: Honeywell International Inc. launched a new line of advanced flare monitoring systems with enhanced data analytics capabilities.
- Q4 2022: Emerson Electric Co. and Zeeco Inc. announced a strategic partnership to develop integrated flare monitoring and control solutions.
- Q1 2022: ABB Ltd acquired a smaller flare monitoring technology company, expanding its product portfolio.
Strategic Outlook for Flare Monitoring Market
The Flare Monitoring Market is poised for continued growth, driven by tightening environmental regulations and the ongoing need for improved operational efficiency and safety. The integration of advanced technologies, such as artificial intelligence and machine learning, will further enhance the capabilities of flare monitoring systems, leading to improved accuracy, reliability, and predictive maintenance. This, coupled with the expansion into new markets and the development of innovative solutions, presents significant growth potential for market participants.
Flare Monitoring Market Segmentation
-
1. Mounting Method
-
1.1. In-process mounting
- 1.1.1. Gas Analyzer
- 1.1.2. Calorimeter
- 1.1.3. Mass Spectrometer
- 1.1.4. Gas Chromatograph
-
1.2. Remote Mounting
- 1.2.1. Multi Spectrum Infrared (MSIR)
- 1.2.2. Thermal Imager (IR)
- 1.2.3. Others
-
1.1. In-process mounting
-
2. End-User
- 2.1. Refinery
- 2.2. Landfill
- 2.3. Petrochemical
- 2.4. Oil & Gas
- 2.5. Other End Users
Flare Monitoring Market Segmentation By Geography
- 1. North America
- 2. Europe
- 3. Asia Pacific
- 4. Rest of the World
Flare Monitoring Market REPORT HIGHLIGHTS
| Aspects | Details |
|---|---|
| Study Period | 2019-2033 |
| Base Year | 2024 |
| Estimated Year | 2025 |
| Forecast Period | 2025-2033 |
| Historical Period | 2019-2024 |
| Growth Rate | CAGR of 8.00% from 2019-2033 |
| Segmentation |
|
Table of Contents
- 1. Introduction
- 1.1. Research Scope
- 1.2. Market Segmentation
- 1.3. Research Methodology
- 1.4. Definitions and Assumptions
- 2. Executive Summary
- 2.1. Introduction
- 3. Market Dynamics
- 3.1. Introduction
- 3.2. Market Drivers
- 3.2.1 ; Stringent Government Environmental Regulations Related to Industrial Gas Emission; Expansion of Oil
- 3.2.2 Gas
- 3.2.3 and Petrochemicals Industries
- 3.3. Market Restrains
- 3.3.1. ; Initiative of Zero Routine Flaring by 2030
- 3.4. Market Trends
- 3.4.1. Oil & Gas Industry to Account for Maximum Share
- 4. Market Factor Analysis
- 4.1. Porters Five Forces
- 4.2. Supply/Value Chain
- 4.3. PESTEL analysis
- 4.4. Market Entropy
- 4.5. Patent/Trademark Analysis
- 5. Global Flare Monitoring Market Analysis, Insights and Forecast, 2019-2031
- 5.1. Market Analysis, Insights and Forecast - by Mounting Method
- 5.1.1. In-process mounting
- 5.1.1.1. Gas Analyzer
- 5.1.1.2. Calorimeter
- 5.1.1.3. Mass Spectrometer
- 5.1.1.4. Gas Chromatograph
- 5.1.2. Remote Mounting
- 5.1.2.1. Multi Spectrum Infrared (MSIR)
- 5.1.2.2. Thermal Imager (IR)
- 5.1.2.3. Others
- 5.1.1. In-process mounting
- 5.2. Market Analysis, Insights and Forecast - by End-User
- 5.2.1. Refinery
- 5.2.2. Landfill
- 5.2.3. Petrochemical
- 5.2.4. Oil & Gas
- 5.2.5. Other End Users
- 5.3. Market Analysis, Insights and Forecast - by Region
- 5.3.1. North America
- 5.3.2. Europe
- 5.3.3. Asia Pacific
- 5.3.4. Rest of the World
- 5.1. Market Analysis, Insights and Forecast - by Mounting Method
- 6. North America Flare Monitoring Market Analysis, Insights and Forecast, 2019-2031
- 6.1. Market Analysis, Insights and Forecast - by Mounting Method
- 6.1.1. In-process mounting
- 6.1.1.1. Gas Analyzer
- 6.1.1.2. Calorimeter
- 6.1.1.3. Mass Spectrometer
- 6.1.1.4. Gas Chromatograph
- 6.1.2. Remote Mounting
- 6.1.2.1. Multi Spectrum Infrared (MSIR)
- 6.1.2.2. Thermal Imager (IR)
- 6.1.2.3. Others
- 6.1.1. In-process mounting
- 6.2. Market Analysis, Insights and Forecast - by End-User
- 6.2.1. Refinery
- 6.2.2. Landfill
- 6.2.3. Petrochemical
- 6.2.4. Oil & Gas
- 6.2.5. Other End Users
- 6.1. Market Analysis, Insights and Forecast - by Mounting Method
- 7. Europe Flare Monitoring Market Analysis, Insights and Forecast, 2019-2031
- 7.1. Market Analysis, Insights and Forecast - by Mounting Method
- 7.1.1. In-process mounting
- 7.1.1.1. Gas Analyzer
- 7.1.1.2. Calorimeter
- 7.1.1.3. Mass Spectrometer
- 7.1.1.4. Gas Chromatograph
- 7.1.2. Remote Mounting
- 7.1.2.1. Multi Spectrum Infrared (MSIR)
- 7.1.2.2. Thermal Imager (IR)
- 7.1.2.3. Others
- 7.1.1. In-process mounting
- 7.2. Market Analysis, Insights and Forecast - by End-User
- 7.2.1. Refinery
- 7.2.2. Landfill
- 7.2.3. Petrochemical
- 7.2.4. Oil & Gas
- 7.2.5. Other End Users
- 7.1. Market Analysis, Insights and Forecast - by Mounting Method
- 8. Asia Pacific Flare Monitoring Market Analysis, Insights and Forecast, 2019-2031
- 8.1. Market Analysis, Insights and Forecast - by Mounting Method
- 8.1.1. In-process mounting
- 8.1.1.1. Gas Analyzer
- 8.1.1.2. Calorimeter
- 8.1.1.3. Mass Spectrometer
- 8.1.1.4. Gas Chromatograph
- 8.1.2. Remote Mounting
- 8.1.2.1. Multi Spectrum Infrared (MSIR)
- 8.1.2.2. Thermal Imager (IR)
- 8.1.2.3. Others
- 8.1.1. In-process mounting
- 8.2. Market Analysis, Insights and Forecast - by End-User
- 8.2.1. Refinery
- 8.2.2. Landfill
- 8.2.3. Petrochemical
- 8.2.4. Oil & Gas
- 8.2.5. Other End Users
- 8.1. Market Analysis, Insights and Forecast - by Mounting Method
- 9. Rest of the World Flare Monitoring Market Analysis, Insights and Forecast, 2019-2031
- 9.1. Market Analysis, Insights and Forecast - by Mounting Method
- 9.1.1. In-process mounting
- 9.1.1.1. Gas Analyzer
- 9.1.1.2. Calorimeter
- 9.1.1.3. Mass Spectrometer
- 9.1.1.4. Gas Chromatograph
- 9.1.2. Remote Mounting
- 9.1.2.1. Multi Spectrum Infrared (MSIR)
- 9.1.2.2. Thermal Imager (IR)
- 9.1.2.3. Others
- 9.1.1. In-process mounting
- 9.2. Market Analysis, Insights and Forecast - by End-User
- 9.2.1. Refinery
- 9.2.2. Landfill
- 9.2.3. Petrochemical
- 9.2.4. Oil & Gas
- 9.2.5. Other End Users
- 9.1. Market Analysis, Insights and Forecast - by Mounting Method
- 10. North America Flare Monitoring Market Analysis, Insights and Forecast, 2019-2031
- 10.1. Market Analysis, Insights and Forecast - By Country/Sub-region
- 10.1.1. undefined
- 11. Europe Flare Monitoring Market Analysis, Insights and Forecast, 2019-2031
- 11.1. Market Analysis, Insights and Forecast - By Country/Sub-region
- 11.1.1. undefined
- 12. Asia Pacific Flare Monitoring Market Analysis, Insights and Forecast, 2019-2031
- 12.1. Market Analysis, Insights and Forecast - By Country/Sub-region
- 12.1.1. undefined
- 13. South America Flare Monitoring Market Analysis, Insights and Forecast, 2019-2031
- 13.1. Market Analysis, Insights and Forecast - By Country/Sub-region
- 13.1.1. undefined
- 14. North America Flare Monitoring Market Analysis, Insights and Forecast, 2019-2031
- 14.1. Market Analysis, Insights and Forecast - By Country/Sub-region
- 14.1.1. undefined
- 15. MEA Flare Monitoring Market Analysis, Insights and Forecast, 2019-2031
- 15.1. Market Analysis, Insights and Forecast - By Country/Sub-region
- 15.1.1. undefined
- 16. Competitive Analysis
- 16.1. Global Market Share Analysis 2024
- 16.2. Company Profiles
- 16.2.1 Williamson Corporation
- 16.2.1.1. Overview
- 16.2.1.2. Products
- 16.2.1.3. SWOT Analysis
- 16.2.1.4. Recent Developments
- 16.2.1.5. Financials (Based on Availability)
- 16.2.2 Endress+Hauser
- 16.2.2.1. Overview
- 16.2.2.2. Products
- 16.2.2.3. SWOT Analysis
- 16.2.2.4. Recent Developments
- 16.2.2.5. Financials (Based on Availability)
- 16.2.3 Providence Photonics LLC
- 16.2.3.1. Overview
- 16.2.3.2. Products
- 16.2.3.3. SWOT Analysis
- 16.2.3.4. Recent Developments
- 16.2.3.5. Financials (Based on Availability)
- 16.2.4 Honeywell International Inc
- 16.2.4.1. Overview
- 16.2.4.2. Products
- 16.2.4.3. SWOT Analysis
- 16.2.4.4. Recent Developments
- 16.2.4.5. Financials (Based on Availability)
- 16.2.5 ABB Ltd
- 16.2.5.1. Overview
- 16.2.5.2. Products
- 16.2.5.3. SWOT Analysis
- 16.2.5.4. Recent Developments
- 16.2.5.5. Financials (Based on Availability)
- 16.2.6 Zeeco Inc
- 16.2.6.1. Overview
- 16.2.6.2. Products
- 16.2.6.3. SWOT Analysis
- 16.2.6.4. Recent Developments
- 16.2.6.5. Financials (Based on Availability)
- 16.2.7 John Zink Company LLC
- 16.2.7.1. Overview
- 16.2.7.2. Products
- 16.2.7.3. SWOT Analysis
- 16.2.7.4. Recent Developments
- 16.2.7.5. Financials (Based on Availability)
- 16.2.8 Emerson Electric Co
- 16.2.8.1. Overview
- 16.2.8.2. Products
- 16.2.8.3. SWOT Analysis
- 16.2.8.4. Recent Developments
- 16.2.8.5. Financials (Based on Availability)
- 16.2.9 Siemens AG
- 16.2.9.1. Overview
- 16.2.9.2. Products
- 16.2.9.3. SWOT Analysis
- 16.2.9.4. Recent Developments
- 16.2.9.5. Financials (Based on Availability)
- 16.2.10 Lumasense Technologies Inc
- 16.2.10.1. Overview
- 16.2.10.2. Products
- 16.2.10.3. SWOT Analysis
- 16.2.10.4. Recent Developments
- 16.2.10.5. Financials (Based on Availability)
- 16.2.11 Ametek Inc
- 16.2.11.1. Overview
- 16.2.11.2. Products
- 16.2.11.3. SWOT Analysis
- 16.2.11.4. Recent Developments
- 16.2.11.5. Financials (Based on Availability)
- 16.2.12 Oleumtech Corporation
- 16.2.12.1. Overview
- 16.2.12.2. Products
- 16.2.12.3. SWOT Analysis
- 16.2.12.4. Recent Developments
- 16.2.12.5. Financials (Based on Availability)
- 16.2.13 MKS Instruments Inc
- 16.2.13.1. Overview
- 16.2.13.2. Products
- 16.2.13.3. SWOT Analysis
- 16.2.13.4. Recent Developments
- 16.2.13.5. Financials (Based on Availability)
- 16.2.14 Fluenta
- 16.2.14.1. Overview
- 16.2.14.2. Products
- 16.2.14.3. SWOT Analysis
- 16.2.14.4. Recent Developments
- 16.2.14.5. Financials (Based on Availability)
- 16.2.15 Thermo Fisher Scientific
- 16.2.15.1. Overview
- 16.2.15.2. Products
- 16.2.15.3. SWOT Analysis
- 16.2.15.4. Recent Developments
- 16.2.15.5. Financials (Based on Availability)
- 16.2.16 Eaton Hernis Scan Systems
- 16.2.16.1. Overview
- 16.2.16.2. Products
- 16.2.16.3. SWOT Analysis
- 16.2.16.4. Recent Developments
- 16.2.16.5. Financials (Based on Availability)
- 16.2.17 FLIR Systems
- 16.2.17.1. Overview
- 16.2.17.2. Products
- 16.2.17.3. SWOT Analysis
- 16.2.17.4. Recent Developments
- 16.2.17.5. Financials (Based on Availability)
- 16.2.1 Williamson Corporation
List of Figures
- Figure 1: Global Flare Monitoring Market Revenue Breakdown (Million, %) by Region 2024 & 2032
- Figure 2: Global Flare Monitoring Market Volume Breakdown (K Unit, %) by Region 2024 & 2032
- Figure 3: North America Flare Monitoring Market Revenue (Million), by Country 2024 & 2032
- Figure 4: North America Flare Monitoring Market Volume (K Unit), by Country 2024 & 2032
- Figure 5: North America Flare Monitoring Market Revenue Share (%), by Country 2024 & 2032
- Figure 6: North America Flare Monitoring Market Volume Share (%), by Country 2024 & 2032
- Figure 7: Europe Flare Monitoring Market Revenue (Million), by Country 2024 & 2032
- Figure 8: Europe Flare Monitoring Market Volume (K Unit), by Country 2024 & 2032
- Figure 9: Europe Flare Monitoring Market Revenue Share (%), by Country 2024 & 2032
- Figure 10: Europe Flare Monitoring Market Volume Share (%), by Country 2024 & 2032
- Figure 11: Asia Pacific Flare Monitoring Market Revenue (Million), by Country 2024 & 2032
- Figure 12: Asia Pacific Flare Monitoring Market Volume (K Unit), by Country 2024 & 2032
- Figure 13: Asia Pacific Flare Monitoring Market Revenue Share (%), by Country 2024 & 2032
- Figure 14: Asia Pacific Flare Monitoring Market Volume Share (%), by Country 2024 & 2032
- Figure 15: South America Flare Monitoring Market Revenue (Million), by Country 2024 & 2032
- Figure 16: South America Flare Monitoring Market Volume (K Unit), by Country 2024 & 2032
- Figure 17: South America Flare Monitoring Market Revenue Share (%), by Country 2024 & 2032
- Figure 18: South America Flare Monitoring Market Volume Share (%), by Country 2024 & 2032
- Figure 19: North America Flare Monitoring Market Revenue (Million), by Country 2024 & 2032
- Figure 20: North America Flare Monitoring Market Volume (K Unit), by Country 2024 & 2032
- Figure 21: North America Flare Monitoring Market Revenue Share (%), by Country 2024 & 2032
- Figure 22: North America Flare Monitoring Market Volume Share (%), by Country 2024 & 2032
- Figure 23: MEA Flare Monitoring Market Revenue (Million), by Country 2024 & 2032
- Figure 24: MEA Flare Monitoring Market Volume (K Unit), by Country 2024 & 2032
- Figure 25: MEA Flare Monitoring Market Revenue Share (%), by Country 2024 & 2032
- Figure 26: MEA Flare Monitoring Market Volume Share (%), by Country 2024 & 2032
- Figure 27: North America Flare Monitoring Market Revenue (Million), by Mounting Method 2024 & 2032
- Figure 28: North America Flare Monitoring Market Volume (K Unit), by Mounting Method 2024 & 2032
- Figure 29: North America Flare Monitoring Market Revenue Share (%), by Mounting Method 2024 & 2032
- Figure 30: North America Flare Monitoring Market Volume Share (%), by Mounting Method 2024 & 2032
- Figure 31: North America Flare Monitoring Market Revenue (Million), by End-User 2024 & 2032
- Figure 32: North America Flare Monitoring Market Volume (K Unit), by End-User 2024 & 2032
- Figure 33: North America Flare Monitoring Market Revenue Share (%), by End-User 2024 & 2032
- Figure 34: North America Flare Monitoring Market Volume Share (%), by End-User 2024 & 2032
- Figure 35: North America Flare Monitoring Market Revenue (Million), by Country 2024 & 2032
- Figure 36: North America Flare Monitoring Market Volume (K Unit), by Country 2024 & 2032
- Figure 37: North America Flare Monitoring Market Revenue Share (%), by Country 2024 & 2032
- Figure 38: North America Flare Monitoring Market Volume Share (%), by Country 2024 & 2032
- Figure 39: Europe Flare Monitoring Market Revenue (Million), by Mounting Method 2024 & 2032
- Figure 40: Europe Flare Monitoring Market Volume (K Unit), by Mounting Method 2024 & 2032
- Figure 41: Europe Flare Monitoring Market Revenue Share (%), by Mounting Method 2024 & 2032
- Figure 42: Europe Flare Monitoring Market Volume Share (%), by Mounting Method 2024 & 2032
- Figure 43: Europe Flare Monitoring Market Revenue (Million), by End-User 2024 & 2032
- Figure 44: Europe Flare Monitoring Market Volume (K Unit), by End-User 2024 & 2032
- Figure 45: Europe Flare Monitoring Market Revenue Share (%), by End-User 2024 & 2032
- Figure 46: Europe Flare Monitoring Market Volume Share (%), by End-User 2024 & 2032
- Figure 47: Europe Flare Monitoring Market Revenue (Million), by Country 2024 & 2032
- Figure 48: Europe Flare Monitoring Market Volume (K Unit), by Country 2024 & 2032
- Figure 49: Europe Flare Monitoring Market Revenue Share (%), by Country 2024 & 2032
- Figure 50: Europe Flare Monitoring Market Volume Share (%), by Country 2024 & 2032
- Figure 51: Asia Pacific Flare Monitoring Market Revenue (Million), by Mounting Method 2024 & 2032
- Figure 52: Asia Pacific Flare Monitoring Market Volume (K Unit), by Mounting Method 2024 & 2032
- Figure 53: Asia Pacific Flare Monitoring Market Revenue Share (%), by Mounting Method 2024 & 2032
- Figure 54: Asia Pacific Flare Monitoring Market Volume Share (%), by Mounting Method 2024 & 2032
- Figure 55: Asia Pacific Flare Monitoring Market Revenue (Million), by End-User 2024 & 2032
- Figure 56: Asia Pacific Flare Monitoring Market Volume (K Unit), by End-User 2024 & 2032
- Figure 57: Asia Pacific Flare Monitoring Market Revenue Share (%), by End-User 2024 & 2032
- Figure 58: Asia Pacific Flare Monitoring Market Volume Share (%), by End-User 2024 & 2032
- Figure 59: Asia Pacific Flare Monitoring Market Revenue (Million), by Country 2024 & 2032
- Figure 60: Asia Pacific Flare Monitoring Market Volume (K Unit), by Country 2024 & 2032
- Figure 61: Asia Pacific Flare Monitoring Market Revenue Share (%), by Country 2024 & 2032
- Figure 62: Asia Pacific Flare Monitoring Market Volume Share (%), by Country 2024 & 2032
- Figure 63: Rest of the World Flare Monitoring Market Revenue (Million), by Mounting Method 2024 & 2032
- Figure 64: Rest of the World Flare Monitoring Market Volume (K Unit), by Mounting Method 2024 & 2032
- Figure 65: Rest of the World Flare Monitoring Market Revenue Share (%), by Mounting Method 2024 & 2032
- Figure 66: Rest of the World Flare Monitoring Market Volume Share (%), by Mounting Method 2024 & 2032
- Figure 67: Rest of the World Flare Monitoring Market Revenue (Million), by End-User 2024 & 2032
- Figure 68: Rest of the World Flare Monitoring Market Volume (K Unit), by End-User 2024 & 2032
- Figure 69: Rest of the World Flare Monitoring Market Revenue Share (%), by End-User 2024 & 2032
- Figure 70: Rest of the World Flare Monitoring Market Volume Share (%), by End-User 2024 & 2032
- Figure 71: Rest of the World Flare Monitoring Market Revenue (Million), by Country 2024 & 2032
- Figure 72: Rest of the World Flare Monitoring Market Volume (K Unit), by Country 2024 & 2032
- Figure 73: Rest of the World Flare Monitoring Market Revenue Share (%), by Country 2024 & 2032
- Figure 74: Rest of the World Flare Monitoring Market Volume Share (%), by Country 2024 & 2032
List of Tables
- Table 1: Global Flare Monitoring Market Revenue Million Forecast, by Region 2019 & 2032
- Table 2: Global Flare Monitoring Market Volume K Unit Forecast, by Region 2019 & 2032
- Table 3: Global Flare Monitoring Market Revenue Million Forecast, by Mounting Method 2019 & 2032
- Table 4: Global Flare Monitoring Market Volume K Unit Forecast, by Mounting Method 2019 & 2032
- Table 5: Global Flare Monitoring Market Revenue Million Forecast, by End-User 2019 & 2032
- Table 6: Global Flare Monitoring Market Volume K Unit Forecast, by End-User 2019 & 2032
- Table 7: Global Flare Monitoring Market Revenue Million Forecast, by Region 2019 & 2032
- Table 8: Global Flare Monitoring Market Volume K Unit Forecast, by Region 2019 & 2032
- Table 9: Global Flare Monitoring Market Revenue Million Forecast, by Country 2019 & 2032
- Table 10: Global Flare Monitoring Market Volume K Unit Forecast, by Country 2019 & 2032
- Table 11: Global Flare Monitoring Market Revenue Million Forecast, by Country 2019 & 2032
- Table 12: Global Flare Monitoring Market Volume K Unit Forecast, by Country 2019 & 2032
- Table 13: Global Flare Monitoring Market Revenue Million Forecast, by Country 2019 & 2032
- Table 14: Global Flare Monitoring Market Volume K Unit Forecast, by Country 2019 & 2032
- Table 15: Global Flare Monitoring Market Revenue Million Forecast, by Country 2019 & 2032
- Table 16: Global Flare Monitoring Market Volume K Unit Forecast, by Country 2019 & 2032
- Table 17: Global Flare Monitoring Market Revenue Million Forecast, by Country 2019 & 2032
- Table 18: Global Flare Monitoring Market Volume K Unit Forecast, by Country 2019 & 2032
- Table 19: Global Flare Monitoring Market Revenue Million Forecast, by Country 2019 & 2032
- Table 20: Global Flare Monitoring Market Volume K Unit Forecast, by Country 2019 & 2032
- Table 21: Global Flare Monitoring Market Revenue Million Forecast, by Mounting Method 2019 & 2032
- Table 22: Global Flare Monitoring Market Volume K Unit Forecast, by Mounting Method 2019 & 2032
- Table 23: Global Flare Monitoring Market Revenue Million Forecast, by End-User 2019 & 2032
- Table 24: Global Flare Monitoring Market Volume K Unit Forecast, by End-User 2019 & 2032
- Table 25: Global Flare Monitoring Market Revenue Million Forecast, by Country 2019 & 2032
- Table 26: Global Flare Monitoring Market Volume K Unit Forecast, by Country 2019 & 2032
- Table 27: Global Flare Monitoring Market Revenue Million Forecast, by Mounting Method 2019 & 2032
- Table 28: Global Flare Monitoring Market Volume K Unit Forecast, by Mounting Method 2019 & 2032
- Table 29: Global Flare Monitoring Market Revenue Million Forecast, by End-User 2019 & 2032
- Table 30: Global Flare Monitoring Market Volume K Unit Forecast, by End-User 2019 & 2032
- Table 31: Global Flare Monitoring Market Revenue Million Forecast, by Country 2019 & 2032
- Table 32: Global Flare Monitoring Market Volume K Unit Forecast, by Country 2019 & 2032
- Table 33: Global Flare Monitoring Market Revenue Million Forecast, by Mounting Method 2019 & 2032
- Table 34: Global Flare Monitoring Market Volume K Unit Forecast, by Mounting Method 2019 & 2032
- Table 35: Global Flare Monitoring Market Revenue Million Forecast, by End-User 2019 & 2032
- Table 36: Global Flare Monitoring Market Volume K Unit Forecast, by End-User 2019 & 2032
- Table 37: Global Flare Monitoring Market Revenue Million Forecast, by Country 2019 & 2032
- Table 38: Global Flare Monitoring Market Volume K Unit Forecast, by Country 2019 & 2032
- Table 39: Global Flare Monitoring Market Revenue Million Forecast, by Mounting Method 2019 & 2032
- Table 40: Global Flare Monitoring Market Volume K Unit Forecast, by Mounting Method 2019 & 2032
- Table 41: Global Flare Monitoring Market Revenue Million Forecast, by End-User 2019 & 2032
- Table 42: Global Flare Monitoring Market Volume K Unit Forecast, by End-User 2019 & 2032
- Table 43: Global Flare Monitoring Market Revenue Million Forecast, by Country 2019 & 2032
- Table 44: Global Flare Monitoring Market Volume K Unit Forecast, by Country 2019 & 2032
Frequently Asked Questions
1. What is the projected Compound Annual Growth Rate (CAGR) of the Flare Monitoring Market?
The projected CAGR is approximately 8.00%.
2. Which companies are prominent players in the Flare Monitoring Market?
Key companies in the market include Williamson Corporation, Endress+Hauser, Providence Photonics LLC, Honeywell International Inc, ABB Ltd, Zeeco Inc, John Zink Company LLC, Emerson Electric Co, Siemens AG, Lumasense Technologies Inc, Ametek Inc, Oleumtech Corporation, MKS Instruments Inc, Fluenta, Thermo Fisher Scientific, Eaton Hernis Scan Systems, FLIR Systems.
3. What are the main segments of the Flare Monitoring Market?
The market segments include Mounting Method, End-User.
4. Can you provide details about the market size?
The market size is estimated to be USD XX Million as of 2022.
5. What are some drivers contributing to market growth?
; Stringent Government Environmental Regulations Related to Industrial Gas Emission; Expansion of Oil. Gas. and Petrochemicals Industries.
6. What are the notable trends driving market growth?
Oil & Gas Industry to Account for Maximum Share.
7. Are there any restraints impacting market growth?
; Initiative of Zero Routine Flaring by 2030.
8. Can you provide examples of recent developments in the market?
N/A
9. What pricing options are available for accessing the report?
Pricing options include single-user, multi-user, and enterprise licenses priced at USD 4750, USD 5250, and USD 8750 respectively.
10. Is the market size provided in terms of value or volume?
The market size is provided in terms of value, measured in Million and volume, measured in K Unit.
11. Are there any specific market keywords associated with the report?
Yes, the market keyword associated with the report is "Flare Monitoring Market," which aids in identifying and referencing the specific market segment covered.
12. How do I determine which pricing option suits my needs best?
The pricing options vary based on user requirements and access needs. Individual users may opt for single-user licenses, while businesses requiring broader access may choose multi-user or enterprise licenses for cost-effective access to the report.
13. Are there any additional resources or data provided in the Flare Monitoring Market report?
While the report offers comprehensive insights, it's advisable to review the specific contents or supplementary materials provided to ascertain if additional resources or data are available.
14. How can I stay updated on further developments or reports in the Flare Monitoring Market?
To stay informed about further developments, trends, and reports in the Flare Monitoring Market, consider subscribing to industry newsletters, following relevant companies and organizations, or regularly checking reputable industry news sources and publications.
Methodology
Step 1 - Identification of Relevant Samples Size from Population Database


Step 2 - Approaches for Defining Global Market Size (Value, Volume* & Price*)

Note*: In applicable scenarios
Step 3 - Data Sources
Primary Research
- Web Analytics
- Survey Reports
- Research Institute
- Latest Research Reports
- Opinion Leaders
Secondary Research
- Annual Reports
- White Paper
- Latest Press Release
- Industry Association
- Paid Database
- Investor Presentations

Step 4 - Data Triangulation
Involves using different sources of information in order to increase the validity of a study
These sources are likely to be stakeholders in a program - participants, other researchers, program staff, other community members, and so on.
Then we put all data in single framework & apply various statistical tools to find out the dynamic on the market.
During the analysis stage, feedback from the stakeholder groups would be compared to determine areas of agreement as well as areas of divergence


