
Key Insights
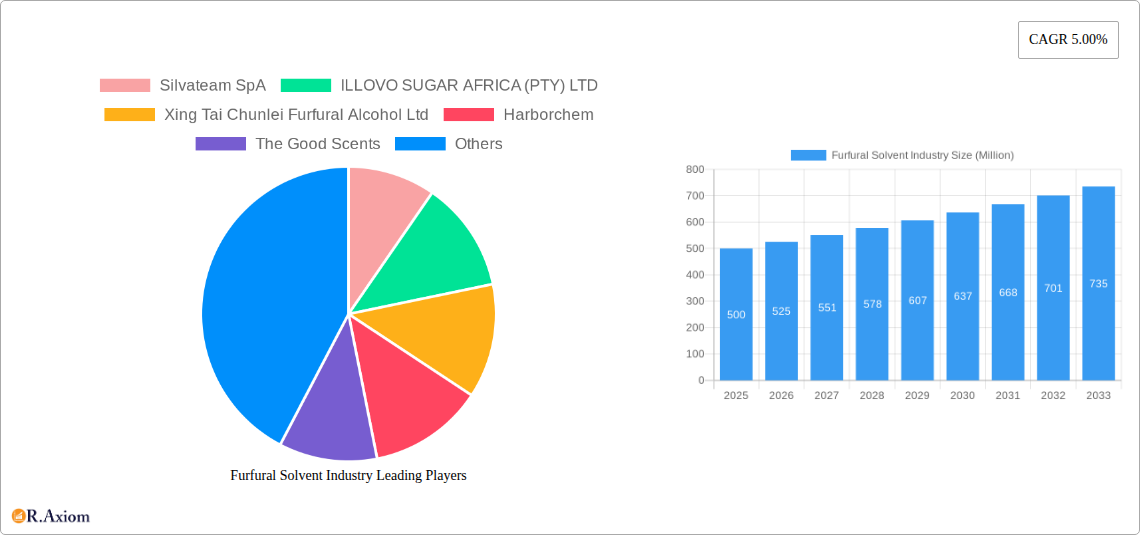
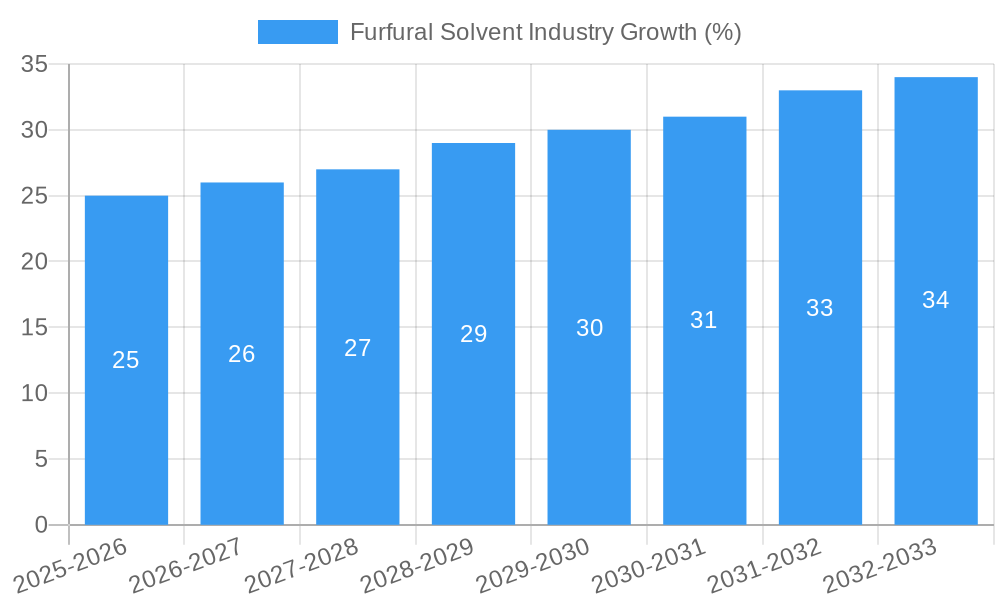
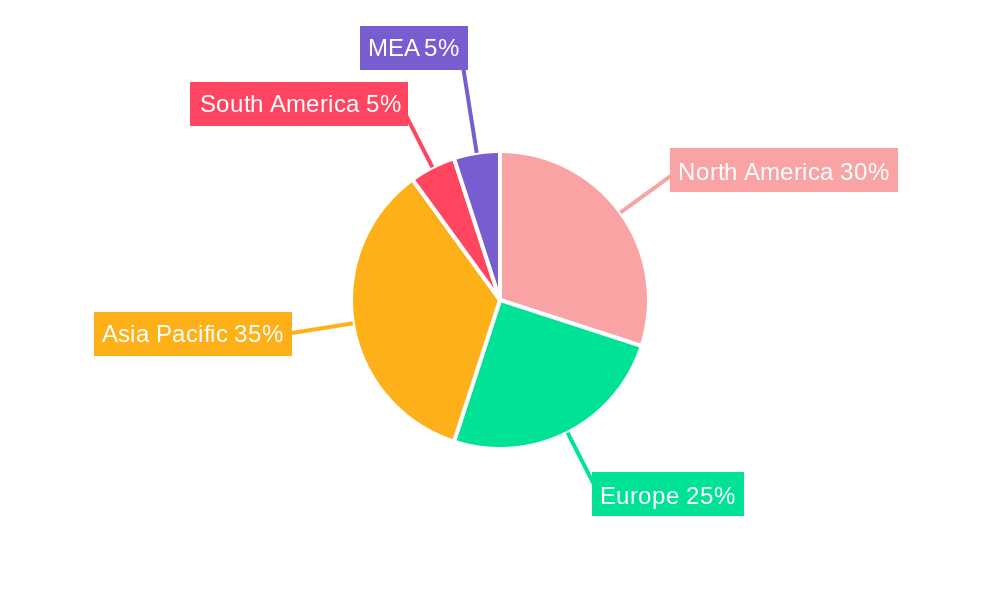
The global furfural solvent market is experiencing steady growth, projected to maintain a Compound Annual Growth Rate (CAGR) of 5.00% from 2025 to 2033. This expansion is driven by increasing demand across diverse end-user industries, notably petroleum refining, agrochemicals, paints and coatings, and pharmaceuticals. The rising adoption of furfural as a sustainable and versatile solvent in these sectors is a key catalyst. Growth is further fueled by the inherent properties of furfural, including its effectiveness as a selective solvent, its bio-based origin offering environmental benefits, and its cost-effectiveness compared to some synthetic alternatives. However, market fluctuations in raw material prices and stringent environmental regulations pose potential restraints to growth. The market is segmented geographically, with North America, Europe, and Asia-Pacific representing significant market shares, reflecting established industrial bases and substantial consumption within these regions. Competition among key players like Silvateam SpA, ILLOVO SUGAR AFRICA (PTY) LTD, and Xing Tai Chunlei Furfural Alcohol Ltd is intense, driving innovation and the development of new applications for furfural solvents.
Future growth will likely be shaped by advancements in furfural production technologies focusing on increased efficiency and reduced environmental impact. The expanding bio-based chemicals market presents a significant opportunity for furfural, aligning with the growing global emphasis on sustainability. Companies are actively exploring new applications and partnerships to tap into this burgeoning market. The increasing awareness of the environmental implications of traditional solvents is expected to further bolster demand for furfural, driving market penetration across various sectors. Regional growth will be influenced by the economic conditions, government policies promoting sustainable practices, and the pace of industrial development within specific geographical areas. A continued focus on research and development aimed at improving furfural's performance characteristics and expanding its application portfolio will be crucial for sustaining market growth in the coming years.
Furfural Solvent Industry: A Comprehensive Market Analysis (2019-2033)
This in-depth report provides a comprehensive analysis of the Furfural Solvent industry, offering invaluable insights for stakeholders seeking to navigate this dynamic market. The study covers the period from 2019 to 2033, with 2025 serving as the base and estimated year. The report leverages extensive data analysis to forecast market trends and growth opportunities, empowering informed decision-making. Key players such as Silvateam SpA, ILLOVO SUGAR AFRICA (PTY) LTD, Xing Tai Chunlei Furfural Alcohol Ltd, and others are profiled, providing a competitive landscape overview. The report segments the market by end-user industry (Petroleum Refining, Agrochemicals, Paints and Coatings, Pharmaceuticals, Other End-user Industries), offering granular analysis for each sector.
Furfural Solvent Industry Market Concentration & Innovation
The Furfural Solvent market exhibits a moderately concentrated structure, with the top five players holding approximately xx% of the global market share in 2025. Innovation is driven by the demand for sustainable and high-performance solvents, leading to research and development in bio-based furfural and improved production processes. Regulatory frameworks, particularly concerning environmental regulations and safety standards, significantly influence market dynamics. The emergence of biodegradable alternatives poses a potential threat, although furfural's unique properties continue to secure its position in specific applications. Mergers and acquisitions (M&A) activity has been moderate, with deal values totaling approximately $xx Million in the last five years. Key M&A activities include:
- Acquisition of [Company Name] by [Company Name] in [Year], valued at $xx Million.
- Strategic partnership between [Company Name] and [Company Name] in [Year] to expand market reach.
Furfural Solvent Industry Industry Trends & Insights
The global Furfural Solvent market is projected to witness a Compound Annual Growth Rate (CAGR) of xx% during the forecast period (2025-2033), driven by increasing demand from key end-user industries. Technological advancements in furfural production, focusing on enhancing efficiency and reducing environmental impact, are key growth drivers. Consumer preference for sustainable and eco-friendly products fuels demand for bio-based furfural. Intense competition among existing players is observed, prompting strategic initiatives such as capacity expansions, product diversification, and geographic expansion. Market penetration in emerging economies is expected to increase significantly, driven by infrastructure development and industrial growth. The market penetration rate is estimated to reach xx% by 2033.
Dominant Markets & Segments in Furfural Solvent Industry
The Petroleum Refining segment is currently the dominant end-user industry for furfural solvent, accounting for xx% of global demand in 2025. This dominance stems from its effectiveness in solvent extraction processes. Key drivers include:
- Robust economic growth in major oil-producing regions.
- Significant investments in refinery modernization and expansion.
The Asia-Pacific region dominates the global Furfural Solvent market, driven by strong industrial growth and increasing demand from China and India. This region holds xx% of the global market share in 2025.
- Rapid industrialization: Increased demand from various sectors, including chemical processing and manufacturing.
- Favorable government policies: Support for industrial development and foreign direct investment.
Other regions such as North America and Europe also show considerable demand although their growth rate is comparatively lower than the Asia-Pacific.
Furfural Solvent Industry Product Developments
Recent innovations focus on developing high-purity furfural with improved properties to cater to the specific demands of various applications. This includes the development of bio-based furfural, enhancing sustainability and reducing environmental impact. The focus is on creating tailored furfural formulations to optimize performance in different end-use applications while enhancing cost-effectiveness and competitive advantage.
Report Scope & Segmentation Analysis
This report segments the Furfural Solvent market by end-user industry:
Petroleum Refining: This segment is characterized by high volume consumption and relatively stable growth, driven by continuous operations in the oil and gas sector.
Agrochemicals: Demand is growing due to increasing agricultural production and the need for effective pesticide formulations.
Paints and Coatings: Furfural solvents provide unique properties for paints and coatings, boosting its demand in this segment.
Pharmaceuticals: The pharmaceutical industry uses furfural as a solvent in specific drug manufacturing processes.
Other End-user Industries: This segment encompasses various smaller applications with moderate growth potential. The overall market size for each segment is detailed in the full report, along with projected growth rates and competitive analyses.
Key Drivers of Furfural Solvent Industry Growth
The Furfural Solvent market's growth is primarily fueled by:
- Expanding downstream industries: Strong growth in petroleum refining, agrochemicals, and other sectors drives demand for furfural solvents.
- Technological advancements: Improvements in production efficiency and the development of bio-based furfural contribute to growth.
- Favorable government policies: Supportive regulatory frameworks and incentives for industrial development boost market growth.
Challenges in the Furfural Solvent Industry Sector
Key challenges impacting the Furfural Solvent industry include:
- Fluctuating raw material prices: The cost of raw materials influences the profitability of furfural production.
- Stringent environmental regulations: Compliance with environmental standards necessitates investments in cleaner production technologies.
- Competition from alternative solvents: The emergence of alternative solvents presents a competitive challenge.
Emerging Opportunities in Furfural Solvent Industry
Emerging opportunities exist in:
- Bio-based furfural production: Growing demand for sustainable products drives the development of bio-based furfural.
- Expansion into new applications: Exploring furfural’s use in emerging industries like renewable energy and advanced materials.
- Market penetration in developing economies: Untapped potential exists in developing countries with growing industrial sectors.
Leading Players in the Furfural Solvent Industry Market
- Silvateam SpA
- ILLOVO SUGAR AFRICA (PTY) LTD
- Xing Tai Chunlei Furfural Alcohol Ltd
- Harborchem
- The Good Scents
- Furfural Espanol SA
- Alchem Chemical Co
- Shandong Crownchem Industries Co Ltd
- Pennakem LLC
- Teijing North Furfural Co
- Linzi Organic Chemical
- Transfurans Chemicals
- Goodrich Sugar & Chemical
Key Developments in Furfural Solvent Industry Industry
- [Month, Year]: [Company Name] launched a new bio-based furfural solvent, enhancing its sustainability profile.
- [Month, Year]: [Company Name] announced a strategic partnership to expand its global reach.
- [Month, Year]: New environmental regulations implemented in [Region] impacting furfural production methods.
Strategic Outlook for Furfural Solvent Industry Market
The Furfural Solvent market is poised for continued growth driven by sustained demand from key industries and the emergence of innovative applications. The focus on sustainability and the development of bio-based alternatives will shape future market dynamics. Significant opportunities exist in expanding into new markets and further optimizing production processes to achieve greater efficiency and cost-effectiveness. The market is expected to witness a robust expansion over the forecast period, offering lucrative prospects for both established and emerging players.
Furfural Solvent Industry Segmentation
-
1. End-user Industry
- 1.1. Petroleum Refining
- 1.2. Agrochemicals
- 1.3. Paints and Coatings
- 1.4. Pharmaceuticals
- 1.5. Other End-user Industries
Furfural Solvent Industry Segmentation By Geography
-
1. Asia Pacific
- 1.1. China
- 1.2. India
- 1.3. Japan
- 1.4. South Korea
- 1.5. Rest of Asia Pacific
-
2. North America
- 2.1. United States
- 2.2. Mexico
- 2.3. Canada
-
3. Europe
- 3.1. Germany
- 3.2. United Kingdom
- 3.3. Italy
- 3.4. France
- 3.5. Rest of Europe
-
4. South America
- 4.1. Brazil
- 4.2. Argentina
- 4.3. Rest of South America
-
5. Middle East and Africa
- 5.1. Saudi Arabia
- 5.2. South Africa
- 5.3. Rest of Middle East and Africa
Furfural Solvent Industry REPORT HIGHLIGHTS
| Aspects | Details |
|---|---|
| Study Period | 2019-2033 |
| Base Year | 2024 |
| Estimated Year | 2025 |
| Forecast Period | 2025-2033 |
| Historical Period | 2019-2024 |
| Growth Rate | CAGR of 5.00% from 2019-2033 |
| Segmentation |
|
Table of Contents
- 1. Introduction
- 1.1. Research Scope
- 1.2. Market Segmentation
- 1.3. Research Methodology
- 1.4. Definitions and Assumptions
- 2. Executive Summary
- 2.1. Introduction
- 3. Market Dynamics
- 3.1. Introduction
- 3.2. Market Drivers
- 3.2.1. ; Non Toxicity and Low Volatile Organic Compound Content of Furfural Solvent; Other Drivers
- 3.3. Market Restrains
- 3.3.1. ; Limited Availability of Raw Material; Unfavorable Conditions Arising Due to COVID-19 Outbreak
- 3.4. Market Trends
- 3.4.1. Increasing Demand from Agrochemicals Segment
- 4. Market Factor Analysis
- 4.1. Porters Five Forces
- 4.2. Supply/Value Chain
- 4.3. PESTEL analysis
- 4.4. Market Entropy
- 4.5. Patent/Trademark Analysis
- 5. Global Furfural Solvent Industry Analysis, Insights and Forecast, 2019-2031
- 5.1. Market Analysis, Insights and Forecast - by End-user Industry
- 5.1.1. Petroleum Refining
- 5.1.2. Agrochemicals
- 5.1.3. Paints and Coatings
- 5.1.4. Pharmaceuticals
- 5.1.5. Other End-user Industries
- 5.2. Market Analysis, Insights and Forecast - by Region
- 5.2.1. Asia Pacific
- 5.2.2. North America
- 5.2.3. Europe
- 5.2.4. South America
- 5.2.5. Middle East and Africa
- 5.1. Market Analysis, Insights and Forecast - by End-user Industry
- 6. Asia Pacific Furfural Solvent Industry Analysis, Insights and Forecast, 2019-2031
- 6.1. Market Analysis, Insights and Forecast - by End-user Industry
- 6.1.1. Petroleum Refining
- 6.1.2. Agrochemicals
- 6.1.3. Paints and Coatings
- 6.1.4. Pharmaceuticals
- 6.1.5. Other End-user Industries
- 6.1. Market Analysis, Insights and Forecast - by End-user Industry
- 7. North America Furfural Solvent Industry Analysis, Insights and Forecast, 2019-2031
- 7.1. Market Analysis, Insights and Forecast - by End-user Industry
- 7.1.1. Petroleum Refining
- 7.1.2. Agrochemicals
- 7.1.3. Paints and Coatings
- 7.1.4. Pharmaceuticals
- 7.1.5. Other End-user Industries
- 7.1. Market Analysis, Insights and Forecast - by End-user Industry
- 8. Europe Furfural Solvent Industry Analysis, Insights and Forecast, 2019-2031
- 8.1. Market Analysis, Insights and Forecast - by End-user Industry
- 8.1.1. Petroleum Refining
- 8.1.2. Agrochemicals
- 8.1.3. Paints and Coatings
- 8.1.4. Pharmaceuticals
- 8.1.5. Other End-user Industries
- 8.1. Market Analysis, Insights and Forecast - by End-user Industry
- 9. South America Furfural Solvent Industry Analysis, Insights and Forecast, 2019-2031
- 9.1. Market Analysis, Insights and Forecast - by End-user Industry
- 9.1.1. Petroleum Refining
- 9.1.2. Agrochemicals
- 9.1.3. Paints and Coatings
- 9.1.4. Pharmaceuticals
- 9.1.5. Other End-user Industries
- 9.1. Market Analysis, Insights and Forecast - by End-user Industry
- 10. Middle East and Africa Furfural Solvent Industry Analysis, Insights and Forecast, 2019-2031
- 10.1. Market Analysis, Insights and Forecast - by End-user Industry
- 10.1.1. Petroleum Refining
- 10.1.2. Agrochemicals
- 10.1.3. Paints and Coatings
- 10.1.4. Pharmaceuticals
- 10.1.5. Other End-user Industries
- 10.1. Market Analysis, Insights and Forecast - by End-user Industry
- 11. North America Furfural Solvent Industry Analysis, Insights and Forecast, 2019-2031
- 11.1. Market Analysis, Insights and Forecast - By Country/Sub-region
- 11.1.1 United States
- 11.1.2 Mexico
- 11.1.3 Canada
- 12. Europe Furfural Solvent Industry Analysis, Insights and Forecast, 2019-2031
- 12.1. Market Analysis, Insights and Forecast - By Country/Sub-region
- 12.1.1 Germany
- 12.1.2 France
- 12.1.3 Italy
- 12.1.4 United Kingdom
- 12.1.5 Netherlands
- 12.1.6 Rest of Europe
- 13. Asia Pacific Furfural Solvent Industry Analysis, Insights and Forecast, 2019-2031
- 13.1. Market Analysis, Insights and Forecast - By Country/Sub-region
- 13.1.1 China
- 13.1.2 Japan
- 13.1.3 India
- 13.1.4 South Korea
- 13.1.5 Taiwan
- 13.1.6 Australia
- 13.1.7 Rest of Asia-Pacific
- 14. South America Furfural Solvent Industry Analysis, Insights and Forecast, 2019-2031
- 14.1. Market Analysis, Insights and Forecast - By Country/Sub-region
- 14.1.1 Brazil
- 14.1.2 Argentina
- 14.1.3 Rest of South America
- 15. MEA Furfural Solvent Industry Analysis, Insights and Forecast, 2019-2031
- 15.1. Market Analysis, Insights and Forecast - By Country/Sub-region
- 15.1.1 Middle East
- 15.1.2 Africa
- 16. Competitive Analysis
- 16.1. Global Market Share Analysis 2024
- 16.2. Company Profiles
- 16.2.1 Silvateam SpA
- 16.2.1.1. Overview
- 16.2.1.2. Products
- 16.2.1.3. SWOT Analysis
- 16.2.1.4. Recent Developments
- 16.2.1.5. Financials (Based on Availability)
- 16.2.2 ILLOVO SUGAR AFRICA (PTY) LTD
- 16.2.2.1. Overview
- 16.2.2.2. Products
- 16.2.2.3. SWOT Analysis
- 16.2.2.4. Recent Developments
- 16.2.2.5. Financials (Based on Availability)
- 16.2.3 Xing Tai Chunlei Furfural Alcohol Ltd
- 16.2.3.1. Overview
- 16.2.3.2. Products
- 16.2.3.3. SWOT Analysis
- 16.2.3.4. Recent Developments
- 16.2.3.5. Financials (Based on Availability)
- 16.2.4 Harborchem
- 16.2.4.1. Overview
- 16.2.4.2. Products
- 16.2.4.3. SWOT Analysis
- 16.2.4.4. Recent Developments
- 16.2.4.5. Financials (Based on Availability)
- 16.2.5 The Good Scents
- 16.2.5.1. Overview
- 16.2.5.2. Products
- 16.2.5.3. SWOT Analysis
- 16.2.5.4. Recent Developments
- 16.2.5.5. Financials (Based on Availability)
- 16.2.6 Furfural Espanol SA
- 16.2.6.1. Overview
- 16.2.6.2. Products
- 16.2.6.3. SWOT Analysis
- 16.2.6.4. Recent Developments
- 16.2.6.5. Financials (Based on Availability)
- 16.2.7 Alchem Chemical Co
- 16.2.7.1. Overview
- 16.2.7.2. Products
- 16.2.7.3. SWOT Analysis
- 16.2.7.4. Recent Developments
- 16.2.7.5. Financials (Based on Availability)
- 16.2.8 Shandong Crownchem Industries Co Ltd
- 16.2.8.1. Overview
- 16.2.8.2. Products
- 16.2.8.3. SWOT Analysis
- 16.2.8.4. Recent Developments
- 16.2.8.5. Financials (Based on Availability)
- 16.2.9 Pennakem LLC
- 16.2.9.1. Overview
- 16.2.9.2. Products
- 16.2.9.3. SWOT Analysis
- 16.2.9.4. Recent Developments
- 16.2.9.5. Financials (Based on Availability)
- 16.2.10 Teijing North Furfural Co
- 16.2.10.1. Overview
- 16.2.10.2. Products
- 16.2.10.3. SWOT Analysis
- 16.2.10.4. Recent Developments
- 16.2.10.5. Financials (Based on Availability)
- 16.2.11 Linzi Organic Chemical
- 16.2.11.1. Overview
- 16.2.11.2. Products
- 16.2.11.3. SWOT Analysis
- 16.2.11.4. Recent Developments
- 16.2.11.5. Financials (Based on Availability)
- 16.2.12 Transfurans Chemicals
- 16.2.12.1. Overview
- 16.2.12.2. Products
- 16.2.12.3. SWOT Analysis
- 16.2.12.4. Recent Developments
- 16.2.12.5. Financials (Based on Availability)
- 16.2.13 Goodrich Sugar & Chemical
- 16.2.13.1. Overview
- 16.2.13.2. Products
- 16.2.13.3. SWOT Analysis
- 16.2.13.4. Recent Developments
- 16.2.13.5. Financials (Based on Availability)
- 16.2.1 Silvateam SpA
List of Figures
- Figure 1: Global Furfural Solvent Industry Revenue Breakdown (Million, %) by Region 2024 & 2032
- Figure 2: Global Furfural Solvent Industry Volume Breakdown (K Tons, %) by Region 2024 & 2032
- Figure 3: North America Furfural Solvent Industry Revenue (Million), by Country 2024 & 2032
- Figure 4: North America Furfural Solvent Industry Volume (K Tons), by Country 2024 & 2032
- Figure 5: North America Furfural Solvent Industry Revenue Share (%), by Country 2024 & 2032
- Figure 6: North America Furfural Solvent Industry Volume Share (%), by Country 2024 & 2032
- Figure 7: Europe Furfural Solvent Industry Revenue (Million), by Country 2024 & 2032
- Figure 8: Europe Furfural Solvent Industry Volume (K Tons), by Country 2024 & 2032
- Figure 9: Europe Furfural Solvent Industry Revenue Share (%), by Country 2024 & 2032
- Figure 10: Europe Furfural Solvent Industry Volume Share (%), by Country 2024 & 2032
- Figure 11: Asia Pacific Furfural Solvent Industry Revenue (Million), by Country 2024 & 2032
- Figure 12: Asia Pacific Furfural Solvent Industry Volume (K Tons), by Country 2024 & 2032
- Figure 13: Asia Pacific Furfural Solvent Industry Revenue Share (%), by Country 2024 & 2032
- Figure 14: Asia Pacific Furfural Solvent Industry Volume Share (%), by Country 2024 & 2032
- Figure 15: South America Furfural Solvent Industry Revenue (Million), by Country 2024 & 2032
- Figure 16: South America Furfural Solvent Industry Volume (K Tons), by Country 2024 & 2032
- Figure 17: South America Furfural Solvent Industry Revenue Share (%), by Country 2024 & 2032
- Figure 18: South America Furfural Solvent Industry Volume Share (%), by Country 2024 & 2032
- Figure 19: MEA Furfural Solvent Industry Revenue (Million), by Country 2024 & 2032
- Figure 20: MEA Furfural Solvent Industry Volume (K Tons), by Country 2024 & 2032
- Figure 21: MEA Furfural Solvent Industry Revenue Share (%), by Country 2024 & 2032
- Figure 22: MEA Furfural Solvent Industry Volume Share (%), by Country 2024 & 2032
- Figure 23: Asia Pacific Furfural Solvent Industry Revenue (Million), by End-user Industry 2024 & 2032
- Figure 24: Asia Pacific Furfural Solvent Industry Volume (K Tons), by End-user Industry 2024 & 2032
- Figure 25: Asia Pacific Furfural Solvent Industry Revenue Share (%), by End-user Industry 2024 & 2032
- Figure 26: Asia Pacific Furfural Solvent Industry Volume Share (%), by End-user Industry 2024 & 2032
- Figure 27: Asia Pacific Furfural Solvent Industry Revenue (Million), by Country 2024 & 2032
- Figure 28: Asia Pacific Furfural Solvent Industry Volume (K Tons), by Country 2024 & 2032
- Figure 29: Asia Pacific Furfural Solvent Industry Revenue Share (%), by Country 2024 & 2032
- Figure 30: Asia Pacific Furfural Solvent Industry Volume Share (%), by Country 2024 & 2032
- Figure 31: North America Furfural Solvent Industry Revenue (Million), by End-user Industry 2024 & 2032
- Figure 32: North America Furfural Solvent Industry Volume (K Tons), by End-user Industry 2024 & 2032
- Figure 33: North America Furfural Solvent Industry Revenue Share (%), by End-user Industry 2024 & 2032
- Figure 34: North America Furfural Solvent Industry Volume Share (%), by End-user Industry 2024 & 2032
- Figure 35: North America Furfural Solvent Industry Revenue (Million), by Country 2024 & 2032
- Figure 36: North America Furfural Solvent Industry Volume (K Tons), by Country 2024 & 2032
- Figure 37: North America Furfural Solvent Industry Revenue Share (%), by Country 2024 & 2032
- Figure 38: North America Furfural Solvent Industry Volume Share (%), by Country 2024 & 2032
- Figure 39: Europe Furfural Solvent Industry Revenue (Million), by End-user Industry 2024 & 2032
- Figure 40: Europe Furfural Solvent Industry Volume (K Tons), by End-user Industry 2024 & 2032
- Figure 41: Europe Furfural Solvent Industry Revenue Share (%), by End-user Industry 2024 & 2032
- Figure 42: Europe Furfural Solvent Industry Volume Share (%), by End-user Industry 2024 & 2032
- Figure 43: Europe Furfural Solvent Industry Revenue (Million), by Country 2024 & 2032
- Figure 44: Europe Furfural Solvent Industry Volume (K Tons), by Country 2024 & 2032
- Figure 45: Europe Furfural Solvent Industry Revenue Share (%), by Country 2024 & 2032
- Figure 46: Europe Furfural Solvent Industry Volume Share (%), by Country 2024 & 2032
- Figure 47: South America Furfural Solvent Industry Revenue (Million), by End-user Industry 2024 & 2032
- Figure 48: South America Furfural Solvent Industry Volume (K Tons), by End-user Industry 2024 & 2032
- Figure 49: South America Furfural Solvent Industry Revenue Share (%), by End-user Industry 2024 & 2032
- Figure 50: South America Furfural Solvent Industry Volume Share (%), by End-user Industry 2024 & 2032
- Figure 51: South America Furfural Solvent Industry Revenue (Million), by Country 2024 & 2032
- Figure 52: South America Furfural Solvent Industry Volume (K Tons), by Country 2024 & 2032
- Figure 53: South America Furfural Solvent Industry Revenue Share (%), by Country 2024 & 2032
- Figure 54: South America Furfural Solvent Industry Volume Share (%), by Country 2024 & 2032
- Figure 55: Middle East and Africa Furfural Solvent Industry Revenue (Million), by End-user Industry 2024 & 2032
- Figure 56: Middle East and Africa Furfural Solvent Industry Volume (K Tons), by End-user Industry 2024 & 2032
- Figure 57: Middle East and Africa Furfural Solvent Industry Revenue Share (%), by End-user Industry 2024 & 2032
- Figure 58: Middle East and Africa Furfural Solvent Industry Volume Share (%), by End-user Industry 2024 & 2032
- Figure 59: Middle East and Africa Furfural Solvent Industry Revenue (Million), by Country 2024 & 2032
- Figure 60: Middle East and Africa Furfural Solvent Industry Volume (K Tons), by Country 2024 & 2032
- Figure 61: Middle East and Africa Furfural Solvent Industry Revenue Share (%), by Country 2024 & 2032
- Figure 62: Middle East and Africa Furfural Solvent Industry Volume Share (%), by Country 2024 & 2032
List of Tables
- Table 1: Global Furfural Solvent Industry Revenue Million Forecast, by Region 2019 & 2032
- Table 2: Global Furfural Solvent Industry Volume K Tons Forecast, by Region 2019 & 2032
- Table 3: Global Furfural Solvent Industry Revenue Million Forecast, by End-user Industry 2019 & 2032
- Table 4: Global Furfural Solvent Industry Volume K Tons Forecast, by End-user Industry 2019 & 2032
- Table 5: Global Furfural Solvent Industry Revenue Million Forecast, by Region 2019 & 2032
- Table 6: Global Furfural Solvent Industry Volume K Tons Forecast, by Region 2019 & 2032
- Table 7: Global Furfural Solvent Industry Revenue Million Forecast, by Country 2019 & 2032
- Table 8: Global Furfural Solvent Industry Volume K Tons Forecast, by Country 2019 & 2032
- Table 9: United States Furfural Solvent Industry Revenue (Million) Forecast, by Application 2019 & 2032
- Table 10: United States Furfural Solvent Industry Volume (K Tons) Forecast, by Application 2019 & 2032
- Table 11: Mexico Furfural Solvent Industry Revenue (Million) Forecast, by Application 2019 & 2032
- Table 12: Mexico Furfural Solvent Industry Volume (K Tons) Forecast, by Application 2019 & 2032
- Table 13: Canada Furfural Solvent Industry Revenue (Million) Forecast, by Application 2019 & 2032
- Table 14: Canada Furfural Solvent Industry Volume (K Tons) Forecast, by Application 2019 & 2032
- Table 15: Global Furfural Solvent Industry Revenue Million Forecast, by Country 2019 & 2032
- Table 16: Global Furfural Solvent Industry Volume K Tons Forecast, by Country 2019 & 2032
- Table 17: Germany Furfural Solvent Industry Revenue (Million) Forecast, by Application 2019 & 2032
- Table 18: Germany Furfural Solvent Industry Volume (K Tons) Forecast, by Application 2019 & 2032
- Table 19: France Furfural Solvent Industry Revenue (Million) Forecast, by Application 2019 & 2032
- Table 20: France Furfural Solvent Industry Volume (K Tons) Forecast, by Application 2019 & 2032
- Table 21: Italy Furfural Solvent Industry Revenue (Million) Forecast, by Application 2019 & 2032
- Table 22: Italy Furfural Solvent Industry Volume (K Tons) Forecast, by Application 2019 & 2032
- Table 23: United Kingdom Furfural Solvent Industry Revenue (Million) Forecast, by Application 2019 & 2032
- Table 24: United Kingdom Furfural Solvent Industry Volume (K Tons) Forecast, by Application 2019 & 2032
- Table 25: Netherlands Furfural Solvent Industry Revenue (Million) Forecast, by Application 2019 & 2032
- Table 26: Netherlands Furfural Solvent Industry Volume (K Tons) Forecast, by Application 2019 & 2032
- Table 27: Rest of Europe Furfural Solvent Industry Revenue (Million) Forecast, by Application 2019 & 2032
- Table 28: Rest of Europe Furfural Solvent Industry Volume (K Tons) Forecast, by Application 2019 & 2032
- Table 29: Global Furfural Solvent Industry Revenue Million Forecast, by Country 2019 & 2032
- Table 30: Global Furfural Solvent Industry Volume K Tons Forecast, by Country 2019 & 2032
- Table 31: China Furfural Solvent Industry Revenue (Million) Forecast, by Application 2019 & 2032
- Table 32: China Furfural Solvent Industry Volume (K Tons) Forecast, by Application 2019 & 2032
- Table 33: Japan Furfural Solvent Industry Revenue (Million) Forecast, by Application 2019 & 2032
- Table 34: Japan Furfural Solvent Industry Volume (K Tons) Forecast, by Application 2019 & 2032
- Table 35: India Furfural Solvent Industry Revenue (Million) Forecast, by Application 2019 & 2032
- Table 36: India Furfural Solvent Industry Volume (K Tons) Forecast, by Application 2019 & 2032
- Table 37: South Korea Furfural Solvent Industry Revenue (Million) Forecast, by Application 2019 & 2032
- Table 38: South Korea Furfural Solvent Industry Volume (K Tons) Forecast, by Application 2019 & 2032
- Table 39: Taiwan Furfural Solvent Industry Revenue (Million) Forecast, by Application 2019 & 2032
- Table 40: Taiwan Furfural Solvent Industry Volume (K Tons) Forecast, by Application 2019 & 2032
- Table 41: Australia Furfural Solvent Industry Revenue (Million) Forecast, by Application 2019 & 2032
- Table 42: Australia Furfural Solvent Industry Volume (K Tons) Forecast, by Application 2019 & 2032
- Table 43: Rest of Asia-Pacific Furfural Solvent Industry Revenue (Million) Forecast, by Application 2019 & 2032
- Table 44: Rest of Asia-Pacific Furfural Solvent Industry Volume (K Tons) Forecast, by Application 2019 & 2032
- Table 45: Global Furfural Solvent Industry Revenue Million Forecast, by Country 2019 & 2032
- Table 46: Global Furfural Solvent Industry Volume K Tons Forecast, by Country 2019 & 2032
- Table 47: Brazil Furfural Solvent Industry Revenue (Million) Forecast, by Application 2019 & 2032
- Table 48: Brazil Furfural Solvent Industry Volume (K Tons) Forecast, by Application 2019 & 2032
- Table 49: Argentina Furfural Solvent Industry Revenue (Million) Forecast, by Application 2019 & 2032
- Table 50: Argentina Furfural Solvent Industry Volume (K Tons) Forecast, by Application 2019 & 2032
- Table 51: Rest of South America Furfural Solvent Industry Revenue (Million) Forecast, by Application 2019 & 2032
- Table 52: Rest of South America Furfural Solvent Industry Volume (K Tons) Forecast, by Application 2019 & 2032
- Table 53: Global Furfural Solvent Industry Revenue Million Forecast, by Country 2019 & 2032
- Table 54: Global Furfural Solvent Industry Volume K Tons Forecast, by Country 2019 & 2032
- Table 55: Middle East Furfural Solvent Industry Revenue (Million) Forecast, by Application 2019 & 2032
- Table 56: Middle East Furfural Solvent Industry Volume (K Tons) Forecast, by Application 2019 & 2032
- Table 57: Africa Furfural Solvent Industry Revenue (Million) Forecast, by Application 2019 & 2032
- Table 58: Africa Furfural Solvent Industry Volume (K Tons) Forecast, by Application 2019 & 2032
- Table 59: Global Furfural Solvent Industry Revenue Million Forecast, by End-user Industry 2019 & 2032
- Table 60: Global Furfural Solvent Industry Volume K Tons Forecast, by End-user Industry 2019 & 2032
- Table 61: Global Furfural Solvent Industry Revenue Million Forecast, by Country 2019 & 2032
- Table 62: Global Furfural Solvent Industry Volume K Tons Forecast, by Country 2019 & 2032
- Table 63: China Furfural Solvent Industry Revenue (Million) Forecast, by Application 2019 & 2032
- Table 64: China Furfural Solvent Industry Volume (K Tons) Forecast, by Application 2019 & 2032
- Table 65: India Furfural Solvent Industry Revenue (Million) Forecast, by Application 2019 & 2032
- Table 66: India Furfural Solvent Industry Volume (K Tons) Forecast, by Application 2019 & 2032
- Table 67: Japan Furfural Solvent Industry Revenue (Million) Forecast, by Application 2019 & 2032
- Table 68: Japan Furfural Solvent Industry Volume (K Tons) Forecast, by Application 2019 & 2032
- Table 69: South Korea Furfural Solvent Industry Revenue (Million) Forecast, by Application 2019 & 2032
- Table 70: South Korea Furfural Solvent Industry Volume (K Tons) Forecast, by Application 2019 & 2032
- Table 71: Rest of Asia Pacific Furfural Solvent Industry Revenue (Million) Forecast, by Application 2019 & 2032
- Table 72: Rest of Asia Pacific Furfural Solvent Industry Volume (K Tons) Forecast, by Application 2019 & 2032
- Table 73: Global Furfural Solvent Industry Revenue Million Forecast, by End-user Industry 2019 & 2032
- Table 74: Global Furfural Solvent Industry Volume K Tons Forecast, by End-user Industry 2019 & 2032
- Table 75: Global Furfural Solvent Industry Revenue Million Forecast, by Country 2019 & 2032
- Table 76: Global Furfural Solvent Industry Volume K Tons Forecast, by Country 2019 & 2032
- Table 77: United States Furfural Solvent Industry Revenue (Million) Forecast, by Application 2019 & 2032
- Table 78: United States Furfural Solvent Industry Volume (K Tons) Forecast, by Application 2019 & 2032
- Table 79: Mexico Furfural Solvent Industry Revenue (Million) Forecast, by Application 2019 & 2032
- Table 80: Mexico Furfural Solvent Industry Volume (K Tons) Forecast, by Application 2019 & 2032
- Table 81: Canada Furfural Solvent Industry Revenue (Million) Forecast, by Application 2019 & 2032
- Table 82: Canada Furfural Solvent Industry Volume (K Tons) Forecast, by Application 2019 & 2032
- Table 83: Global Furfural Solvent Industry Revenue Million Forecast, by End-user Industry 2019 & 2032
- Table 84: Global Furfural Solvent Industry Volume K Tons Forecast, by End-user Industry 2019 & 2032
- Table 85: Global Furfural Solvent Industry Revenue Million Forecast, by Country 2019 & 2032
- Table 86: Global Furfural Solvent Industry Volume K Tons Forecast, by Country 2019 & 2032
- Table 87: Germany Furfural Solvent Industry Revenue (Million) Forecast, by Application 2019 & 2032
- Table 88: Germany Furfural Solvent Industry Volume (K Tons) Forecast, by Application 2019 & 2032
- Table 89: United Kingdom Furfural Solvent Industry Revenue (Million) Forecast, by Application 2019 & 2032
- Table 90: United Kingdom Furfural Solvent Industry Volume (K Tons) Forecast, by Application 2019 & 2032
- Table 91: Italy Furfural Solvent Industry Revenue (Million) Forecast, by Application 2019 & 2032
- Table 92: Italy Furfural Solvent Industry Volume (K Tons) Forecast, by Application 2019 & 2032
- Table 93: France Furfural Solvent Industry Revenue (Million) Forecast, by Application 2019 & 2032
- Table 94: France Furfural Solvent Industry Volume (K Tons) Forecast, by Application 2019 & 2032
- Table 95: Rest of Europe Furfural Solvent Industry Revenue (Million) Forecast, by Application 2019 & 2032
- Table 96: Rest of Europe Furfural Solvent Industry Volume (K Tons) Forecast, by Application 2019 & 2032
- Table 97: Global Furfural Solvent Industry Revenue Million Forecast, by End-user Industry 2019 & 2032
- Table 98: Global Furfural Solvent Industry Volume K Tons Forecast, by End-user Industry 2019 & 2032
- Table 99: Global Furfural Solvent Industry Revenue Million Forecast, by Country 2019 & 2032
- Table 100: Global Furfural Solvent Industry Volume K Tons Forecast, by Country 2019 & 2032
- Table 101: Brazil Furfural Solvent Industry Revenue (Million) Forecast, by Application 2019 & 2032
- Table 102: Brazil Furfural Solvent Industry Volume (K Tons) Forecast, by Application 2019 & 2032
- Table 103: Argentina Furfural Solvent Industry Revenue (Million) Forecast, by Application 2019 & 2032
- Table 104: Argentina Furfural Solvent Industry Volume (K Tons) Forecast, by Application 2019 & 2032
- Table 105: Rest of South America Furfural Solvent Industry Revenue (Million) Forecast, by Application 2019 & 2032
- Table 106: Rest of South America Furfural Solvent Industry Volume (K Tons) Forecast, by Application 2019 & 2032
- Table 107: Global Furfural Solvent Industry Revenue Million Forecast, by End-user Industry 2019 & 2032
- Table 108: Global Furfural Solvent Industry Volume K Tons Forecast, by End-user Industry 2019 & 2032
- Table 109: Global Furfural Solvent Industry Revenue Million Forecast, by Country 2019 & 2032
- Table 110: Global Furfural Solvent Industry Volume K Tons Forecast, by Country 2019 & 2032
- Table 111: Saudi Arabia Furfural Solvent Industry Revenue (Million) Forecast, by Application 2019 & 2032
- Table 112: Saudi Arabia Furfural Solvent Industry Volume (K Tons) Forecast, by Application 2019 & 2032
- Table 113: South Africa Furfural Solvent Industry Revenue (Million) Forecast, by Application 2019 & 2032
- Table 114: South Africa Furfural Solvent Industry Volume (K Tons) Forecast, by Application 2019 & 2032
- Table 115: Rest of Middle East and Africa Furfural Solvent Industry Revenue (Million) Forecast, by Application 2019 & 2032
- Table 116: Rest of Middle East and Africa Furfural Solvent Industry Volume (K Tons) Forecast, by Application 2019 & 2032
Frequently Asked Questions
1. What is the projected Compound Annual Growth Rate (CAGR) of the Furfural Solvent Industry?
The projected CAGR is approximately 5.00%.
2. Which companies are prominent players in the Furfural Solvent Industry?
Key companies in the market include Silvateam SpA, ILLOVO SUGAR AFRICA (PTY) LTD, Xing Tai Chunlei Furfural Alcohol Ltd, Harborchem, The Good Scents, Furfural Espanol SA, Alchem Chemical Co, Shandong Crownchem Industries Co Ltd, Pennakem LLC, Teijing North Furfural Co, Linzi Organic Chemical, Transfurans Chemicals, Goodrich Sugar & Chemical.
3. What are the main segments of the Furfural Solvent Industry?
The market segments include End-user Industry.
4. Can you provide details about the market size?
The market size is estimated to be USD XX Million as of 2022.
5. What are some drivers contributing to market growth?
; Non Toxicity and Low Volatile Organic Compound Content of Furfural Solvent; Other Drivers.
6. What are the notable trends driving market growth?
Increasing Demand from Agrochemicals Segment.
7. Are there any restraints impacting market growth?
; Limited Availability of Raw Material; Unfavorable Conditions Arising Due to COVID-19 Outbreak.
8. Can you provide examples of recent developments in the market?
N/A
9. What pricing options are available for accessing the report?
Pricing options include single-user, multi-user, and enterprise licenses priced at USD 4750, USD 5250, and USD 8750 respectively.
10. Is the market size provided in terms of value or volume?
The market size is provided in terms of value, measured in Million and volume, measured in K Tons.
11. Are there any specific market keywords associated with the report?
Yes, the market keyword associated with the report is "Furfural Solvent Industry," which aids in identifying and referencing the specific market segment covered.
12. How do I determine which pricing option suits my needs best?
The pricing options vary based on user requirements and access needs. Individual users may opt for single-user licenses, while businesses requiring broader access may choose multi-user or enterprise licenses for cost-effective access to the report.
13. Are there any additional resources or data provided in the Furfural Solvent Industry report?
While the report offers comprehensive insights, it's advisable to review the specific contents or supplementary materials provided to ascertain if additional resources or data are available.
14. How can I stay updated on further developments or reports in the Furfural Solvent Industry?
To stay informed about further developments, trends, and reports in the Furfural Solvent Industry, consider subscribing to industry newsletters, following relevant companies and organizations, or regularly checking reputable industry news sources and publications.
Methodology
Step 1 - Identification of Relevant Samples Size from Population Database


Step 2 - Approaches for Defining Global Market Size (Value, Volume* & Price*)

Note*: In applicable scenarios
Step 3 - Data Sources
Primary Research
- Web Analytics
- Survey Reports
- Research Institute
- Latest Research Reports
- Opinion Leaders
Secondary Research
- Annual Reports
- White Paper
- Latest Press Release
- Industry Association
- Paid Database
- Investor Presentations

Step 4 - Data Triangulation
Involves using different sources of information in order to increase the validity of a study
These sources are likely to be stakeholders in a program - participants, other researchers, program staff, other community members, and so on.
Then we put all data in single framework & apply various statistical tools to find out the dynamic on the market.
During the analysis stage, feedback from the stakeholder groups would be compared to determine areas of agreement as well as areas of divergence


