Key Insights
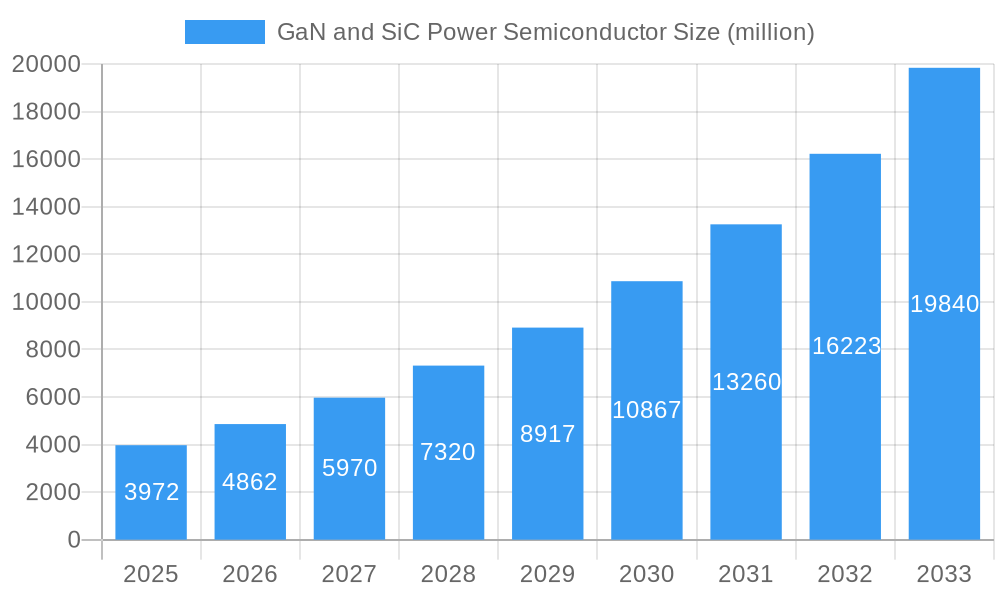
The GaN and SiC power semiconductor market is experiencing robust growth, driven by increasing demand for energy-efficient and high-power applications across various sectors. The market, valued at $3.972 billion in 2025, is projected to exhibit a compound annual growth rate (CAGR) of 22.4% from 2025 to 2033. This surge is fueled by several key factors. The automotive industry's transition to electric vehicles (EVs) and hybrid electric vehicles (HEVs) is a major catalyst, demanding high-efficiency power conversion solutions offered by GaN and SiC semiconductors. Furthermore, the burgeoning renewable energy sector, encompassing solar and wind power generation, relies heavily on these technologies for efficient power management and grid integration. Rapid advancements in power electronics, leading to smaller, lighter, and more efficient power systems, are further stimulating market expansion. The rising adoption of fast-charging technologies for consumer electronics and the increasing demand for high-power density in data centers also contribute significantly to market growth. Competition among key players like STMicroelectronics, Infineon, and Wolfspeed, amongst many others, is fostering innovation and driving down costs, making these advanced semiconductors accessible to a wider range of applications.
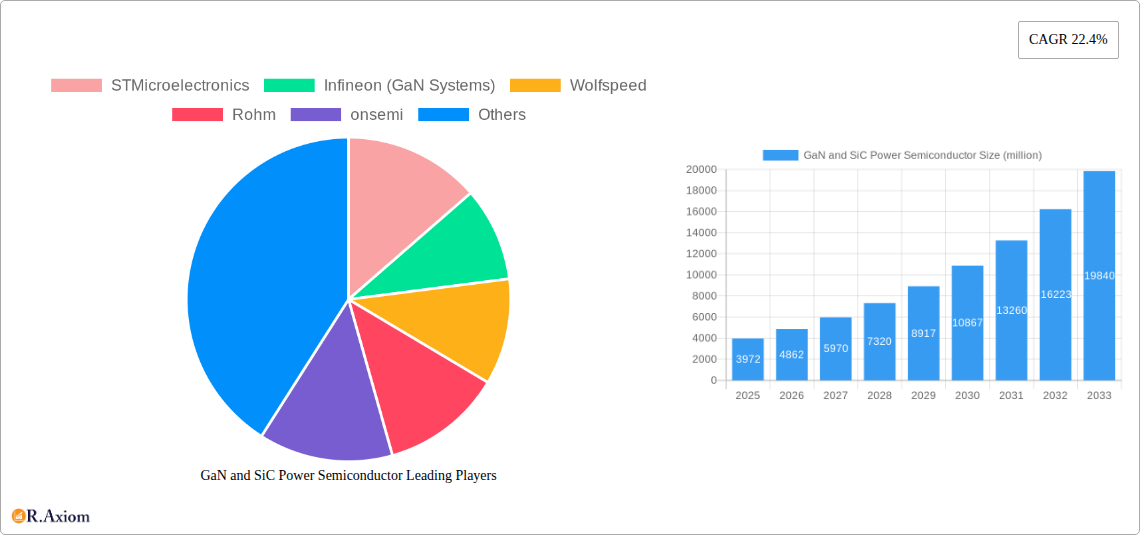
GaN and SiC Power Semiconductor Market Size (In Billion)
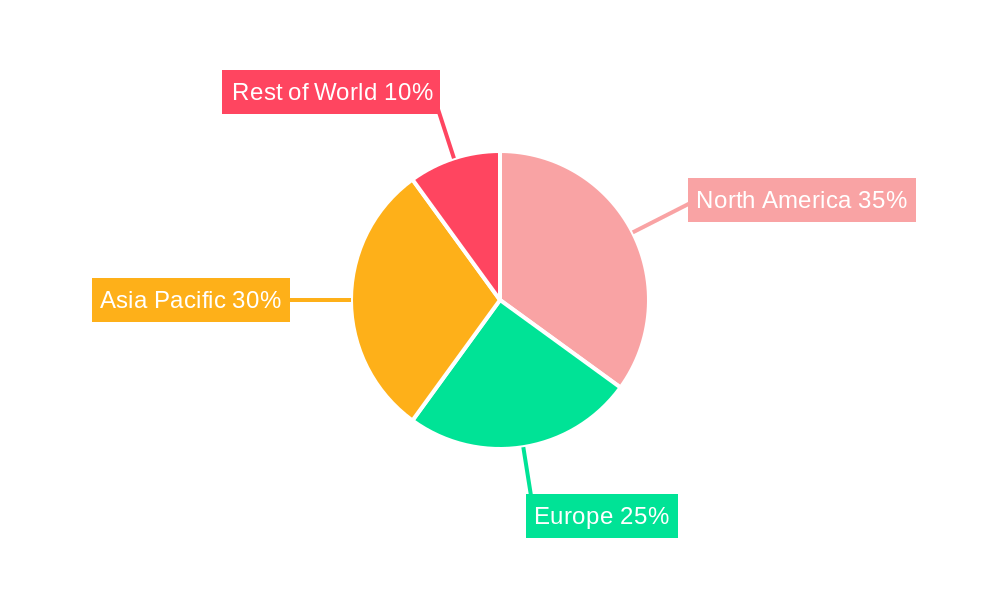
Despite the promising growth trajectory, certain restraints exist. The relatively high cost of GaN and SiC compared to traditional silicon-based semiconductors remains a barrier to wider adoption, particularly in price-sensitive markets. Furthermore, the availability of skilled labor required for designing and manufacturing these complex devices presents a challenge. However, ongoing research and development efforts are continuously addressing these limitations. Improved manufacturing processes and economies of scale are gradually reducing production costs, while educational initiatives are focused on upskilling the workforce to meet the growing demand for expertise in this field. The ongoing development of standardized design platforms and testing procedures will further facilitate wider adoption and reduce deployment costs for users. The market segmentation reflects these dynamics, with automotive, renewable energy, and consumer electronics currently driving the most significant growth. The geographical distribution of market share is likely to be influenced by factors such as the density of manufacturing facilities, technological advancements in each region and overall governmental support.
GaN and SiC Power Semiconductor Company Market Share
GaN and SiC Power Semiconductor Market Report: 2019-2033
This comprehensive report provides a detailed analysis of the GaN and SiC power semiconductor market, covering the period from 2019 to 2033. With a base year of 2025 and an estimated year of 2025, the report offers valuable insights into market trends, growth drivers, challenges, and opportunities for stakeholders. The forecast period extends to 2033, providing a long-term perspective on market evolution. This in-depth study analyzes market concentration, innovation, industry trends, dominant segments, product developments, and key players in the GaN and SiC power semiconductor landscape. The report leverages extensive data analysis to offer actionable insights for strategic decision-making. The total market size in 2025 is estimated at $xx million.
GaN and SiC Power Semiconductor Market Concentration & Innovation
The GaN and SiC power semiconductor market exhibits a moderately concentrated landscape, with a few dominant players controlling a significant portion of the market share. However, increasing innovation and the entry of new players are gradually shifting the dynamics. In 2025, the top five companies are estimated to hold approximately xx% of the market share, with STMicroelectronics, Infineon (GaN Systems), and Wolfspeed leading the pack. The market is characterized by intense R&D activity, focused on improving efficiency, power density, and cost-effectiveness. Several regulatory frameworks, including those related to energy efficiency and environmental sustainability, are driving the adoption of GaN and SiC semiconductors. Key product substitutes include traditional silicon-based power semiconductors, but the superior performance of GaN and SiC is gradually eroding their market share. End-user trends are leaning towards higher power density and efficiency, particularly in electric vehicles, renewable energy, and data centers. The past five years have witnessed significant M&A activity, with deal values totaling approximately $xx million, reflecting the strategic importance of this market.
- Top 5 Companies Market Share (2025): xx%
- Total M&A Deal Value (2019-2024): $xx million
- Key Innovation Drivers: Increased efficiency, higher power density, cost reduction.
- Regulatory Frameworks: Energy efficiency standards, environmental regulations.
GaN and SiC Power Semiconductor Industry Trends & Insights
The GaN and SiC power semiconductor market is experiencing robust growth, driven by several factors. The Compound Annual Growth Rate (CAGR) is projected to be xx% during the forecast period (2025-2033). Technological advancements such as improved material quality and manufacturing processes are significantly enhancing the performance of these semiconductors. The increasing demand for energy-efficient solutions across various sectors, including electric vehicles, renewable energy infrastructure, and data centers, is a major growth catalyst. Consumer preferences are shifting towards products with higher efficiency and smaller form factors, creating a significant demand for GaN and SiC power semiconductors. The competitive landscape is characterized by intense competition, with companies focusing on product differentiation, innovation, and strategic partnerships to gain market share. Market penetration in key application segments like electric vehicles is expected to increase from xx% in 2025 to xx% by 2033.
Dominant Markets & Segments in GaN and SiC Power Semiconductor
The Asia-Pacific region is currently the dominant market for GaN and SiC power semiconductors, driven by significant investments in renewable energy infrastructure and the rapid growth of the electric vehicle market in countries like China and Japan.
- Key Drivers in Asia-Pacific:
- Strong government support for renewable energy and electric vehicles.
- Large and growing consumer electronics market.
- Established manufacturing base.
- Dominance Analysis: The region's dominance stems from a combination of factors including favorable government policies, a robust manufacturing ecosystem, and strong demand from key application sectors. The region is expected to maintain its leadership position throughout the forecast period. Europe and North America are also significant markets exhibiting steady growth.
GaN and SiC Power Semiconductor Product Developments
Recent product innovations focus on improving switching speeds, reducing on-resistance, and enhancing thermal management. New applications are emerging in areas such as high-speed charging, solar inverters, and power supplies for data centers. The competitive advantage lies in offering superior performance, reliability, and cost-effectiveness compared to traditional silicon-based solutions. The trend towards higher voltage and current ratings is evident, enabling the adoption of GaN and SiC in high-power applications.
Report Scope & Segmentation Analysis
This report segments the GaN and SiC power semiconductor market based on several factors, including device type (MOSFETs, IGBTs, diodes), application (electric vehicles, renewable energy, industrial automation, consumer electronics, data centers), and region (North America, Europe, Asia-Pacific, Rest of the World). Each segment's growth projections, market sizes, and competitive dynamics are analyzed in detail. The market for electric vehicle applications is projected to grow at the fastest rate.
Key Drivers of GaN and SiC Power Semiconductor Growth
The key drivers of GaN and SiC power semiconductor growth include technological advancements resulting in higher efficiency and power density, increasing demand for energy-efficient solutions across diverse industries, government incentives promoting the adoption of renewable energy technologies and electric vehicles, and the growing need for smaller and lighter electronic devices. Stringent environmental regulations also play a significant role.
Challenges in the GaN and SiC Power Semiconductor Sector
The GaN and SiC power semiconductor sector faces challenges such as high manufacturing costs, supply chain disruptions, and intense competition. Regulatory hurdles related to standardization and safety compliance can also hinder market penetration. The availability of skilled labor is also a constraint. These factors collectively impact the overall market growth and profitability.
Emerging Opportunities in GaN and SiC Power Semiconductor
Emerging opportunities lie in the expansion of GaN and SiC applications in new sectors like 5G infrastructure, aerospace, and medical devices. Developments in packaging technologies and improved thermal management solutions are creating new possibilities. The growing demand for fast charging solutions in consumer electronics presents a significant opportunity for market expansion.
Leading Players in the GaN and SiC Power Semiconductor Market
- STMicroelectronics
- Infineon (GaN Systems)
- Wolfspeed
- Rohm
- onsemi
- Sumitomo Electric Device Innovations (SEDI)
- Qorvo
- NXP
- Power Integrations, Inc.
- Navitas (GeneSiC)
- Efficient Power Conversion Corporation (EPC)
- Innoscience
- BYD Semiconductor
- Renesas Electronics (Transphorm)
- Microchip (Microsemi)
- Mitsubishi Electric (Vincotech)
- Semikron Danfoss
- Fuji Electric
- Toshiba
- Bosch
- San'an Optoelectronics
- Littelfuse (IXYS)
- CETC 55
- WeEn Semiconductors
- BASiC Semiconductor
- SemiQ
- Diodes Incorporated
- SanRex
- Alpha & Omega Semiconductor
- United Nova Technology
- KEC Corporation
- PANJIT Group
- Nexperia
- Vishay Intertechnology
- Zhuzhou CRRC Times Electric
- China Resources Microelectronics Limited
- StarPower
- Yangzhou Yangjie Electronic Technology
- Guangdong AccoPower Semiconductor
- Changzhou Galaxy Century Microelectronics
- Hangzhou Silan Microelectronics
- Cissoid
- SK powertech
- InventChip Technology
- Hebei Sinopack Electronic Technology
- Oriental Semiconductor
- Jilin Sino-Microelectronics
- PN Junction Semiconductor (Hangzhou)
Key Developments in GaN and SiC Power Semiconductor Industry
- 2022 Q4: STMicroelectronics announced a significant expansion of its GaN production capacity.
- 2023 Q1: Wolfspeed launched a new generation of SiC MOSFETs with improved performance.
- 2023 Q2: Infineon acquired a smaller GaN semiconductor company (example).
- 2024 Q3: A major automotive manufacturer announced the adoption of GaN power semiconductors in its next-generation electric vehicle. (Further details needed)
Strategic Outlook for GaN and SiC Power Semiconductor Market
The GaN and SiC power semiconductor market is poised for sustained growth, driven by the increasing adoption of these technologies in electric vehicles, renewable energy, and other high-growth sectors. Continued innovation in material science, manufacturing processes, and packaging technologies will further enhance the performance and cost-effectiveness of GaN and SiC devices. The market is expected to witness consolidation through mergers and acquisitions, leading to a more concentrated landscape. The long-term growth prospects are positive, with significant opportunities for players who can effectively address the challenges and capitalize on the emerging trends in the market.
GaN and SiC Power Semiconductor Segmentation
-
1. Application
- 1.1. Automotive & Mobility
- 1.2. EV Charging
- 1.3. Consumer Electronics
- 1.4. Industrial Motor/Drive
- 1.5. PV, Energy Storage, Wind Power
- 1.6. UPS, Data Center & Server
- 1.7. Rail Transport
- 1.8. Defense & Aerospace
- 1.9. Others
-
2. Types
- 2.1. GaN功率器件
- 2.2. SiC功率器件
GaN and SiC Power Semiconductor Segmentation By Geography
-
1. North America
- 1.1. United States
- 1.2. Canada
- 1.3. Mexico
-
2. South America
- 2.1. Brazil
- 2.2. Argentina
- 2.3. Rest of South America
-
3. Europe
- 3.1. United Kingdom
- 3.2. Germany
- 3.3. France
- 3.4. Italy
- 3.5. Spain
- 3.6. Russia
- 3.7. Benelux
- 3.8. Nordics
- 3.9. Rest of Europe
-
4. Middle East & Africa
- 4.1. Turkey
- 4.2. Israel
- 4.3. GCC
- 4.4. North Africa
- 4.5. South Africa
- 4.6. Rest of Middle East & Africa
-
5. Asia Pacific
- 5.1. China
- 5.2. India
- 5.3. Japan
- 5.4. South Korea
- 5.5. ASEAN
- 5.6. Oceania
- 5.7. Rest of Asia Pacific
GaN and SiC Power Semiconductor Regional Market Share
Geographic Coverage of GaN and SiC Power Semiconductor
GaN and SiC Power Semiconductor REPORT HIGHLIGHTS
| Aspects | Details |
|---|---|
| Study Period | 2020-2034 |
| Base Year | 2025 |
| Estimated Year | 2026 |
| Forecast Period | 2026-2034 |
| Historical Period | 2020-2025 |
| Growth Rate | CAGR of 22.4% from 2020-2034 |
| Segmentation |
|
Table of Contents
- 1. Introduction
- 1.1. Research Scope
- 1.2. Market Segmentation
- 1.3. Research Methodology
- 1.4. Definitions and Assumptions
- 2. Executive Summary
- 2.1. Introduction
- 3. Market Dynamics
- 3.1. Introduction
- 3.2. Market Drivers
- 3.3. Market Restrains
- 3.4. Market Trends
- 4. Market Factor Analysis
- 4.1. Porters Five Forces
- 4.2. Supply/Value Chain
- 4.3. PESTEL analysis
- 4.4. Market Entropy
- 4.5. Patent/Trademark Analysis
- 5. Global GaN and SiC Power Semiconductor Analysis, Insights and Forecast, 2020-2032
- 5.1. Market Analysis, Insights and Forecast - by Application
- 5.1.1. Automotive & Mobility
- 5.1.2. EV Charging
- 5.1.3. Consumer Electronics
- 5.1.4. Industrial Motor/Drive
- 5.1.5. PV, Energy Storage, Wind Power
- 5.1.6. UPS, Data Center & Server
- 5.1.7. Rail Transport
- 5.1.8. Defense & Aerospace
- 5.1.9. Others
- 5.2. Market Analysis, Insights and Forecast - by Types
- 5.2.1. GaN功率器件
- 5.2.2. SiC功率器件
- 5.3. Market Analysis, Insights and Forecast - by Region
- 5.3.1. North America
- 5.3.2. South America
- 5.3.3. Europe
- 5.3.4. Middle East & Africa
- 5.3.5. Asia Pacific
- 5.1. Market Analysis, Insights and Forecast - by Application
- 6. North America GaN and SiC Power Semiconductor Analysis, Insights and Forecast, 2020-2032
- 6.1. Market Analysis, Insights and Forecast - by Application
- 6.1.1. Automotive & Mobility
- 6.1.2. EV Charging
- 6.1.3. Consumer Electronics
- 6.1.4. Industrial Motor/Drive
- 6.1.5. PV, Energy Storage, Wind Power
- 6.1.6. UPS, Data Center & Server
- 6.1.7. Rail Transport
- 6.1.8. Defense & Aerospace
- 6.1.9. Others
- 6.2. Market Analysis, Insights and Forecast - by Types
- 6.2.1. GaN功率器件
- 6.2.2. SiC功率器件
- 6.1. Market Analysis, Insights and Forecast - by Application
- 7. South America GaN and SiC Power Semiconductor Analysis, Insights and Forecast, 2020-2032
- 7.1. Market Analysis, Insights and Forecast - by Application
- 7.1.1. Automotive & Mobility
- 7.1.2. EV Charging
- 7.1.3. Consumer Electronics
- 7.1.4. Industrial Motor/Drive
- 7.1.5. PV, Energy Storage, Wind Power
- 7.1.6. UPS, Data Center & Server
- 7.1.7. Rail Transport
- 7.1.8. Defense & Aerospace
- 7.1.9. Others
- 7.2. Market Analysis, Insights and Forecast - by Types
- 7.2.1. GaN功率器件
- 7.2.2. SiC功率器件
- 7.1. Market Analysis, Insights and Forecast - by Application
- 8. Europe GaN and SiC Power Semiconductor Analysis, Insights and Forecast, 2020-2032
- 8.1. Market Analysis, Insights and Forecast - by Application
- 8.1.1. Automotive & Mobility
- 8.1.2. EV Charging
- 8.1.3. Consumer Electronics
- 8.1.4. Industrial Motor/Drive
- 8.1.5. PV, Energy Storage, Wind Power
- 8.1.6. UPS, Data Center & Server
- 8.1.7. Rail Transport
- 8.1.8. Defense & Aerospace
- 8.1.9. Others
- 8.2. Market Analysis, Insights and Forecast - by Types
- 8.2.1. GaN功率器件
- 8.2.2. SiC功率器件
- 8.1. Market Analysis, Insights and Forecast - by Application
- 9. Middle East & Africa GaN and SiC Power Semiconductor Analysis, Insights and Forecast, 2020-2032
- 9.1. Market Analysis, Insights and Forecast - by Application
- 9.1.1. Automotive & Mobility
- 9.1.2. EV Charging
- 9.1.3. Consumer Electronics
- 9.1.4. Industrial Motor/Drive
- 9.1.5. PV, Energy Storage, Wind Power
- 9.1.6. UPS, Data Center & Server
- 9.1.7. Rail Transport
- 9.1.8. Defense & Aerospace
- 9.1.9. Others
- 9.2. Market Analysis, Insights and Forecast - by Types
- 9.2.1. GaN功率器件
- 9.2.2. SiC功率器件
- 9.1. Market Analysis, Insights and Forecast - by Application
- 10. Asia Pacific GaN and SiC Power Semiconductor Analysis, Insights and Forecast, 2020-2032
- 10.1. Market Analysis, Insights and Forecast - by Application
- 10.1.1. Automotive & Mobility
- 10.1.2. EV Charging
- 10.1.3. Consumer Electronics
- 10.1.4. Industrial Motor/Drive
- 10.1.5. PV, Energy Storage, Wind Power
- 10.1.6. UPS, Data Center & Server
- 10.1.7. Rail Transport
- 10.1.8. Defense & Aerospace
- 10.1.9. Others
- 10.2. Market Analysis, Insights and Forecast - by Types
- 10.2.1. GaN功率器件
- 10.2.2. SiC功率器件
- 10.1. Market Analysis, Insights and Forecast - by Application
- 11. Competitive Analysis
- 11.1. Global Market Share Analysis 2025
- 11.2. Company Profiles
- 11.2.1 STMicroelectronics
- 11.2.1.1. Overview
- 11.2.1.2. Products
- 11.2.1.3. SWOT Analysis
- 11.2.1.4. Recent Developments
- 11.2.1.5. Financials (Based on Availability)
- 11.2.2 Infineon (GaN Systems)
- 11.2.2.1. Overview
- 11.2.2.2. Products
- 11.2.2.3. SWOT Analysis
- 11.2.2.4. Recent Developments
- 11.2.2.5. Financials (Based on Availability)
- 11.2.3 Wolfspeed
- 11.2.3.1. Overview
- 11.2.3.2. Products
- 11.2.3.3. SWOT Analysis
- 11.2.3.4. Recent Developments
- 11.2.3.5. Financials (Based on Availability)
- 11.2.4 Rohm
- 11.2.4.1. Overview
- 11.2.4.2. Products
- 11.2.4.3. SWOT Analysis
- 11.2.4.4. Recent Developments
- 11.2.4.5. Financials (Based on Availability)
- 11.2.5 onsemi
- 11.2.5.1. Overview
- 11.2.5.2. Products
- 11.2.5.3. SWOT Analysis
- 11.2.5.4. Recent Developments
- 11.2.5.5. Financials (Based on Availability)
- 11.2.6 Sumitomo Electric Device Innovations (SEDI)
- 11.2.6.1. Overview
- 11.2.6.2. Products
- 11.2.6.3. SWOT Analysis
- 11.2.6.4. Recent Developments
- 11.2.6.5. Financials (Based on Availability)
- 11.2.7 Qorvo
- 11.2.7.1. Overview
- 11.2.7.2. Products
- 11.2.7.3. SWOT Analysis
- 11.2.7.4. Recent Developments
- 11.2.7.5. Financials (Based on Availability)
- 11.2.8 NXP
- 11.2.8.1. Overview
- 11.2.8.2. Products
- 11.2.8.3. SWOT Analysis
- 11.2.8.4. Recent Developments
- 11.2.8.5. Financials (Based on Availability)
- 11.2.9 Power Integrations
- 11.2.9.1. Overview
- 11.2.9.2. Products
- 11.2.9.3. SWOT Analysis
- 11.2.9.4. Recent Developments
- 11.2.9.5. Financials (Based on Availability)
- 11.2.10 Inc.
- 11.2.10.1. Overview
- 11.2.10.2. Products
- 11.2.10.3. SWOT Analysis
- 11.2.10.4. Recent Developments
- 11.2.10.5. Financials (Based on Availability)
- 11.2.11 Navitas (GeneSiC)
- 11.2.11.1. Overview
- 11.2.11.2. Products
- 11.2.11.3. SWOT Analysis
- 11.2.11.4. Recent Developments
- 11.2.11.5. Financials (Based on Availability)
- 11.2.12 Efficient Power Conversion Corporation (EPC)
- 11.2.12.1. Overview
- 11.2.12.2. Products
- 11.2.12.3. SWOT Analysis
- 11.2.12.4. Recent Developments
- 11.2.12.5. Financials (Based on Availability)
- 11.2.13 Innoscience
- 11.2.13.1. Overview
- 11.2.13.2. Products
- 11.2.13.3. SWOT Analysis
- 11.2.13.4. Recent Developments
- 11.2.13.5. Financials (Based on Availability)
- 11.2.14 BYD Semiconductor
- 11.2.14.1. Overview
- 11.2.14.2. Products
- 11.2.14.3. SWOT Analysis
- 11.2.14.4. Recent Developments
- 11.2.14.5. Financials (Based on Availability)
- 11.2.15 Renesas Electronics (Transphorm)
- 11.2.15.1. Overview
- 11.2.15.2. Products
- 11.2.15.3. SWOT Analysis
- 11.2.15.4. Recent Developments
- 11.2.15.5. Financials (Based on Availability)
- 11.2.16 Microchip (Microsemi)
- 11.2.16.1. Overview
- 11.2.16.2. Products
- 11.2.16.3. SWOT Analysis
- 11.2.16.4. Recent Developments
- 11.2.16.5. Financials (Based on Availability)
- 11.2.17 Mitsubishi Electric (Vincotech)
- 11.2.17.1. Overview
- 11.2.17.2. Products
- 11.2.17.3. SWOT Analysis
- 11.2.17.4. Recent Developments
- 11.2.17.5. Financials (Based on Availability)
- 11.2.18 Semikron Danfoss
- 11.2.18.1. Overview
- 11.2.18.2. Products
- 11.2.18.3. SWOT Analysis
- 11.2.18.4. Recent Developments
- 11.2.18.5. Financials (Based on Availability)
- 11.2.19 Fuji Electric
- 11.2.19.1. Overview
- 11.2.19.2. Products
- 11.2.19.3. SWOT Analysis
- 11.2.19.4. Recent Developments
- 11.2.19.5. Financials (Based on Availability)
- 11.2.20 Toshiba
- 11.2.20.1. Overview
- 11.2.20.2. Products
- 11.2.20.3. SWOT Analysis
- 11.2.20.4. Recent Developments
- 11.2.20.5. Financials (Based on Availability)
- 11.2.21 Bosch
- 11.2.21.1. Overview
- 11.2.21.2. Products
- 11.2.21.3. SWOT Analysis
- 11.2.21.4. Recent Developments
- 11.2.21.5. Financials (Based on Availability)
- 11.2.22 San'an Optoelectronics
- 11.2.22.1. Overview
- 11.2.22.2. Products
- 11.2.22.3. SWOT Analysis
- 11.2.22.4. Recent Developments
- 11.2.22.5. Financials (Based on Availability)
- 11.2.23 Littelfuse (IXYS)
- 11.2.23.1. Overview
- 11.2.23.2. Products
- 11.2.23.3. SWOT Analysis
- 11.2.23.4. Recent Developments
- 11.2.23.5. Financials (Based on Availability)
- 11.2.24 CETC 55
- 11.2.24.1. Overview
- 11.2.24.2. Products
- 11.2.24.3. SWOT Analysis
- 11.2.24.4. Recent Developments
- 11.2.24.5. Financials (Based on Availability)
- 11.2.25 WeEn Semiconductors
- 11.2.25.1. Overview
- 11.2.25.2. Products
- 11.2.25.3. SWOT Analysis
- 11.2.25.4. Recent Developments
- 11.2.25.5. Financials (Based on Availability)
- 11.2.26 BASiC Semiconductor
- 11.2.26.1. Overview
- 11.2.26.2. Products
- 11.2.26.3. SWOT Analysis
- 11.2.26.4. Recent Developments
- 11.2.26.5. Financials (Based on Availability)
- 11.2.27 SemiQ
- 11.2.27.1. Overview
- 11.2.27.2. Products
- 11.2.27.3. SWOT Analysis
- 11.2.27.4. Recent Developments
- 11.2.27.5. Financials (Based on Availability)
- 11.2.28 Diodes Incorporated
- 11.2.28.1. Overview
- 11.2.28.2. Products
- 11.2.28.3. SWOT Analysis
- 11.2.28.4. Recent Developments
- 11.2.28.5. Financials (Based on Availability)
- 11.2.29 SanRex
- 11.2.29.1. Overview
- 11.2.29.2. Products
- 11.2.29.3. SWOT Analysis
- 11.2.29.4. Recent Developments
- 11.2.29.5. Financials (Based on Availability)
- 11.2.30 Alpha & Omega Semiconductor
- 11.2.30.1. Overview
- 11.2.30.2. Products
- 11.2.30.3. SWOT Analysis
- 11.2.30.4. Recent Developments
- 11.2.30.5. Financials (Based on Availability)
- 11.2.31 United Nova Technology
- 11.2.31.1. Overview
- 11.2.31.2. Products
- 11.2.31.3. SWOT Analysis
- 11.2.31.4. Recent Developments
- 11.2.31.5. Financials (Based on Availability)
- 11.2.32 KEC Corporation
- 11.2.32.1. Overview
- 11.2.32.2. Products
- 11.2.32.3. SWOT Analysis
- 11.2.32.4. Recent Developments
- 11.2.32.5. Financials (Based on Availability)
- 11.2.33 PANJIT Group
- 11.2.33.1. Overview
- 11.2.33.2. Products
- 11.2.33.3. SWOT Analysis
- 11.2.33.4. Recent Developments
- 11.2.33.5. Financials (Based on Availability)
- 11.2.34 Nexperia
- 11.2.34.1. Overview
- 11.2.34.2. Products
- 11.2.34.3. SWOT Analysis
- 11.2.34.4. Recent Developments
- 11.2.34.5. Financials (Based on Availability)
- 11.2.35 Vishay Intertechnology
- 11.2.35.1. Overview
- 11.2.35.2. Products
- 11.2.35.3. SWOT Analysis
- 11.2.35.4. Recent Developments
- 11.2.35.5. Financials (Based on Availability)
- 11.2.36 Zhuzhou CRRC Times Electric
- 11.2.36.1. Overview
- 11.2.36.2. Products
- 11.2.36.3. SWOT Analysis
- 11.2.36.4. Recent Developments
- 11.2.36.5. Financials (Based on Availability)
- 11.2.37 China Resources Microelectronics Limited
- 11.2.37.1. Overview
- 11.2.37.2. Products
- 11.2.37.3. SWOT Analysis
- 11.2.37.4. Recent Developments
- 11.2.37.5. Financials (Based on Availability)
- 11.2.38 StarPower
- 11.2.38.1. Overview
- 11.2.38.2. Products
- 11.2.38.3. SWOT Analysis
- 11.2.38.4. Recent Developments
- 11.2.38.5. Financials (Based on Availability)
- 11.2.39 Yangzhou Yangjie Electronic Technology
- 11.2.39.1. Overview
- 11.2.39.2. Products
- 11.2.39.3. SWOT Analysis
- 11.2.39.4. Recent Developments
- 11.2.39.5. Financials (Based on Availability)
- 11.2.40 Guangdong AccoPower Semiconductor
- 11.2.40.1. Overview
- 11.2.40.2. Products
- 11.2.40.3. SWOT Analysis
- 11.2.40.4. Recent Developments
- 11.2.40.5. Financials (Based on Availability)
- 11.2.41 Changzhou Galaxy Century Microelectronics
- 11.2.41.1. Overview
- 11.2.41.2. Products
- 11.2.41.3. SWOT Analysis
- 11.2.41.4. Recent Developments
- 11.2.41.5. Financials (Based on Availability)
- 11.2.42 Hangzhou Silan Microelectronics
- 11.2.42.1. Overview
- 11.2.42.2. Products
- 11.2.42.3. SWOT Analysis
- 11.2.42.4. Recent Developments
- 11.2.42.5. Financials (Based on Availability)
- 11.2.43 Cissoid
- 11.2.43.1. Overview
- 11.2.43.2. Products
- 11.2.43.3. SWOT Analysis
- 11.2.43.4. Recent Developments
- 11.2.43.5. Financials (Based on Availability)
- 11.2.44 SK powertech
- 11.2.44.1. Overview
- 11.2.44.2. Products
- 11.2.44.3. SWOT Analysis
- 11.2.44.4. Recent Developments
- 11.2.44.5. Financials (Based on Availability)
- 11.2.45 InventChip Technology
- 11.2.45.1. Overview
- 11.2.45.2. Products
- 11.2.45.3. SWOT Analysis
- 11.2.45.4. Recent Developments
- 11.2.45.5. Financials (Based on Availability)
- 11.2.46 Hebei Sinopack Electronic Technology
- 11.2.46.1. Overview
- 11.2.46.2. Products
- 11.2.46.3. SWOT Analysis
- 11.2.46.4. Recent Developments
- 11.2.46.5. Financials (Based on Availability)
- 11.2.47 Oriental Semiconductor
- 11.2.47.1. Overview
- 11.2.47.2. Products
- 11.2.47.3. SWOT Analysis
- 11.2.47.4. Recent Developments
- 11.2.47.5. Financials (Based on Availability)
- 11.2.48 Jilin Sino-Microelectronics
- 11.2.48.1. Overview
- 11.2.48.2. Products
- 11.2.48.3. SWOT Analysis
- 11.2.48.4. Recent Developments
- 11.2.48.5. Financials (Based on Availability)
- 11.2.49 PN Junction Semiconductor (Hangzhou)
- 11.2.49.1. Overview
- 11.2.49.2. Products
- 11.2.49.3. SWOT Analysis
- 11.2.49.4. Recent Developments
- 11.2.49.5. Financials (Based on Availability)
- 11.2.1 STMicroelectronics
List of Figures
- Figure 1: Global GaN and SiC Power Semiconductor Revenue Breakdown (million, %) by Region 2025 & 2033
- Figure 2: North America GaN and SiC Power Semiconductor Revenue (million), by Application 2025 & 2033
- Figure 3: North America GaN and SiC Power Semiconductor Revenue Share (%), by Application 2025 & 2033
- Figure 4: North America GaN and SiC Power Semiconductor Revenue (million), by Types 2025 & 2033
- Figure 5: North America GaN and SiC Power Semiconductor Revenue Share (%), by Types 2025 & 2033
- Figure 6: North America GaN and SiC Power Semiconductor Revenue (million), by Country 2025 & 2033
- Figure 7: North America GaN and SiC Power Semiconductor Revenue Share (%), by Country 2025 & 2033
- Figure 8: South America GaN and SiC Power Semiconductor Revenue (million), by Application 2025 & 2033
- Figure 9: South America GaN and SiC Power Semiconductor Revenue Share (%), by Application 2025 & 2033
- Figure 10: South America GaN and SiC Power Semiconductor Revenue (million), by Types 2025 & 2033
- Figure 11: South America GaN and SiC Power Semiconductor Revenue Share (%), by Types 2025 & 2033
- Figure 12: South America GaN and SiC Power Semiconductor Revenue (million), by Country 2025 & 2033
- Figure 13: South America GaN and SiC Power Semiconductor Revenue Share (%), by Country 2025 & 2033
- Figure 14: Europe GaN and SiC Power Semiconductor Revenue (million), by Application 2025 & 2033
- Figure 15: Europe GaN and SiC Power Semiconductor Revenue Share (%), by Application 2025 & 2033
- Figure 16: Europe GaN and SiC Power Semiconductor Revenue (million), by Types 2025 & 2033
- Figure 17: Europe GaN and SiC Power Semiconductor Revenue Share (%), by Types 2025 & 2033
- Figure 18: Europe GaN and SiC Power Semiconductor Revenue (million), by Country 2025 & 2033
- Figure 19: Europe GaN and SiC Power Semiconductor Revenue Share (%), by Country 2025 & 2033
- Figure 20: Middle East & Africa GaN and SiC Power Semiconductor Revenue (million), by Application 2025 & 2033
- Figure 21: Middle East & Africa GaN and SiC Power Semiconductor Revenue Share (%), by Application 2025 & 2033
- Figure 22: Middle East & Africa GaN and SiC Power Semiconductor Revenue (million), by Types 2025 & 2033
- Figure 23: Middle East & Africa GaN and SiC Power Semiconductor Revenue Share (%), by Types 2025 & 2033
- Figure 24: Middle East & Africa GaN and SiC Power Semiconductor Revenue (million), by Country 2025 & 2033
- Figure 25: Middle East & Africa GaN and SiC Power Semiconductor Revenue Share (%), by Country 2025 & 2033
- Figure 26: Asia Pacific GaN and SiC Power Semiconductor Revenue (million), by Application 2025 & 2033
- Figure 27: Asia Pacific GaN and SiC Power Semiconductor Revenue Share (%), by Application 2025 & 2033
- Figure 28: Asia Pacific GaN and SiC Power Semiconductor Revenue (million), by Types 2025 & 2033
- Figure 29: Asia Pacific GaN and SiC Power Semiconductor Revenue Share (%), by Types 2025 & 2033
- Figure 30: Asia Pacific GaN and SiC Power Semiconductor Revenue (million), by Country 2025 & 2033
- Figure 31: Asia Pacific GaN and SiC Power Semiconductor Revenue Share (%), by Country 2025 & 2033
List of Tables
- Table 1: Global GaN and SiC Power Semiconductor Revenue million Forecast, by Application 2020 & 2033
- Table 2: Global GaN and SiC Power Semiconductor Revenue million Forecast, by Types 2020 & 2033
- Table 3: Global GaN and SiC Power Semiconductor Revenue million Forecast, by Region 2020 & 2033
- Table 4: Global GaN and SiC Power Semiconductor Revenue million Forecast, by Application 2020 & 2033
- Table 5: Global GaN and SiC Power Semiconductor Revenue million Forecast, by Types 2020 & 2033
- Table 6: Global GaN and SiC Power Semiconductor Revenue million Forecast, by Country 2020 & 2033
- Table 7: United States GaN and SiC Power Semiconductor Revenue (million) Forecast, by Application 2020 & 2033
- Table 8: Canada GaN and SiC Power Semiconductor Revenue (million) Forecast, by Application 2020 & 2033
- Table 9: Mexico GaN and SiC Power Semiconductor Revenue (million) Forecast, by Application 2020 & 2033
- Table 10: Global GaN and SiC Power Semiconductor Revenue million Forecast, by Application 2020 & 2033
- Table 11: Global GaN and SiC Power Semiconductor Revenue million Forecast, by Types 2020 & 2033
- Table 12: Global GaN and SiC Power Semiconductor Revenue million Forecast, by Country 2020 & 2033
- Table 13: Brazil GaN and SiC Power Semiconductor Revenue (million) Forecast, by Application 2020 & 2033
- Table 14: Argentina GaN and SiC Power Semiconductor Revenue (million) Forecast, by Application 2020 & 2033
- Table 15: Rest of South America GaN and SiC Power Semiconductor Revenue (million) Forecast, by Application 2020 & 2033
- Table 16: Global GaN and SiC Power Semiconductor Revenue million Forecast, by Application 2020 & 2033
- Table 17: Global GaN and SiC Power Semiconductor Revenue million Forecast, by Types 2020 & 2033
- Table 18: Global GaN and SiC Power Semiconductor Revenue million Forecast, by Country 2020 & 2033
- Table 19: United Kingdom GaN and SiC Power Semiconductor Revenue (million) Forecast, by Application 2020 & 2033
- Table 20: Germany GaN and SiC Power Semiconductor Revenue (million) Forecast, by Application 2020 & 2033
- Table 21: France GaN and SiC Power Semiconductor Revenue (million) Forecast, by Application 2020 & 2033
- Table 22: Italy GaN and SiC Power Semiconductor Revenue (million) Forecast, by Application 2020 & 2033
- Table 23: Spain GaN and SiC Power Semiconductor Revenue (million) Forecast, by Application 2020 & 2033
- Table 24: Russia GaN and SiC Power Semiconductor Revenue (million) Forecast, by Application 2020 & 2033
- Table 25: Benelux GaN and SiC Power Semiconductor Revenue (million) Forecast, by Application 2020 & 2033
- Table 26: Nordics GaN and SiC Power Semiconductor Revenue (million) Forecast, by Application 2020 & 2033
- Table 27: Rest of Europe GaN and SiC Power Semiconductor Revenue (million) Forecast, by Application 2020 & 2033
- Table 28: Global GaN and SiC Power Semiconductor Revenue million Forecast, by Application 2020 & 2033
- Table 29: Global GaN and SiC Power Semiconductor Revenue million Forecast, by Types 2020 & 2033
- Table 30: Global GaN and SiC Power Semiconductor Revenue million Forecast, by Country 2020 & 2033
- Table 31: Turkey GaN and SiC Power Semiconductor Revenue (million) Forecast, by Application 2020 & 2033
- Table 32: Israel GaN and SiC Power Semiconductor Revenue (million) Forecast, by Application 2020 & 2033
- Table 33: GCC GaN and SiC Power Semiconductor Revenue (million) Forecast, by Application 2020 & 2033
- Table 34: North Africa GaN and SiC Power Semiconductor Revenue (million) Forecast, by Application 2020 & 2033
- Table 35: South Africa GaN and SiC Power Semiconductor Revenue (million) Forecast, by Application 2020 & 2033
- Table 36: Rest of Middle East & Africa GaN and SiC Power Semiconductor Revenue (million) Forecast, by Application 2020 & 2033
- Table 37: Global GaN and SiC Power Semiconductor Revenue million Forecast, by Application 2020 & 2033
- Table 38: Global GaN and SiC Power Semiconductor Revenue million Forecast, by Types 2020 & 2033
- Table 39: Global GaN and SiC Power Semiconductor Revenue million Forecast, by Country 2020 & 2033
- Table 40: China GaN and SiC Power Semiconductor Revenue (million) Forecast, by Application 2020 & 2033
- Table 41: India GaN and SiC Power Semiconductor Revenue (million) Forecast, by Application 2020 & 2033
- Table 42: Japan GaN and SiC Power Semiconductor Revenue (million) Forecast, by Application 2020 & 2033
- Table 43: South Korea GaN and SiC Power Semiconductor Revenue (million) Forecast, by Application 2020 & 2033
- Table 44: ASEAN GaN and SiC Power Semiconductor Revenue (million) Forecast, by Application 2020 & 2033
- Table 45: Oceania GaN and SiC Power Semiconductor Revenue (million) Forecast, by Application 2020 & 2033
- Table 46: Rest of Asia Pacific GaN and SiC Power Semiconductor Revenue (million) Forecast, by Application 2020 & 2033
Frequently Asked Questions
1. What is the projected Compound Annual Growth Rate (CAGR) of the GaN and SiC Power Semiconductor?
The projected CAGR is approximately 22.4%.
2. Which companies are prominent players in the GaN and SiC Power Semiconductor?
Key companies in the market include STMicroelectronics, Infineon (GaN Systems), Wolfspeed, Rohm, onsemi, Sumitomo Electric Device Innovations (SEDI), Qorvo, NXP, Power Integrations, Inc., Navitas (GeneSiC), Efficient Power Conversion Corporation (EPC), Innoscience, BYD Semiconductor, Renesas Electronics (Transphorm), Microchip (Microsemi), Mitsubishi Electric (Vincotech), Semikron Danfoss, Fuji Electric, Toshiba, Bosch, San'an Optoelectronics, Littelfuse (IXYS), CETC 55, WeEn Semiconductors, BASiC Semiconductor, SemiQ, Diodes Incorporated, SanRex, Alpha & Omega Semiconductor, United Nova Technology, KEC Corporation, PANJIT Group, Nexperia, Vishay Intertechnology, Zhuzhou CRRC Times Electric, China Resources Microelectronics Limited, StarPower, Yangzhou Yangjie Electronic Technology, Guangdong AccoPower Semiconductor, Changzhou Galaxy Century Microelectronics, Hangzhou Silan Microelectronics, Cissoid, SK powertech, InventChip Technology, Hebei Sinopack Electronic Technology, Oriental Semiconductor, Jilin Sino-Microelectronics, PN Junction Semiconductor (Hangzhou).
3. What are the main segments of the GaN and SiC Power Semiconductor?
The market segments include Application, Types.
4. Can you provide details about the market size?
The market size is estimated to be USD 3972 million as of 2022.
5. What are some drivers contributing to market growth?
N/A
6. What are the notable trends driving market growth?
N/A
7. Are there any restraints impacting market growth?
N/A
8. Can you provide examples of recent developments in the market?
N/A
9. What pricing options are available for accessing the report?
Pricing options include single-user, multi-user, and enterprise licenses priced at USD 2900.00, USD 4350.00, and USD 5800.00 respectively.
10. Is the market size provided in terms of value or volume?
The market size is provided in terms of value, measured in million.
11. Are there any specific market keywords associated with the report?
Yes, the market keyword associated with the report is "GaN and SiC Power Semiconductor," which aids in identifying and referencing the specific market segment covered.
12. How do I determine which pricing option suits my needs best?
The pricing options vary based on user requirements and access needs. Individual users may opt for single-user licenses, while businesses requiring broader access may choose multi-user or enterprise licenses for cost-effective access to the report.
13. Are there any additional resources or data provided in the GaN and SiC Power Semiconductor report?
While the report offers comprehensive insights, it's advisable to review the specific contents or supplementary materials provided to ascertain if additional resources or data are available.
14. How can I stay updated on further developments or reports in the GaN and SiC Power Semiconductor?
To stay informed about further developments, trends, and reports in the GaN and SiC Power Semiconductor, consider subscribing to industry newsletters, following relevant companies and organizations, or regularly checking reputable industry news sources and publications.
Methodology
Step 1 - Identification of Relevant Samples Size from Population Database


Step 2 - Approaches for Defining Global Market Size (Value, Volume* & Price*)

Note*: In applicable scenarios
Step 3 - Data Sources
Primary Research
- Web Analytics
- Survey Reports
- Research Institute
- Latest Research Reports
- Opinion Leaders
Secondary Research
- Annual Reports
- White Paper
- Latest Press Release
- Industry Association
- Paid Database
- Investor Presentations

Step 4 - Data Triangulation
Involves using different sources of information in order to increase the validity of a study
These sources are likely to be stakeholders in a program - participants, other researchers, program staff, other community members, and so on.
Then we put all data in single framework & apply various statistical tools to find out the dynamic on the market.
During the analysis stage, feedback from the stakeholder groups would be compared to determine areas of agreement as well as areas of divergence

