

Key Insights
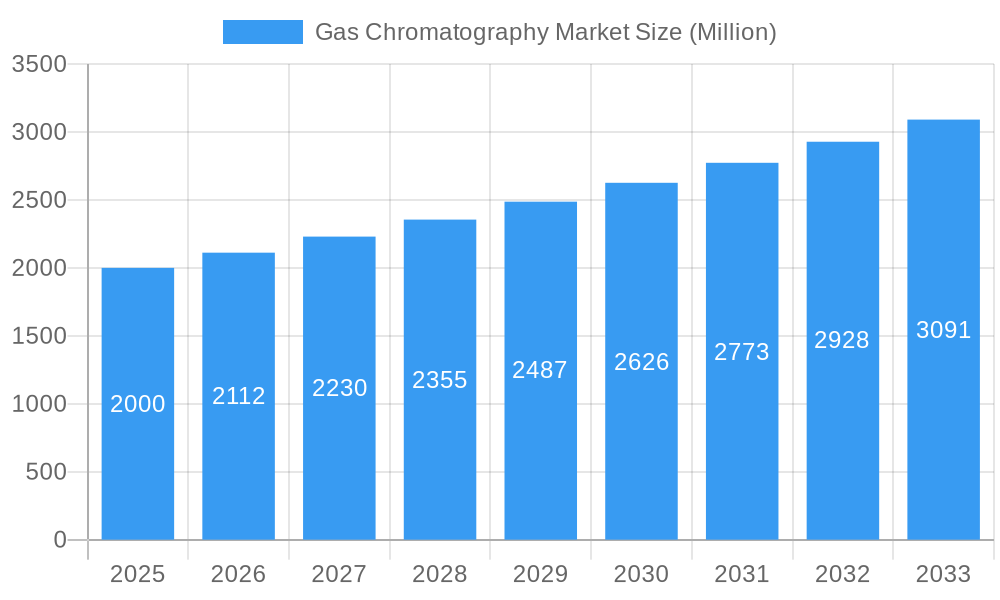
The Gas Chromatography (GC) market is projected to reach $4.43 billion by 2025, exhibiting a Compound Annual Growth Rate (CAGR) of 6.6% from 2025 to 2033. This significant growth is primarily propelled by the pharmaceutical and biopharmaceutical sectors, where GC is indispensable for quality control, drug discovery, and impurity analysis. The escalating incidence of chronic diseases fuels pharmaceutical demand, directly impacting the GC market. Academic research institutions also contribute substantially to this growth through their extensive use of GC for analytical applications. Technological advancements, including enhanced detector sensitivity (e.g., GC-MS), miniaturization for portability, and automation via auto-samplers and fraction collectors, are further accelerating market expansion. The increasing adoption of hyphenated techniques, particularly GC-MS, elevates analytical capabilities and strengthens market demand.
Gas Chromatography Market Market Size (In Billion)
Despite its robust growth, the GC market faces certain constraints. The substantial initial investment and ongoing maintenance costs for advanced GC systems can deter smaller organizations. Additionally, stringent regulatory demands for data accuracy and instrument validation present challenges for both manufacturers and users. Nevertheless, the market's outlook remains optimistic, with North America and Asia-Pacific anticipated to lead due to concentrated R&D activities and pharmaceutical manufacturing. Emerging applications in environmental monitoring and food safety will also bolster market growth throughout the forecast period (2025-2033). Intensified competition among established players and new entrants is expected to foster innovation and influence pricing dynamics.
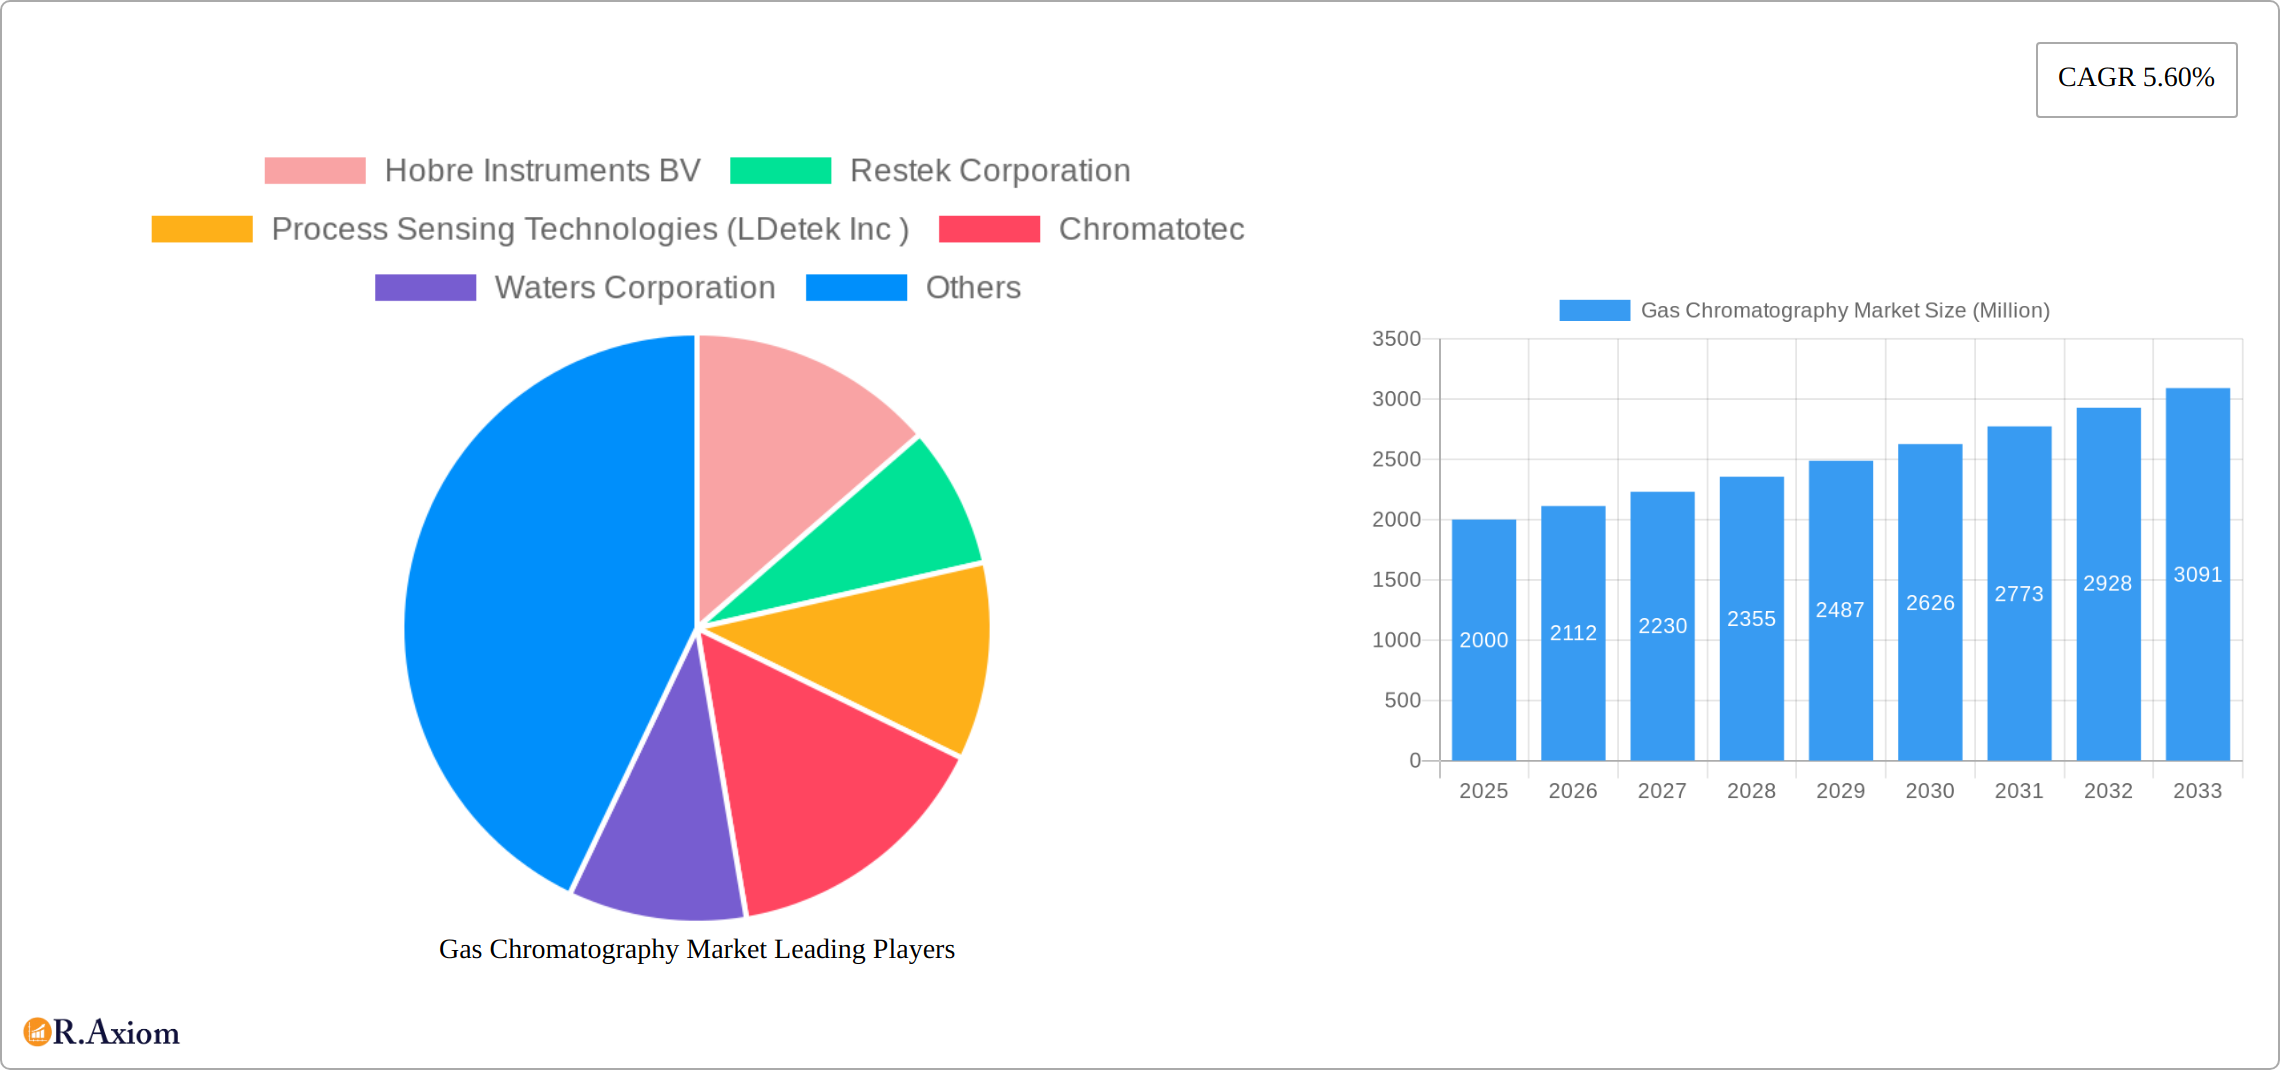
Gas Chromatography Market Company Market Share
Gas Chromatography Market: A Comprehensive Report (2019-2033)
This detailed report provides a comprehensive analysis of the Gas Chromatography market, offering actionable insights for industry stakeholders. The study period spans from 2019 to 2033, with 2025 serving as the base and estimated year. The report covers market size, segmentation, growth drivers, challenges, and key players, offering a complete overview of this dynamic market. Expected market value for 2025 is xx Million.
Gas Chromatography Market Market Concentration & Innovation
The Gas Chromatography (GC) market presents a moderately concentrated landscape, dominated by a few key players commanding significant market share. Industry giants like Agilent Technologies Inc, Thermo Fisher Scientific Inc., and Danaher Corporation are prominent examples, collectively accounting for an estimated [Insert Precise Percentage]% of the global market in 2025. However, a competitive ecosystem exists due to the presence of numerous smaller, specialized companies offering niche solutions and innovative technologies. Market share dynamics are constantly influenced by a complex interplay of factors: groundbreaking technological advancements, strategic alliances and partnerships, and mergers and acquisitions (M&A) activities.
Innovation within the GC sector is relentlessly driven by the escalating demand for faster, more sensitive, and exceptionally reliable GC systems. Key areas of focus include the miniaturization of GC instruments, the integration of advanced detectors (such as high-sensitivity mass spectrometry – MS), and the development of sophisticated software for enhanced data analysis and automation. Stringent regulatory requirements, especially within environmental monitoring and pharmaceutical quality control, significantly influence the pace of innovation and the adoption rate of new technologies. While alternative analytical techniques are emerging, the inherent advantages of GC, such as its high resolution and remarkable versatility across a wide range of applications, solidify its enduring relevance in the analytical landscape. M&A activity significantly shapes market dynamics. Deal values have ranged considerably, encompassing large acquisitions exceeding [Insert Dollar Amount] Million, alongside smaller, focused transactions concentrating on specific technologies or niche market segments. Recent M&A activity has predominantly focused on expanding product portfolios, bolstering geographical reach, and intensifying competition within the market.
Gas Chromatography Market Industry Trends & Insights
The Gas Chromatography market is experiencing robust and sustained growth, propelled by several crucial factors. The pharmaceutical and biopharmaceutical industries constitute a major market segment, fueled by stringent quality control mandates and the escalating complexity of modern drug development. Academic research institutions also contribute significantly to market demand, utilizing GC for a diverse array of analytical applications. The overall market is projected to achieve a Compound Annual Growth Rate (CAGR) of [Insert Precise Percentage]% from 2025 to 2033. Market penetration is notably expanding in emerging economies, driven by improvements in healthcare infrastructure and the growth of research capabilities in these regions. Disruptive technological advancements, such as the development of portable and miniaturized GC systems, are expanding the applications of this technology into new fields, including environmental monitoring, food safety, and forensic science. The burgeoning demand for advanced analytical techniques across numerous industries, coupled with increasing government funding for research and development initiatives, further fuels market expansion. However, price competition and the presence of alternative techniques pose ongoing challenges that require strategic navigation by market players.
Dominant Markets & Segments in Gas Chromatography Market
The North American region holds a dominant position in the Gas Chromatography market, driven by strong pharmaceutical and biotechnology sectors, robust R&D spending, and the presence of major instrument manufacturers. Within the product segment, systems constitute the largest share of the market, driven by the need for comprehensive analytical solutions.
Key Drivers for North American Dominance:
- Strong pharmaceutical and biotechnology industries
- High levels of R&D investment
- Advanced infrastructure for analytical testing
- Presence of major instrument manufacturers
Dominant Product Segment: Systems
- High demand for comprehensive analytical solutions
- Integration of various components for efficient workflow
Dominant End-User Segment: Pharmaceutical and Biopharmaceutical Industries
- Stringent quality control requirements
- Complex drug development processes
- Increasing adoption of advanced analytical tools
Gas Chromatography Market Product Developments
Recent product developments highlight a trend toward increased automation, miniaturization, and enhanced sensitivity. Companies are focusing on integrating advanced detectors, developing user-friendly software, and offering comprehensive solutions that streamline workflows. This trend reflects the increasing demands for higher throughput, improved data quality, and reduced operational costs. New applications are emerging in areas such as environmental monitoring and food safety, driven by the need for sensitive and reliable analytical tools. The competitive advantage lies in delivering innovative solutions that meet the specific needs of diverse customer segments.
Report Scope & Segmentation Analysis
This report segments the Gas Chromatography market based on product type (Systems, Detectors, Auto-samplers, Fraction Collectors, Other Products) and end-user (Pharmaceutical and Biopharmaceutical Industries, Academic Research Institutes, Other End-Users). Each segment's market size, growth projections, and competitive dynamics are analyzed in detail. The Systems segment is projected to show the highest growth, followed by Detectors. Within end-users, the pharmaceutical and biopharmaceutical sector displays the strongest growth, due to regulatory pressures and the complexity of modern drug development. The competitive landscape varies across segments, with some segments being dominated by a few major players, while others exhibit greater fragmentation.
Key Drivers of Gas Chromatography Market Growth
Several key factors are propelling the growth of the Gas Chromatography market. Significant technological advancements, including enhanced detector sensitivity, automated sample handling, and improved data processing capabilities, are significantly improving analytical performance and efficiency. The escalating demand for robust quality control and assurance across diverse industries, especially within pharmaceuticals, environmental monitoring, and food safety, is a primary driver of market growth. Supportive regulatory frameworks and government initiatives promoting scientific research and technological innovation provide a conducive environment for market expansion.
Challenges in the Gas Chromatography Market Sector
Despite its strong growth trajectory, the Gas Chromatography market faces certain challenges. High initial capital investment costs associated with advanced GC systems can pose a significant barrier to entry for smaller companies and research institutions with limited budgets. Supply chain disruptions, particularly concerning critical components and consumables, can impact the timely availability of systems and affect overall market stability. Intense competition from alternative analytical techniques, such as Liquid Chromatography-Mass Spectrometry (LC-MS), exerts downward pressure on prices and profit margins. Furthermore, the continuously evolving regulatory landscape necessitates continuous adaptation and significant investment in compliance measures to ensure ongoing market access.
Emerging Opportunities in Gas Chromatography Market
The Gas Chromatography market presents significant opportunities. The growing demand for portable and miniaturized GC systems opens up new applications in field-based analysis, such as environmental monitoring and food safety testing. The development of advanced software and data analysis tools offers opportunities to improve data interpretation and workflow efficiency. Expanding into emerging markets with growing healthcare infrastructure and research capabilities promises significant growth potential.
Leading Players in the Gas Chromatography Market Market
Key Developments in Gas Chromatography Market Industry
June 2022: PerkinElmer, Inc. launched the GC 2400 Platform, an advanced, automated gas chromatography (GC), headspace sampler, and GC-MS solution designed to help lab teams simplify lab operations, drive precise results, and perform more flexible monitoring. This launch expanded PerkinElmer's product portfolio and enhanced its competitive position in the market.
March 2022: Thermo Fisher Scientific launched a collection of new gas chromatography (GC) and GC-MS instruments offering innovative hardware and software updates. These updates improved instrument performance, usability, and data analysis capabilities, strengthening Thermo Fisher Scientific's market position.
Strategic Outlook for Gas Chromatography Market Market
The Gas Chromatography market is poised for continued growth, driven by technological advancements, increasing regulatory scrutiny, and expanding applications across various sectors. The focus on miniaturization, automation, and enhanced sensitivity will continue to shape the market landscape. Companies that invest in R&D, develop innovative solutions, and adapt to evolving regulatory requirements are expected to gain a competitive advantage. The market's future potential lies in tapping into emerging markets, developing specialized applications, and expanding into new areas such as environmental monitoring and food safety testing.
Gas Chromatography Market Segmentation
-
1. Product
- 1.1. Systems
- 1.2. Detectors
- 1.3. Auto-samplers
- 1.4. Fraction Collectors
- 1.5. Other Products
-
2. End-User
- 2.1. Pharmaceutical and Biopharmaceutical Industries
- 2.2. Academic Research Institutes
- 2.3. Other End-Users
Gas Chromatography Market Segmentation By Geography
-
1. North America
- 1.1. United States
- 1.2. Canada
- 1.3. Mexico
-
2. Europe
- 2.1. Germany
- 2.2. United Kingdom
- 2.3. France
- 2.4. Italy
- 2.5. Spain
- 2.6. Rest of Europe
-
3. Asia Pacific
- 3.1. China
- 3.2. Japan
- 3.3. India
- 3.4. Australia
- 3.5. South korea
- 3.6. Rest of Asia Pacific
-
4. Middle East and Africa
- 4.1. GCC
- 4.2. South Africa
- 4.3. Rest of Middle East and Africa
-
5. South America
- 5.1. Brazil
- 5.2. Argentina
- 5.3. Rest of South America
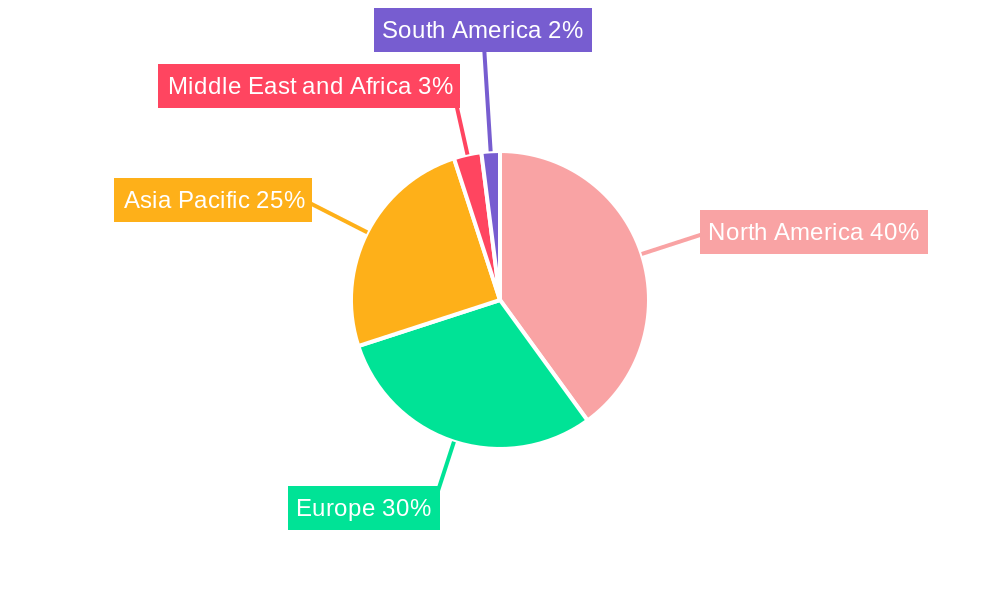
Gas Chromatography Market Regional Market Share
Geographic Coverage of Gas Chromatography Market
Gas Chromatography Market REPORT HIGHLIGHTS
| Aspects | Details |
|---|---|
| Study Period | 2020-2034 |
| Base Year | 2025 |
| Estimated Year | 2026 |
| Forecast Period | 2026-2034 |
| Historical Period | 2020-2025 |
| Growth Rate | CAGR of 6.6% from 2020-2034 |
| Segmentation |
|
Table of Contents
- 1. Introduction
- 1.1. Research Scope
- 1.2. Market Segmentation
- 1.3. Research Objective
- 1.4. Definitions and Assumptions
- 2. Executive Summary
- 2.1. Market Snapshot
- 3. Market Dynamics
- 3.1. Market Drivers
- 3.2. Market Restrains
- 3.3. Market Trends
- 3.4. Market Opportunities
- 4. Market Factor Analysis
- 4.1. Porters Five Forces
- 4.1.1. Bargaining Power of Suppliers
- 4.1.2. Bargaining Power of Buyers
- 4.1.3. Threat of New Entrants
- 4.1.4. Threat of Substitutes
- 4.1.5. Competitive Rivalry
- 4.2. PESTEL analysis
- 4.3. BCG Analysis
- 4.3.1. Stars (High Growth, High Market Share)
- 4.3.2. Cash Cows (Low Growth, High Market Share)
- 4.3.3. Question Mark (High Growth, Low Market Share)
- 4.3.4. Dogs (Low Growth, Low Market Share)
- 4.4. Ansoff Matrix Analysis
- 4.5. Supply Chain Analysis
- 4.6. Regulatory Landscape
- 4.7. Current Market Potential and Opportunity Assessment (TAM–SAM–SOM Framework)
- 4.8. RAX Analyst Note
- 4.1. Porters Five Forces
- 5. Market Analysis, Insights and Forecast 2021-2033
- 5.1. Market Analysis, Insights and Forecast - by Product
- 5.1.1. Systems
- 5.1.2. Detectors
- 5.1.3. Auto-samplers
- 5.1.4. Fraction Collectors
- 5.1.5. Other Products
- 5.2. Market Analysis, Insights and Forecast - by End-User
- 5.2.1. Pharmaceutical and Biopharmaceutical Industries
- 5.2.2. Academic Research Institutes
- 5.2.3. Other End-Users
- 5.3. Market Analysis, Insights and Forecast - by Region
- 5.3.1. North America
- 5.3.2. Europe
- 5.3.3. Asia Pacific
- 5.3.4. Middle East and Africa
- 5.3.5. South America
- 5.1. Market Analysis, Insights and Forecast - by Product
- 6. Global Gas Chromatography Market Analysis, Insights and Forecast, 2021-2033
- 6.1. Market Analysis, Insights and Forecast - by Product
- 6.1.1. Systems
- 6.1.2. Detectors
- 6.1.3. Auto-samplers
- 6.1.4. Fraction Collectors
- 6.1.5. Other Products
- 6.2. Market Analysis, Insights and Forecast - by End-User
- 6.2.1. Pharmaceutical and Biopharmaceutical Industries
- 6.2.2. Academic Research Institutes
- 6.2.3. Other End-Users
- 6.1. Market Analysis, Insights and Forecast - by Product
- 7. North America Gas Chromatography Market Analysis, Insights and Forecast, 2020-2032
- 7.1. Market Analysis, Insights and Forecast - by Product
- 7.1.1. Systems
- 7.1.2. Detectors
- 7.1.3. Auto-samplers
- 7.1.4. Fraction Collectors
- 7.1.5. Other Products
- 7.2. Market Analysis, Insights and Forecast - by End-User
- 7.2.1. Pharmaceutical and Biopharmaceutical Industries
- 7.2.2. Academic Research Institutes
- 7.2.3. Other End-Users
- 7.1. Market Analysis, Insights and Forecast - by Product
- 8. Europe Gas Chromatography Market Analysis, Insights and Forecast, 2020-2032
- 8.1. Market Analysis, Insights and Forecast - by Product
- 8.1.1. Systems
- 8.1.2. Detectors
- 8.1.3. Auto-samplers
- 8.1.4. Fraction Collectors
- 8.1.5. Other Products
- 8.2. Market Analysis, Insights and Forecast - by End-User
- 8.2.1. Pharmaceutical and Biopharmaceutical Industries
- 8.2.2. Academic Research Institutes
- 8.2.3. Other End-Users
- 8.1. Market Analysis, Insights and Forecast - by Product
- 9. Asia Pacific Gas Chromatography Market Analysis, Insights and Forecast, 2020-2032
- 9.1. Market Analysis, Insights and Forecast - by Product
- 9.1.1. Systems
- 9.1.2. Detectors
- 9.1.3. Auto-samplers
- 9.1.4. Fraction Collectors
- 9.1.5. Other Products
- 9.2. Market Analysis, Insights and Forecast - by End-User
- 9.2.1. Pharmaceutical and Biopharmaceutical Industries
- 9.2.2. Academic Research Institutes
- 9.2.3. Other End-Users
- 9.1. Market Analysis, Insights and Forecast - by Product
- 10. Middle East and Africa Gas Chromatography Market Analysis, Insights and Forecast, 2020-2032
- 10.1. Market Analysis, Insights and Forecast - by Product
- 10.1.1. Systems
- 10.1.2. Detectors
- 10.1.3. Auto-samplers
- 10.1.4. Fraction Collectors
- 10.1.5. Other Products
- 10.2. Market Analysis, Insights and Forecast - by End-User
- 10.2.1. Pharmaceutical and Biopharmaceutical Industries
- 10.2.2. Academic Research Institutes
- 10.2.3. Other End-Users
- 10.1. Market Analysis, Insights and Forecast - by Product
- 11. South America Gas Chromatography Market Analysis, Insights and Forecast, 2020-2032
- 11.1. Market Analysis, Insights and Forecast - by Product
- 11.1.1. Systems
- 11.1.2. Detectors
- 11.1.3. Auto-samplers
- 11.1.4. Fraction Collectors
- 11.1.5. Other Products
- 11.2. Market Analysis, Insights and Forecast - by End-User
- 11.2.1. Pharmaceutical and Biopharmaceutical Industries
- 11.2.2. Academic Research Institutes
- 11.2.3. Other End-Users
- 11.1. Market Analysis, Insights and Forecast - by Product
- 12. Competitive Analysis
- 12.1. Company Profiles
- 12.1.1 Hobre Instruments BV
- 12.1.1.1. Company Overview
- 12.1.1.2. Products
- 12.1.1.3. Company Financials
- 12.1.1.4. SWOT Analysis
- 12.1.2 Restek Corporation
- 12.1.2.1. Company Overview
- 12.1.2.2. Products
- 12.1.2.3. Company Financials
- 12.1.2.4. SWOT Analysis
- 12.1.3 Process Sensing Technologies (LDetek Inc )
- 12.1.3.1. Company Overview
- 12.1.3.2. Products
- 12.1.3.3. Company Financials
- 12.1.3.4. SWOT Analysis
- 12.1.4 Chromatotec
- 12.1.4.1. Company Overview
- 12.1.4.2. Products
- 12.1.4.3. Company Financials
- 12.1.4.4. SWOT Analysis
- 12.1.5 Waters Corporation
- 12.1.5.1. Company Overview
- 12.1.5.2. Products
- 12.1.5.3. Company Financials
- 12.1.5.4. SWOT Analysis
- 12.1.6 Thermo Fisher Scientific Inc
- 12.1.6.1. Company Overview
- 12.1.6.2. Products
- 12.1.6.3. Company Financials
- 12.1.6.4. SWOT Analysis
- 12.1.7 Danaher Corporation
- 12.1.7.1. Company Overview
- 12.1.7.2. Products
- 12.1.7.3. Company Financials
- 12.1.7.4. SWOT Analysis
- 12.1.8 Agilent Technologies Inc
- 12.1.8.1. Company Overview
- 12.1.8.2. Products
- 12.1.8.3. Company Financials
- 12.1.8.4. SWOT Analysis
- 12.1.9 Sartorius
- 12.1.9.1. Company Overview
- 12.1.9.2. Products
- 12.1.9.3. Company Financials
- 12.1.9.4. SWOT Analysis
- 12.1.10 Merck KgaA
- 12.1.10.1. Company Overview
- 12.1.10.2. Products
- 12.1.10.3. Company Financials
- 12.1.10.4. SWOT Analysis
- 12.1.11 PerkinElmer Inc
- 12.1.11.1. Company Overview
- 12.1.11.2. Products
- 12.1.11.3. Company Financials
- 12.1.11.4. SWOT Analysis
- 12.1.12 Scion Instruments
- 12.1.12.1. Company Overview
- 12.1.12.2. Products
- 12.1.12.3. Company Financials
- 12.1.12.4. SWOT Analysis
- 12.1.13 Air Liquide
- 12.1.13.1. Company Overview
- 12.1.13.2. Products
- 12.1.13.3. Company Financials
- 12.1.13.4. SWOT Analysis
- 12.1.14 Teledyne Technologies
- 12.1.14.1. Company Overview
- 12.1.14.2. Products
- 12.1.14.3. Company Financials
- 12.1.14.4. SWOT Analysis
- 12.1.15 Shimadzu Corporation
- 12.1.15.1. Company Overview
- 12.1.15.2. Products
- 12.1.15.3. Company Financials
- 12.1.15.4. SWOT Analysis
- 12.1.1 Hobre Instruments BV
- 12.2. Market Entropy
- 12.2.1 Company's Key Areas Served
- 12.2.2 Recent Developments
- 12.3. Company Market Share Analysis 2025
- 12.3.1 Top 5 Companies Market Share Analysis
- 12.3.2 Top 3 Companies Market Share Analysis
- 12.4. List of Potential Customers
- 13. Research Methodology
List of Figures
- Figure 1: Global Gas Chromatography Market Revenue Breakdown (billion, %) by Region 2025 & 2033
- Figure 2: Global Gas Chromatography Market Volume Breakdown (K Unit, %) by Region 2025 & 2033
- Figure 3: North America Gas Chromatography Market Revenue (billion), by Product 2025 & 2033
- Figure 4: North America Gas Chromatography Market Volume (K Unit), by Product 2025 & 2033
- Figure 5: North America Gas Chromatography Market Revenue Share (%), by Product 2025 & 2033
- Figure 6: North America Gas Chromatography Market Volume Share (%), by Product 2025 & 2033
- Figure 7: North America Gas Chromatography Market Revenue (billion), by End-User 2025 & 2033
- Figure 8: North America Gas Chromatography Market Volume (K Unit), by End-User 2025 & 2033
- Figure 9: North America Gas Chromatography Market Revenue Share (%), by End-User 2025 & 2033
- Figure 10: North America Gas Chromatography Market Volume Share (%), by End-User 2025 & 2033
- Figure 11: North America Gas Chromatography Market Revenue (billion), by Country 2025 & 2033
- Figure 12: North America Gas Chromatography Market Volume (K Unit), by Country 2025 & 2033
- Figure 13: North America Gas Chromatography Market Revenue Share (%), by Country 2025 & 2033
- Figure 14: North America Gas Chromatography Market Volume Share (%), by Country 2025 & 2033
- Figure 15: Europe Gas Chromatography Market Revenue (billion), by Product 2025 & 2033
- Figure 16: Europe Gas Chromatography Market Volume (K Unit), by Product 2025 & 2033
- Figure 17: Europe Gas Chromatography Market Revenue Share (%), by Product 2025 & 2033
- Figure 18: Europe Gas Chromatography Market Volume Share (%), by Product 2025 & 2033
- Figure 19: Europe Gas Chromatography Market Revenue (billion), by End-User 2025 & 2033
- Figure 20: Europe Gas Chromatography Market Volume (K Unit), by End-User 2025 & 2033
- Figure 21: Europe Gas Chromatography Market Revenue Share (%), by End-User 2025 & 2033
- Figure 22: Europe Gas Chromatography Market Volume Share (%), by End-User 2025 & 2033
- Figure 23: Europe Gas Chromatography Market Revenue (billion), by Country 2025 & 2033
- Figure 24: Europe Gas Chromatography Market Volume (K Unit), by Country 2025 & 2033
- Figure 25: Europe Gas Chromatography Market Revenue Share (%), by Country 2025 & 2033
- Figure 26: Europe Gas Chromatography Market Volume Share (%), by Country 2025 & 2033
- Figure 27: Asia Pacific Gas Chromatography Market Revenue (billion), by Product 2025 & 2033
- Figure 28: Asia Pacific Gas Chromatography Market Volume (K Unit), by Product 2025 & 2033
- Figure 29: Asia Pacific Gas Chromatography Market Revenue Share (%), by Product 2025 & 2033
- Figure 30: Asia Pacific Gas Chromatography Market Volume Share (%), by Product 2025 & 2033
- Figure 31: Asia Pacific Gas Chromatography Market Revenue (billion), by End-User 2025 & 2033
- Figure 32: Asia Pacific Gas Chromatography Market Volume (K Unit), by End-User 2025 & 2033
- Figure 33: Asia Pacific Gas Chromatography Market Revenue Share (%), by End-User 2025 & 2033
- Figure 34: Asia Pacific Gas Chromatography Market Volume Share (%), by End-User 2025 & 2033
- Figure 35: Asia Pacific Gas Chromatography Market Revenue (billion), by Country 2025 & 2033
- Figure 36: Asia Pacific Gas Chromatography Market Volume (K Unit), by Country 2025 & 2033
- Figure 37: Asia Pacific Gas Chromatography Market Revenue Share (%), by Country 2025 & 2033
- Figure 38: Asia Pacific Gas Chromatography Market Volume Share (%), by Country 2025 & 2033
- Figure 39: Middle East and Africa Gas Chromatography Market Revenue (billion), by Product 2025 & 2033
- Figure 40: Middle East and Africa Gas Chromatography Market Volume (K Unit), by Product 2025 & 2033
- Figure 41: Middle East and Africa Gas Chromatography Market Revenue Share (%), by Product 2025 & 2033
- Figure 42: Middle East and Africa Gas Chromatography Market Volume Share (%), by Product 2025 & 2033
- Figure 43: Middle East and Africa Gas Chromatography Market Revenue (billion), by End-User 2025 & 2033
- Figure 44: Middle East and Africa Gas Chromatography Market Volume (K Unit), by End-User 2025 & 2033
- Figure 45: Middle East and Africa Gas Chromatography Market Revenue Share (%), by End-User 2025 & 2033
- Figure 46: Middle East and Africa Gas Chromatography Market Volume Share (%), by End-User 2025 & 2033
- Figure 47: Middle East and Africa Gas Chromatography Market Revenue (billion), by Country 2025 & 2033
- Figure 48: Middle East and Africa Gas Chromatography Market Volume (K Unit), by Country 2025 & 2033
- Figure 49: Middle East and Africa Gas Chromatography Market Revenue Share (%), by Country 2025 & 2033
- Figure 50: Middle East and Africa Gas Chromatography Market Volume Share (%), by Country 2025 & 2033
- Figure 51: South America Gas Chromatography Market Revenue (billion), by Product 2025 & 2033
- Figure 52: South America Gas Chromatography Market Volume (K Unit), by Product 2025 & 2033
- Figure 53: South America Gas Chromatography Market Revenue Share (%), by Product 2025 & 2033
- Figure 54: South America Gas Chromatography Market Volume Share (%), by Product 2025 & 2033
- Figure 55: South America Gas Chromatography Market Revenue (billion), by End-User 2025 & 2033
- Figure 56: South America Gas Chromatography Market Volume (K Unit), by End-User 2025 & 2033
- Figure 57: South America Gas Chromatography Market Revenue Share (%), by End-User 2025 & 2033
- Figure 58: South America Gas Chromatography Market Volume Share (%), by End-User 2025 & 2033
- Figure 59: South America Gas Chromatography Market Revenue (billion), by Country 2025 & 2033
- Figure 60: South America Gas Chromatography Market Volume (K Unit), by Country 2025 & 2033
- Figure 61: South America Gas Chromatography Market Revenue Share (%), by Country 2025 & 2033
- Figure 62: South America Gas Chromatography Market Volume Share (%), by Country 2025 & 2033
List of Tables
- Table 1: Global Gas Chromatography Market Revenue billion Forecast, by Product 2020 & 2033
- Table 2: Global Gas Chromatography Market Volume K Unit Forecast, by Product 2020 & 2033
- Table 3: Global Gas Chromatography Market Revenue billion Forecast, by End-User 2020 & 2033
- Table 4: Global Gas Chromatography Market Volume K Unit Forecast, by End-User 2020 & 2033
- Table 5: Global Gas Chromatography Market Revenue billion Forecast, by Region 2020 & 2033
- Table 6: Global Gas Chromatography Market Volume K Unit Forecast, by Region 2020 & 2033
- Table 7: Global Gas Chromatography Market Revenue billion Forecast, by Product 2020 & 2033
- Table 8: Global Gas Chromatography Market Volume K Unit Forecast, by Product 2020 & 2033
- Table 9: Global Gas Chromatography Market Revenue billion Forecast, by End-User 2020 & 2033
- Table 10: Global Gas Chromatography Market Volume K Unit Forecast, by End-User 2020 & 2033
- Table 11: Global Gas Chromatography Market Revenue billion Forecast, by Country 2020 & 2033
- Table 12: Global Gas Chromatography Market Volume K Unit Forecast, by Country 2020 & 2033
- Table 13: United States Gas Chromatography Market Revenue (billion) Forecast, by Application 2020 & 2033
- Table 14: United States Gas Chromatography Market Volume (K Unit) Forecast, by Application 2020 & 2033
- Table 15: Canada Gas Chromatography Market Revenue (billion) Forecast, by Application 2020 & 2033
- Table 16: Canada Gas Chromatography Market Volume (K Unit) Forecast, by Application 2020 & 2033
- Table 17: Mexico Gas Chromatography Market Revenue (billion) Forecast, by Application 2020 & 2033
- Table 18: Mexico Gas Chromatography Market Volume (K Unit) Forecast, by Application 2020 & 2033
- Table 19: Global Gas Chromatography Market Revenue billion Forecast, by Product 2020 & 2033
- Table 20: Global Gas Chromatography Market Volume K Unit Forecast, by Product 2020 & 2033
- Table 21: Global Gas Chromatography Market Revenue billion Forecast, by End-User 2020 & 2033
- Table 22: Global Gas Chromatography Market Volume K Unit Forecast, by End-User 2020 & 2033
- Table 23: Global Gas Chromatography Market Revenue billion Forecast, by Country 2020 & 2033
- Table 24: Global Gas Chromatography Market Volume K Unit Forecast, by Country 2020 & 2033
- Table 25: Germany Gas Chromatography Market Revenue (billion) Forecast, by Application 2020 & 2033
- Table 26: Germany Gas Chromatography Market Volume (K Unit) Forecast, by Application 2020 & 2033
- Table 27: United Kingdom Gas Chromatography Market Revenue (billion) Forecast, by Application 2020 & 2033
- Table 28: United Kingdom Gas Chromatography Market Volume (K Unit) Forecast, by Application 2020 & 2033
- Table 29: France Gas Chromatography Market Revenue (billion) Forecast, by Application 2020 & 2033
- Table 30: France Gas Chromatography Market Volume (K Unit) Forecast, by Application 2020 & 2033
- Table 31: Italy Gas Chromatography Market Revenue (billion) Forecast, by Application 2020 & 2033
- Table 32: Italy Gas Chromatography Market Volume (K Unit) Forecast, by Application 2020 & 2033
- Table 33: Spain Gas Chromatography Market Revenue (billion) Forecast, by Application 2020 & 2033
- Table 34: Spain Gas Chromatography Market Volume (K Unit) Forecast, by Application 2020 & 2033
- Table 35: Rest of Europe Gas Chromatography Market Revenue (billion) Forecast, by Application 2020 & 2033
- Table 36: Rest of Europe Gas Chromatography Market Volume (K Unit) Forecast, by Application 2020 & 2033
- Table 37: Global Gas Chromatography Market Revenue billion Forecast, by Product 2020 & 2033
- Table 38: Global Gas Chromatography Market Volume K Unit Forecast, by Product 2020 & 2033
- Table 39: Global Gas Chromatography Market Revenue billion Forecast, by End-User 2020 & 2033
- Table 40: Global Gas Chromatography Market Volume K Unit Forecast, by End-User 2020 & 2033
- Table 41: Global Gas Chromatography Market Revenue billion Forecast, by Country 2020 & 2033
- Table 42: Global Gas Chromatography Market Volume K Unit Forecast, by Country 2020 & 2033
- Table 43: China Gas Chromatography Market Revenue (billion) Forecast, by Application 2020 & 2033
- Table 44: China Gas Chromatography Market Volume (K Unit) Forecast, by Application 2020 & 2033
- Table 45: Japan Gas Chromatography Market Revenue (billion) Forecast, by Application 2020 & 2033
- Table 46: Japan Gas Chromatography Market Volume (K Unit) Forecast, by Application 2020 & 2033
- Table 47: India Gas Chromatography Market Revenue (billion) Forecast, by Application 2020 & 2033
- Table 48: India Gas Chromatography Market Volume (K Unit) Forecast, by Application 2020 & 2033
- Table 49: Australia Gas Chromatography Market Revenue (billion) Forecast, by Application 2020 & 2033
- Table 50: Australia Gas Chromatography Market Volume (K Unit) Forecast, by Application 2020 & 2033
- Table 51: South korea Gas Chromatography Market Revenue (billion) Forecast, by Application 2020 & 2033
- Table 52: South korea Gas Chromatography Market Volume (K Unit) Forecast, by Application 2020 & 2033
- Table 53: Rest of Asia Pacific Gas Chromatography Market Revenue (billion) Forecast, by Application 2020 & 2033
- Table 54: Rest of Asia Pacific Gas Chromatography Market Volume (K Unit) Forecast, by Application 2020 & 2033
- Table 55: Global Gas Chromatography Market Revenue billion Forecast, by Product 2020 & 2033
- Table 56: Global Gas Chromatography Market Volume K Unit Forecast, by Product 2020 & 2033
- Table 57: Global Gas Chromatography Market Revenue billion Forecast, by End-User 2020 & 2033
- Table 58: Global Gas Chromatography Market Volume K Unit Forecast, by End-User 2020 & 2033
- Table 59: Global Gas Chromatography Market Revenue billion Forecast, by Country 2020 & 2033
- Table 60: Global Gas Chromatography Market Volume K Unit Forecast, by Country 2020 & 2033
- Table 61: GCC Gas Chromatography Market Revenue (billion) Forecast, by Application 2020 & 2033
- Table 62: GCC Gas Chromatography Market Volume (K Unit) Forecast, by Application 2020 & 2033
- Table 63: South Africa Gas Chromatography Market Revenue (billion) Forecast, by Application 2020 & 2033
- Table 64: South Africa Gas Chromatography Market Volume (K Unit) Forecast, by Application 2020 & 2033
- Table 65: Rest of Middle East and Africa Gas Chromatography Market Revenue (billion) Forecast, by Application 2020 & 2033
- Table 66: Rest of Middle East and Africa Gas Chromatography Market Volume (K Unit) Forecast, by Application 2020 & 2033
- Table 67: Global Gas Chromatography Market Revenue billion Forecast, by Product 2020 & 2033
- Table 68: Global Gas Chromatography Market Volume K Unit Forecast, by Product 2020 & 2033
- Table 69: Global Gas Chromatography Market Revenue billion Forecast, by End-User 2020 & 2033
- Table 70: Global Gas Chromatography Market Volume K Unit Forecast, by End-User 2020 & 2033
- Table 71: Global Gas Chromatography Market Revenue billion Forecast, by Country 2020 & 2033
- Table 72: Global Gas Chromatography Market Volume K Unit Forecast, by Country 2020 & 2033
- Table 73: Brazil Gas Chromatography Market Revenue (billion) Forecast, by Application 2020 & 2033
- Table 74: Brazil Gas Chromatography Market Volume (K Unit) Forecast, by Application 2020 & 2033
- Table 75: Argentina Gas Chromatography Market Revenue (billion) Forecast, by Application 2020 & 2033
- Table 76: Argentina Gas Chromatography Market Volume (K Unit) Forecast, by Application 2020 & 2033
- Table 77: Rest of South America Gas Chromatography Market Revenue (billion) Forecast, by Application 2020 & 2033
- Table 78: Rest of South America Gas Chromatography Market Volume (K Unit) Forecast, by Application 2020 & 2033
Frequently Asked Questions
1. What is the projected Compound Annual Growth Rate (CAGR) of the Gas Chromatography Market?
The projected CAGR is approximately 6.6%.
2. Which companies are prominent players in the Gas Chromatography Market?
Key companies in the market include Hobre Instruments BV, Restek Corporation, Process Sensing Technologies (LDetek Inc ), Chromatotec, Waters Corporation, Thermo Fisher Scientific Inc, Danaher Corporation, Agilent Technologies Inc, Sartorius, Merck KgaA, PerkinElmer Inc, Scion Instruments, Air Liquide, Teledyne Technologies, Shimadzu Corporation.
3. What are the main segments of the Gas Chromatography Market?
The market segments include Product, End-User.
4. Can you provide details about the market size?
The market size is estimated to be USD 4.43 billion as of 2022.
5. What are some drivers contributing to market growth?
Growing Importance of Chromatography Tests in the Drug Approval Process; Rising Adoption of Gas Chromatography-Mass Spectroscopy (GC-MS).
6. What are the notable trends driving market growth?
Pharmaceutical and Bioindustries is Expected to Hold a Significant Market Share Over the Forecast Period.
7. Are there any restraints impacting market growth?
High Cost of Gas Chromatography Equipment; Lack of Skilled Professionals.
8. Can you provide examples of recent developments in the market?
June 2022: PerkinElmer, Inc. launched the GC 2400 Platform, an advanced, automated gas chromatography (GC), headspace sampler, and GC-MS solution designed to help lab teams simplify lab operations, drive precise results, and perform more flexible monitoring.
9. What pricing options are available for accessing the report?
Pricing options include single-user, multi-user, and enterprise licenses priced at USD 4750, USD 5250, and USD 8750 respectively.
10. Is the market size provided in terms of value or volume?
The market size is provided in terms of value, measured in billion and volume, measured in K Unit.
11. Are there any specific market keywords associated with the report?
Yes, the market keyword associated with the report is "Gas Chromatography Market," which aids in identifying and referencing the specific market segment covered.
12. How do I determine which pricing option suits my needs best?
The pricing options vary based on user requirements and access needs. Individual users may opt for single-user licenses, while businesses requiring broader access may choose multi-user or enterprise licenses for cost-effective access to the report.
13. Are there any additional resources or data provided in the Gas Chromatography Market report?
While the report offers comprehensive insights, it's advisable to review the specific contents or supplementary materials provided to ascertain if additional resources or data are available.
14. How can I stay updated on further developments or reports in the Gas Chromatography Market?
To stay informed about further developments, trends, and reports in the Gas Chromatography Market, consider subscribing to industry newsletters, following relevant companies and organizations, or regularly checking reputable industry news sources and publications.
Methodology
Step 1 - Identification of Relevant Samples Size from Population Database


Step 2 - Approaches for Defining Global Market Size (Value, Volume* & Price*)

Note*: In applicable scenarios
Step 3 - Data Sources
Primary Research
- Web Analytics
- Survey Reports
- Research Institute
- Latest Research Reports
- Opinion Leaders
Secondary Research
- Annual Reports
- White Paper
- Latest Press Release
- Industry Association
- Paid Database
- Investor Presentations

Step 4 - Data Triangulation
Involves using different sources of information in order to increase the validity of a study
These sources are likely to be stakeholders in a program - participants, other researchers, program staff, other community members, and so on.
Then we put all data in single framework & apply various statistical tools to find out the dynamic on the market.
During the analysis stage, feedback from the stakeholder groups would be compared to determine areas of agreement as well as areas of divergence