
Key Insights
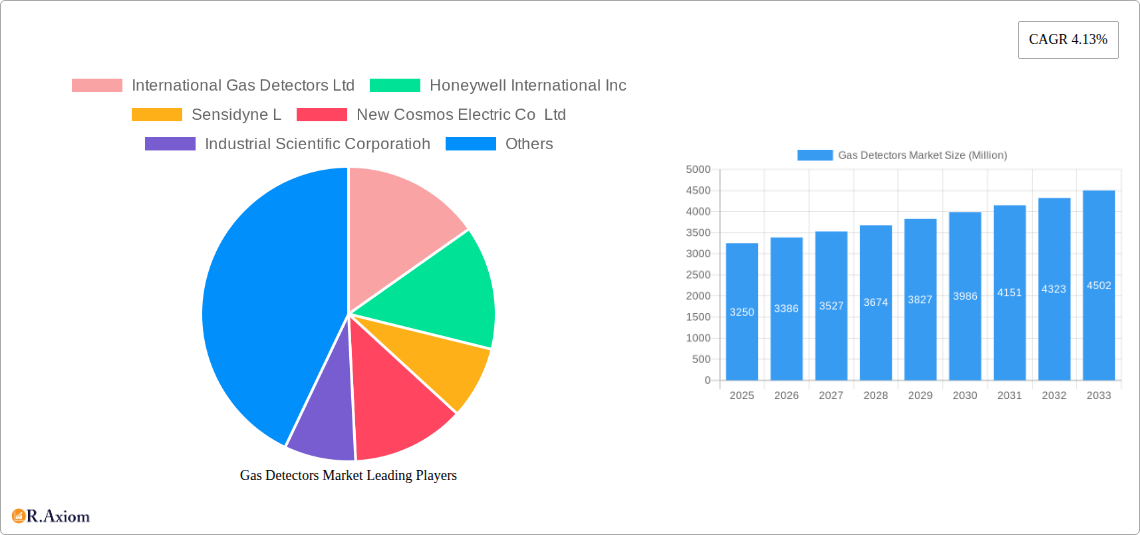
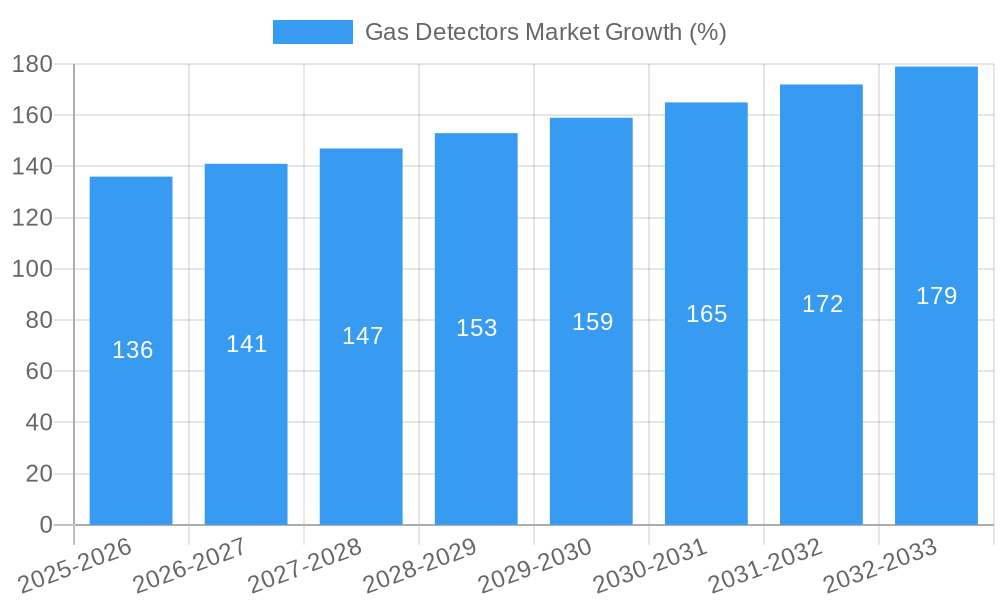
The global gas detectors market, valued at $3.25 billion in 2025, is projected to experience robust growth, exhibiting a Compound Annual Growth Rate (CAGR) of 4.13% from 2025 to 2033. This expansion is driven by several key factors. Stringent government regulations regarding workplace safety across various industries, particularly in oil and gas, chemicals, and mining, mandate the use of gas detectors for hazard prevention and worker protection. Furthermore, increasing awareness of the risks associated with gas leaks and the potential for catastrophic incidents is fueling demand for advanced and reliable gas detection technologies. Technological advancements, such as the development of smaller, more portable, and wireless detectors with improved sensor capabilities and connectivity features, contribute significantly to market growth. The rising adoption of Internet of Things (IoT) technologies in industrial settings facilitates remote monitoring and proactive maintenance, enhancing operational efficiency and safety. Finally, the expanding global industrial landscape, especially in developing economies in Asia-Pacific, is creating new opportunities for gas detector manufacturers.
The market segmentation reveals significant opportunities across different product types and end-user industries. Wireless gas detectors are gaining traction over wired systems due to their enhanced flexibility and ease of deployment. Within detector types, fixed detectors dominate due to their continuous monitoring capabilities in critical areas. However, the portable and transportable segments are also expanding rapidly, driven by the need for versatile and mobile solutions for diverse applications. The Oil and Gas sector remains the largest end-user industry, followed by Chemicals and Petrochemicals, reflecting the inherently hazardous nature of these operations. However, growing awareness of gas-related risks in other industries, such as water and wastewater treatment and mining, is leading to increased adoption in these sectors. Competitive landscape analysis shows the presence of established players such as Honeywell, MSA Safety, and Dragerwerk, alongside emerging companies offering innovative solutions and competing on price and features. Geographic expansion, particularly in rapidly industrializing regions, presents significant growth potential for all market participants.
Gas Detectors Market: A Comprehensive Report (2019-2033)
This in-depth report provides a comprehensive analysis of the Gas Detectors Market, offering actionable insights for industry stakeholders. Covering the period from 2019 to 2033, with a base year of 2025, this report examines market trends, competitive dynamics, and future growth prospects. The report segments the market by communication type (wired, wireless), detector type (fixed, portable & transportable), and end-user industry (oil and gas, chemicals and petrochemicals, water and wastewater, metal and mining, utilities, other). The report's value exceeds xx Million.
Gas Detectors Market Concentration & Innovation
The Gas Detectors Market exhibits a moderately concentrated landscape, with a few key players holding significant market share. Market share data for 2024 suggests that Honeywell International Inc. and MSA Safety Inc. are among the leading players, each commanding approximately xx% and xx% respectively. The remaining market share is distributed among other prominent companies including Dragerwerk AG & Co KGaA, Sensidyne LLC, and Industrial Scientific Corporation, each holding a share between xx% and xx%.
Innovation is a key driver, fueled by increasing demand for enhanced safety and regulatory compliance. Major innovations include the development of advanced sensor technologies, improved connectivity features (IoT integration), and miniaturization of devices for easier deployment in diverse environments.
Regulatory frameworks, such as those mandated by OSHA and other international bodies, play a crucial role in shaping market dynamics. Stringent safety standards drive the adoption of more sophisticated gas detection systems.
The market also sees continuous developments in product substitutes, such as improved gas detection techniques or alternative safety measures. However, these substitutes are often niche applications rather than widespread replacements.
End-user trends reveal a shift towards integrated safety solutions. This includes demands for systems offering data analytics and remote monitoring capabilities. M&A activity is moderate, with deal values typically ranging from xx Million to xx Million, driven by the desire to expand product portfolios and geographical reach. Recent notable M&A activities include [insert details of any recent M&A if available, otherwise state: "No significant M&A activity was recorded within the study period."].
Gas Detectors Market Industry Trends & Insights
The Gas Detectors Market is experiencing robust growth, driven by increasing industrialization, stringent safety regulations, and growing awareness of occupational hazards. The market is projected to register a CAGR of xx% during the forecast period (2025-2033), reaching a value of xx Million by 2033. This growth is attributed to several factors, including rising demand across various end-user industries, technological advancements leading to more efficient and reliable gas detectors, and expansion into emerging economies.
Technological disruptions, such as the integration of IoT and cloud computing, are transforming the industry. These advancements provide real-time monitoring, remote diagnostics, and predictive maintenance capabilities. Market penetration of advanced gas detection systems, particularly in industries with high safety risks like oil & gas, is steadily increasing.
Consumer preferences show a clear preference for user-friendly, portable, and reliable devices with long battery life and ease of maintenance. The competitive landscape is characterized by both established players and emerging companies focusing on specialized applications. Competitive dynamics include product differentiation through technological innovation, cost optimization strategies, and the expansion into newer markets.
Dominant Markets & Segments in Gas Detectors Market
The Oil and Gas sector represents the largest end-user industry segment, driving a significant share of the market. This dominance stems from the inherently hazardous nature of the industry and the stringent safety regulations enforced globally.
- Key Drivers in the Oil and Gas Sector: Stringent safety regulations, high risk of gas leaks and explosions, increasing demand for remote monitoring capabilities.
The Fixed type detector segment holds a leading position due to its continuous monitoring capabilities, essential in many industrial settings. Wireless communication technology is witnessing rapid adoption due to its flexibility and cost-effectiveness compared to wired systems.
Key Drivers in the Fixed Detector Segment: Continuous monitoring, improved safety, and suitability for hazardous areas.
Key Drivers in the Wireless Communication Segment: Flexibility of deployment, reduced installation costs, and ease of maintenance.
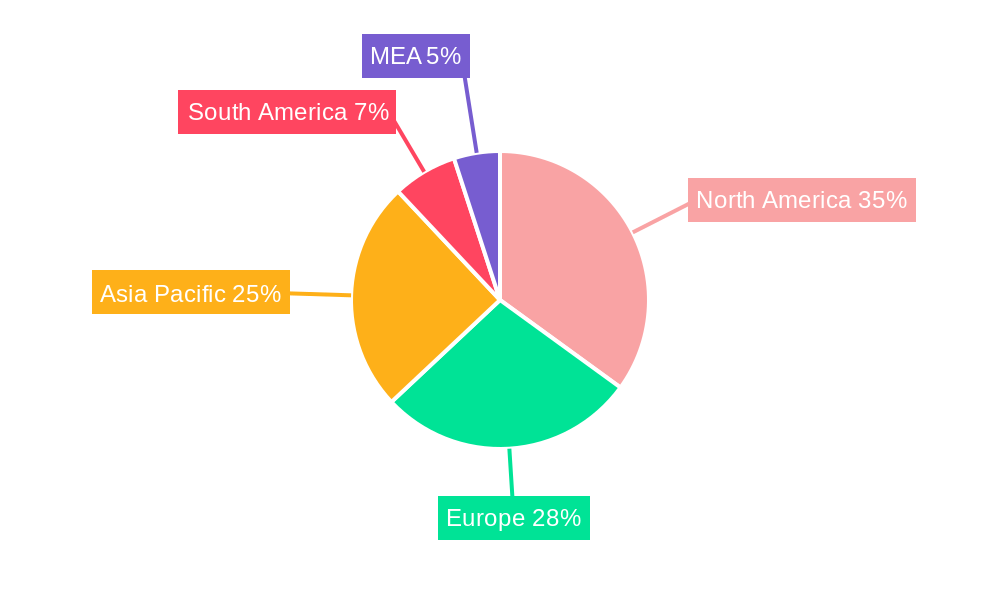
Geographically, North America and Europe are currently the dominant markets. However, Asia Pacific is poised for significant growth in the coming years due to rapid industrialization and rising safety concerns in emerging economies like China and India.
Key Drivers in North America: Stringent safety regulations, high adoption of advanced gas detection technologies, well-established infrastructure.
Key Drivers in Asia Pacific: Rapid industrialization, growing awareness of safety risks, increasing investment in infrastructure development.
Gas Detectors Market Product Developments
Recent product innovations focus on improving sensor accuracy, extending battery life, and enhancing connectivity. The market has witnessed the introduction of multi-gas detectors, integrating various sensor technologies into a single device. The development of intrinsically safe devices that can operate reliably in hazardous environments is also gaining traction. Companies are emphasizing competitive advantages through better sensor technology, superior data analytics capabilities, and user-friendly interfaces.
Report Scope & Segmentation Analysis
This report offers a comprehensive segmentation of the Gas Detectors Market:
By Communication Type: Wired and Wireless. The Wireless segment is expected to exhibit faster growth than the Wired segment due to its flexibility and cost-effectiveness.
By Type of Detector: Fixed, Portable and Transportable. The Fixed detector segment is currently dominant but the Portable and Transportable segments are anticipated to show substantial growth.
By End-User Industry: Oil and Gas, Chemicals and Petrochemicals, Water and Wastewater, Metal and Mining, Utilities, Other End-User Industries. The Oil and Gas segment holds the largest market share, followed by the Chemicals and Petrochemicals industry. Each segment showcases specific growth projections and competitive dynamics based on regional variations and regulatory frameworks.
Key Drivers of Gas Detectors Market Growth
Several factors drive market growth. Stringent safety regulations across various industries mandate the use of gas detection equipment, creating substantial demand. The increasing awareness of the dangers associated with gas leaks and explosions also fuels market expansion. Furthermore, technological advancements, particularly the development of more accurate and reliable sensors, are enhancing the functionality and efficiency of gas detection systems, making them more attractive to a wider range of users.
Challenges in the Gas Detectors Market Sector
The Gas Detectors Market faces several challenges, including the high initial investment costs of advanced gas detection systems. Supply chain disruptions and fluctuations in raw material prices also impact overall market dynamics. The market also experiences competitive pressures, especially from emerging players offering innovative and cost-effective solutions. Additionally, regulatory complexities and variations across different regions can create barriers to market entry and expansion.
Emerging Opportunities in Gas Detectors Market
Emerging opportunities lie in the development of gas detectors integrated with IoT and cloud platforms. This enables real-time data monitoring and predictive maintenance, increasing overall system efficiency and safety. The expansion into emerging markets, particularly in developing economies with rapidly growing industries, presents significant growth potential. Furthermore, the focus on developing more user-friendly and portable devices could attract new customers and drive market growth.
Leading Players in the Gas Detectors Market Market
- International Gas Detectors Ltd
- Honeywell International Inc
- Sensidyne LLC
- New Cosmos Electric Co Ltd
- Industrial Scientific Corporation
- Trolex Ltd
- MSA Safety Inc
- SENSIT Technologies LLC
- Dragerwerk AG & Co KGaA
- Hanwei Electronics Group Corporation
- Crowncon Detection Instruments Limited
- Emerson Electric Company
Key Developments in Gas Detectors Market Industry
- December 2023: CO2Meter launched the CM-900 industrial gas safety series, a new industrial gas detector designed for monitoring oxygen or carbon dioxide in industrial environments.
- September 2022: Riken Keiki Co. Ltd. developed the SD-3 fixed explosion-proof gas detector, compliant with global standards for continuous monitoring of flammable, toxic, and oxygen gases.
Strategic Outlook for Gas Detectors Market Market
The Gas Detectors Market is poised for continued growth, driven by technological advancements, increasing safety regulations, and expanding applications across various sectors. The integration of IoT and AI technologies is expected to further enhance the capabilities of gas detection systems, leading to new opportunities for market expansion. Focus on developing portable, user-friendly, and cost-effective solutions will remain crucial for capturing market share and catering to diverse customer needs. The market's future potential is significant, particularly in emerging economies, and companies with innovative product offerings and strong distribution networks are well-positioned to benefit from this growth.
Gas Detectors Market Segmentation
-
1. Communication Type
- 1.1. Wired
- 1.2. Wireless
-
2. Type of Detector
- 2.1. Fixed
- 2.2. Portable and Transportable
-
3. End-User Industry
- 3.1. Oil and Gas
- 3.2. Chemicals and Petrochemicals
- 3.3. Water and Wastewater
- 3.4. Metal and Mining
- 3.5. Utilities
- 3.6. Other End-User Industries
Gas Detectors Market Segmentation By Geography
- 1. North America
- 2. Europe
- 3. Asia Pacific
- 4. Latin America
- 5. Middle East and Africa
Gas Detectors Market REPORT HIGHLIGHTS
| Aspects | Details |
|---|---|
| Study Period | 2019-2033 |
| Base Year | 2024 |
| Estimated Year | 2025 |
| Forecast Period | 2025-2033 |
| Historical Period | 2019-2024 |
| Growth Rate | CAGR of 4.13% from 2019-2033 |
| Segmentation |
|
Table of Contents
- 1. Introduction
- 1.1. Research Scope
- 1.2. Market Segmentation
- 1.3. Research Methodology
- 1.4. Definitions and Assumptions
- 2. Executive Summary
- 2.1. Introduction
- 3. Market Dynamics
- 3.1. Introduction
- 3.2. Market Drivers
- 3.2.1. Growing Awareness about Hazards across Major Industries; Stringent Government Regulations for Safety of Workers; Companies Focusing on Smart Detectors
- 3.3. Market Restrains
- 3.3.1. Intense Competition in the Market
- 3.4. Market Trends
- 3.4.1. Oil and Gas Sector is Expected to Hold Major Share
- 4. Market Factor Analysis
- 4.1. Porters Five Forces
- 4.2. Supply/Value Chain
- 4.3. PESTEL analysis
- 4.4. Market Entropy
- 4.5. Patent/Trademark Analysis
- 5. Global Gas Detectors Market Analysis, Insights and Forecast, 2019-2031
- 5.1. Market Analysis, Insights and Forecast - by Communication Type
- 5.1.1. Wired
- 5.1.2. Wireless
- 5.2. Market Analysis, Insights and Forecast - by Type of Detector
- 5.2.1. Fixed
- 5.2.2. Portable and Transportable
- 5.3. Market Analysis, Insights and Forecast - by End-User Industry
- 5.3.1. Oil and Gas
- 5.3.2. Chemicals and Petrochemicals
- 5.3.3. Water and Wastewater
- 5.3.4. Metal and Mining
- 5.3.5. Utilities
- 5.3.6. Other End-User Industries
- 5.4. Market Analysis, Insights and Forecast - by Region
- 5.4.1. North America
- 5.4.2. Europe
- 5.4.3. Asia Pacific
- 5.4.4. Latin America
- 5.4.5. Middle East and Africa
- 5.1. Market Analysis, Insights and Forecast - by Communication Type
- 6. North America Gas Detectors Market Analysis, Insights and Forecast, 2019-2031
- 6.1. Market Analysis, Insights and Forecast - by Communication Type
- 6.1.1. Wired
- 6.1.2. Wireless
- 6.2. Market Analysis, Insights and Forecast - by Type of Detector
- 6.2.1. Fixed
- 6.2.2. Portable and Transportable
- 6.3. Market Analysis, Insights and Forecast - by End-User Industry
- 6.3.1. Oil and Gas
- 6.3.2. Chemicals and Petrochemicals
- 6.3.3. Water and Wastewater
- 6.3.4. Metal and Mining
- 6.3.5. Utilities
- 6.3.6. Other End-User Industries
- 6.1. Market Analysis, Insights and Forecast - by Communication Type
- 7. Europe Gas Detectors Market Analysis, Insights and Forecast, 2019-2031
- 7.1. Market Analysis, Insights and Forecast - by Communication Type
- 7.1.1. Wired
- 7.1.2. Wireless
- 7.2. Market Analysis, Insights and Forecast - by Type of Detector
- 7.2.1. Fixed
- 7.2.2. Portable and Transportable
- 7.3. Market Analysis, Insights and Forecast - by End-User Industry
- 7.3.1. Oil and Gas
- 7.3.2. Chemicals and Petrochemicals
- 7.3.3. Water and Wastewater
- 7.3.4. Metal and Mining
- 7.3.5. Utilities
- 7.3.6. Other End-User Industries
- 7.1. Market Analysis, Insights and Forecast - by Communication Type
- 8. Asia Pacific Gas Detectors Market Analysis, Insights and Forecast, 2019-2031
- 8.1. Market Analysis, Insights and Forecast - by Communication Type
- 8.1.1. Wired
- 8.1.2. Wireless
- 8.2. Market Analysis, Insights and Forecast - by Type of Detector
- 8.2.1. Fixed
- 8.2.2. Portable and Transportable
- 8.3. Market Analysis, Insights and Forecast - by End-User Industry
- 8.3.1. Oil and Gas
- 8.3.2. Chemicals and Petrochemicals
- 8.3.3. Water and Wastewater
- 8.3.4. Metal and Mining
- 8.3.5. Utilities
- 8.3.6. Other End-User Industries
- 8.1. Market Analysis, Insights and Forecast - by Communication Type
- 9. Latin America Gas Detectors Market Analysis, Insights and Forecast, 2019-2031
- 9.1. Market Analysis, Insights and Forecast - by Communication Type
- 9.1.1. Wired
- 9.1.2. Wireless
- 9.2. Market Analysis, Insights and Forecast - by Type of Detector
- 9.2.1. Fixed
- 9.2.2. Portable and Transportable
- 9.3. Market Analysis, Insights and Forecast - by End-User Industry
- 9.3.1. Oil and Gas
- 9.3.2. Chemicals and Petrochemicals
- 9.3.3. Water and Wastewater
- 9.3.4. Metal and Mining
- 9.3.5. Utilities
- 9.3.6. Other End-User Industries
- 9.1. Market Analysis, Insights and Forecast - by Communication Type
- 10. Middle East and Africa Gas Detectors Market Analysis, Insights and Forecast, 2019-2031
- 10.1. Market Analysis, Insights and Forecast - by Communication Type
- 10.1.1. Wired
- 10.1.2. Wireless
- 10.2. Market Analysis, Insights and Forecast - by Type of Detector
- 10.2.1. Fixed
- 10.2.2. Portable and Transportable
- 10.3. Market Analysis, Insights and Forecast - by End-User Industry
- 10.3.1. Oil and Gas
- 10.3.2. Chemicals and Petrochemicals
- 10.3.3. Water and Wastewater
- 10.3.4. Metal and Mining
- 10.3.5. Utilities
- 10.3.6. Other End-User Industries
- 10.1. Market Analysis, Insights and Forecast - by Communication Type
- 11. North America Gas Detectors Market Analysis, Insights and Forecast, 2019-2031
- 11.1. Market Analysis, Insights and Forecast - By Country/Sub-region
- 11.1.1 United States
- 11.1.2 Canada
- 11.1.3 Mexico
- 12. Europe Gas Detectors Market Analysis, Insights and Forecast, 2019-2031
- 12.1. Market Analysis, Insights and Forecast - By Country/Sub-region
- 12.1.1 Germany
- 12.1.2 United Kingdom
- 12.1.3 France
- 12.1.4 Spain
- 12.1.5 Italy
- 12.1.6 Spain
- 12.1.7 Belgium
- 12.1.8 Netherland
- 12.1.9 Nordics
- 12.1.10 Rest of Europe
- 13. Asia Pacific Gas Detectors Market Analysis, Insights and Forecast, 2019-2031
- 13.1. Market Analysis, Insights and Forecast - By Country/Sub-region
- 13.1.1 China
- 13.1.2 Japan
- 13.1.3 India
- 13.1.4 South Korea
- 13.1.5 Southeast Asia
- 13.1.6 Australia
- 13.1.7 Indonesia
- 13.1.8 Phillipes
- 13.1.9 Singapore
- 13.1.10 Thailandc
- 13.1.11 Rest of Asia Pacific
- 14. South America Gas Detectors Market Analysis, Insights and Forecast, 2019-2031
- 14.1. Market Analysis, Insights and Forecast - By Country/Sub-region
- 14.1.1 Brazil
- 14.1.2 Argentina
- 14.1.3 Peru
- 14.1.4 Chile
- 14.1.5 Colombia
- 14.1.6 Ecuador
- 14.1.7 Venezuela
- 14.1.8 Rest of South America
- 15. North America Gas Detectors Market Analysis, Insights and Forecast, 2019-2031
- 15.1. Market Analysis, Insights and Forecast - By Country/Sub-region
- 15.1.1 United States
- 15.1.2 Canada
- 15.1.3 Mexico
- 16. MEA Gas Detectors Market Analysis, Insights and Forecast, 2019-2031
- 16.1. Market Analysis, Insights and Forecast - By Country/Sub-region
- 16.1.1 United Arab Emirates
- 16.1.2 Saudi Arabia
- 16.1.3 South Africa
- 16.1.4 Rest of Middle East and Africa
- 17. Competitive Analysis
- 17.1. Global Market Share Analysis 2024
- 17.2. Company Profiles
- 17.2.1 International Gas Detectors Ltd
- 17.2.1.1. Overview
- 17.2.1.2. Products
- 17.2.1.3. SWOT Analysis
- 17.2.1.4. Recent Developments
- 17.2.1.5. Financials (Based on Availability)
- 17.2.2 Honeywell International Inc
- 17.2.2.1. Overview
- 17.2.2.2. Products
- 17.2.2.3. SWOT Analysis
- 17.2.2.4. Recent Developments
- 17.2.2.5. Financials (Based on Availability)
- 17.2.3 Sensidyne L
- 17.2.3.1. Overview
- 17.2.3.2. Products
- 17.2.3.3. SWOT Analysis
- 17.2.3.4. Recent Developments
- 17.2.3.5. Financials (Based on Availability)
- 17.2.4 New Cosmos Electric Co Ltd
- 17.2.4.1. Overview
- 17.2.4.2. Products
- 17.2.4.3. SWOT Analysis
- 17.2.4.4. Recent Developments
- 17.2.4.5. Financials (Based on Availability)
- 17.2.5 Industrial Scientific Corporatioh
- 17.2.5.1. Overview
- 17.2.5.2. Products
- 17.2.5.3. SWOT Analysis
- 17.2.5.4. Recent Developments
- 17.2.5.5. Financials (Based on Availability)
- 17.2.6 Trolex Ltd
- 17.2.6.1. Overview
- 17.2.6.2. Products
- 17.2.6.3. SWOT Analysis
- 17.2.6.4. Recent Developments
- 17.2.6.5. Financials (Based on Availability)
- 17.2.7 MSA Safety Inc
- 17.2.7.1. Overview
- 17.2.7.2. Products
- 17.2.7.3. SWOT Analysis
- 17.2.7.4. Recent Developments
- 17.2.7.5. Financials (Based on Availability)
- 17.2.8 SENSIT Technologies LLC
- 17.2.8.1. Overview
- 17.2.8.2. Products
- 17.2.8.3. SWOT Analysis
- 17.2.8.4. Recent Developments
- 17.2.8.5. Financials (Based on Availability)
- 17.2.9 Dragerwerk AG & Co KGaA
- 17.2.9.1. Overview
- 17.2.9.2. Products
- 17.2.9.3. SWOT Analysis
- 17.2.9.4. Recent Developments
- 17.2.9.5. Financials (Based on Availability)
- 17.2.10 Hanwei Electronics Group Corporation
- 17.2.10.1. Overview
- 17.2.10.2. Products
- 17.2.10.3. SWOT Analysis
- 17.2.10.4. Recent Developments
- 17.2.10.5. Financials (Based on Availability)
- 17.2.11 Crowncon Detection Instruments Limited
- 17.2.11.1. Overview
- 17.2.11.2. Products
- 17.2.11.3. SWOT Analysis
- 17.2.11.4. Recent Developments
- 17.2.11.5. Financials (Based on Availability)
- 17.2.12 Emerson Electric Company
- 17.2.12.1. Overview
- 17.2.12.2. Products
- 17.2.12.3. SWOT Analysis
- 17.2.12.4. Recent Developments
- 17.2.12.5. Financials (Based on Availability)
- 17.2.1 International Gas Detectors Ltd
List of Figures
- Figure 1: Global Gas Detectors Market Revenue Breakdown (Million, %) by Region 2024 & 2032
- Figure 2: North America Gas Detectors Market Revenue (Million), by Country 2024 & 2032
- Figure 3: North America Gas Detectors Market Revenue Share (%), by Country 2024 & 2032
- Figure 4: Europe Gas Detectors Market Revenue (Million), by Country 2024 & 2032
- Figure 5: Europe Gas Detectors Market Revenue Share (%), by Country 2024 & 2032
- Figure 6: Asia Pacific Gas Detectors Market Revenue (Million), by Country 2024 & 2032
- Figure 7: Asia Pacific Gas Detectors Market Revenue Share (%), by Country 2024 & 2032
- Figure 8: South America Gas Detectors Market Revenue (Million), by Country 2024 & 2032
- Figure 9: South America Gas Detectors Market Revenue Share (%), by Country 2024 & 2032
- Figure 10: North America Gas Detectors Market Revenue (Million), by Country 2024 & 2032
- Figure 11: North America Gas Detectors Market Revenue Share (%), by Country 2024 & 2032
- Figure 12: MEA Gas Detectors Market Revenue (Million), by Country 2024 & 2032
- Figure 13: MEA Gas Detectors Market Revenue Share (%), by Country 2024 & 2032
- Figure 14: North America Gas Detectors Market Revenue (Million), by Communication Type 2024 & 2032
- Figure 15: North America Gas Detectors Market Revenue Share (%), by Communication Type 2024 & 2032
- Figure 16: North America Gas Detectors Market Revenue (Million), by Type of Detector 2024 & 2032
- Figure 17: North America Gas Detectors Market Revenue Share (%), by Type of Detector 2024 & 2032
- Figure 18: North America Gas Detectors Market Revenue (Million), by End-User Industry 2024 & 2032
- Figure 19: North America Gas Detectors Market Revenue Share (%), by End-User Industry 2024 & 2032
- Figure 20: North America Gas Detectors Market Revenue (Million), by Country 2024 & 2032
- Figure 21: North America Gas Detectors Market Revenue Share (%), by Country 2024 & 2032
- Figure 22: Europe Gas Detectors Market Revenue (Million), by Communication Type 2024 & 2032
- Figure 23: Europe Gas Detectors Market Revenue Share (%), by Communication Type 2024 & 2032
- Figure 24: Europe Gas Detectors Market Revenue (Million), by Type of Detector 2024 & 2032
- Figure 25: Europe Gas Detectors Market Revenue Share (%), by Type of Detector 2024 & 2032
- Figure 26: Europe Gas Detectors Market Revenue (Million), by End-User Industry 2024 & 2032
- Figure 27: Europe Gas Detectors Market Revenue Share (%), by End-User Industry 2024 & 2032
- Figure 28: Europe Gas Detectors Market Revenue (Million), by Country 2024 & 2032
- Figure 29: Europe Gas Detectors Market Revenue Share (%), by Country 2024 & 2032
- Figure 30: Asia Pacific Gas Detectors Market Revenue (Million), by Communication Type 2024 & 2032
- Figure 31: Asia Pacific Gas Detectors Market Revenue Share (%), by Communication Type 2024 & 2032
- Figure 32: Asia Pacific Gas Detectors Market Revenue (Million), by Type of Detector 2024 & 2032
- Figure 33: Asia Pacific Gas Detectors Market Revenue Share (%), by Type of Detector 2024 & 2032
- Figure 34: Asia Pacific Gas Detectors Market Revenue (Million), by End-User Industry 2024 & 2032
- Figure 35: Asia Pacific Gas Detectors Market Revenue Share (%), by End-User Industry 2024 & 2032
- Figure 36: Asia Pacific Gas Detectors Market Revenue (Million), by Country 2024 & 2032
- Figure 37: Asia Pacific Gas Detectors Market Revenue Share (%), by Country 2024 & 2032
- Figure 38: Latin America Gas Detectors Market Revenue (Million), by Communication Type 2024 & 2032
- Figure 39: Latin America Gas Detectors Market Revenue Share (%), by Communication Type 2024 & 2032
- Figure 40: Latin America Gas Detectors Market Revenue (Million), by Type of Detector 2024 & 2032
- Figure 41: Latin America Gas Detectors Market Revenue Share (%), by Type of Detector 2024 & 2032
- Figure 42: Latin America Gas Detectors Market Revenue (Million), by End-User Industry 2024 & 2032
- Figure 43: Latin America Gas Detectors Market Revenue Share (%), by End-User Industry 2024 & 2032
- Figure 44: Latin America Gas Detectors Market Revenue (Million), by Country 2024 & 2032
- Figure 45: Latin America Gas Detectors Market Revenue Share (%), by Country 2024 & 2032
- Figure 46: Middle East and Africa Gas Detectors Market Revenue (Million), by Communication Type 2024 & 2032
- Figure 47: Middle East and Africa Gas Detectors Market Revenue Share (%), by Communication Type 2024 & 2032
- Figure 48: Middle East and Africa Gas Detectors Market Revenue (Million), by Type of Detector 2024 & 2032
- Figure 49: Middle East and Africa Gas Detectors Market Revenue Share (%), by Type of Detector 2024 & 2032
- Figure 50: Middle East and Africa Gas Detectors Market Revenue (Million), by End-User Industry 2024 & 2032
- Figure 51: Middle East and Africa Gas Detectors Market Revenue Share (%), by End-User Industry 2024 & 2032
- Figure 52: Middle East and Africa Gas Detectors Market Revenue (Million), by Country 2024 & 2032
- Figure 53: Middle East and Africa Gas Detectors Market Revenue Share (%), by Country 2024 & 2032
List of Tables
- Table 1: Global Gas Detectors Market Revenue Million Forecast, by Region 2019 & 2032
- Table 2: Global Gas Detectors Market Revenue Million Forecast, by Communication Type 2019 & 2032
- Table 3: Global Gas Detectors Market Revenue Million Forecast, by Type of Detector 2019 & 2032
- Table 4: Global Gas Detectors Market Revenue Million Forecast, by End-User Industry 2019 & 2032
- Table 5: Global Gas Detectors Market Revenue Million Forecast, by Region 2019 & 2032
- Table 6: Global Gas Detectors Market Revenue Million Forecast, by Country 2019 & 2032
- Table 7: United States Gas Detectors Market Revenue (Million) Forecast, by Application 2019 & 2032
- Table 8: Canada Gas Detectors Market Revenue (Million) Forecast, by Application 2019 & 2032
- Table 9: Mexico Gas Detectors Market Revenue (Million) Forecast, by Application 2019 & 2032
- Table 10: Global Gas Detectors Market Revenue Million Forecast, by Country 2019 & 2032
- Table 11: Germany Gas Detectors Market Revenue (Million) Forecast, by Application 2019 & 2032
- Table 12: United Kingdom Gas Detectors Market Revenue (Million) Forecast, by Application 2019 & 2032
- Table 13: France Gas Detectors Market Revenue (Million) Forecast, by Application 2019 & 2032
- Table 14: Spain Gas Detectors Market Revenue (Million) Forecast, by Application 2019 & 2032
- Table 15: Italy Gas Detectors Market Revenue (Million) Forecast, by Application 2019 & 2032
- Table 16: Spain Gas Detectors Market Revenue (Million) Forecast, by Application 2019 & 2032
- Table 17: Belgium Gas Detectors Market Revenue (Million) Forecast, by Application 2019 & 2032
- Table 18: Netherland Gas Detectors Market Revenue (Million) Forecast, by Application 2019 & 2032
- Table 19: Nordics Gas Detectors Market Revenue (Million) Forecast, by Application 2019 & 2032
- Table 20: Rest of Europe Gas Detectors Market Revenue (Million) Forecast, by Application 2019 & 2032
- Table 21: Global Gas Detectors Market Revenue Million Forecast, by Country 2019 & 2032
- Table 22: China Gas Detectors Market Revenue (Million) Forecast, by Application 2019 & 2032
- Table 23: Japan Gas Detectors Market Revenue (Million) Forecast, by Application 2019 & 2032
- Table 24: India Gas Detectors Market Revenue (Million) Forecast, by Application 2019 & 2032
- Table 25: South Korea Gas Detectors Market Revenue (Million) Forecast, by Application 2019 & 2032
- Table 26: Southeast Asia Gas Detectors Market Revenue (Million) Forecast, by Application 2019 & 2032
- Table 27: Australia Gas Detectors Market Revenue (Million) Forecast, by Application 2019 & 2032
- Table 28: Indonesia Gas Detectors Market Revenue (Million) Forecast, by Application 2019 & 2032
- Table 29: Phillipes Gas Detectors Market Revenue (Million) Forecast, by Application 2019 & 2032
- Table 30: Singapore Gas Detectors Market Revenue (Million) Forecast, by Application 2019 & 2032
- Table 31: Thailandc Gas Detectors Market Revenue (Million) Forecast, by Application 2019 & 2032
- Table 32: Rest of Asia Pacific Gas Detectors Market Revenue (Million) Forecast, by Application 2019 & 2032
- Table 33: Global Gas Detectors Market Revenue Million Forecast, by Country 2019 & 2032
- Table 34: Brazil Gas Detectors Market Revenue (Million) Forecast, by Application 2019 & 2032
- Table 35: Argentina Gas Detectors Market Revenue (Million) Forecast, by Application 2019 & 2032
- Table 36: Peru Gas Detectors Market Revenue (Million) Forecast, by Application 2019 & 2032
- Table 37: Chile Gas Detectors Market Revenue (Million) Forecast, by Application 2019 & 2032
- Table 38: Colombia Gas Detectors Market Revenue (Million) Forecast, by Application 2019 & 2032
- Table 39: Ecuador Gas Detectors Market Revenue (Million) Forecast, by Application 2019 & 2032
- Table 40: Venezuela Gas Detectors Market Revenue (Million) Forecast, by Application 2019 & 2032
- Table 41: Rest of South America Gas Detectors Market Revenue (Million) Forecast, by Application 2019 & 2032
- Table 42: Global Gas Detectors Market Revenue Million Forecast, by Country 2019 & 2032
- Table 43: United States Gas Detectors Market Revenue (Million) Forecast, by Application 2019 & 2032
- Table 44: Canada Gas Detectors Market Revenue (Million) Forecast, by Application 2019 & 2032
- Table 45: Mexico Gas Detectors Market Revenue (Million) Forecast, by Application 2019 & 2032
- Table 46: Global Gas Detectors Market Revenue Million Forecast, by Country 2019 & 2032
- Table 47: United Arab Emirates Gas Detectors Market Revenue (Million) Forecast, by Application 2019 & 2032
- Table 48: Saudi Arabia Gas Detectors Market Revenue (Million) Forecast, by Application 2019 & 2032
- Table 49: South Africa Gas Detectors Market Revenue (Million) Forecast, by Application 2019 & 2032
- Table 50: Rest of Middle East and Africa Gas Detectors Market Revenue (Million) Forecast, by Application 2019 & 2032
- Table 51: Global Gas Detectors Market Revenue Million Forecast, by Communication Type 2019 & 2032
- Table 52: Global Gas Detectors Market Revenue Million Forecast, by Type of Detector 2019 & 2032
- Table 53: Global Gas Detectors Market Revenue Million Forecast, by End-User Industry 2019 & 2032
- Table 54: Global Gas Detectors Market Revenue Million Forecast, by Country 2019 & 2032
- Table 55: Global Gas Detectors Market Revenue Million Forecast, by Communication Type 2019 & 2032
- Table 56: Global Gas Detectors Market Revenue Million Forecast, by Type of Detector 2019 & 2032
- Table 57: Global Gas Detectors Market Revenue Million Forecast, by End-User Industry 2019 & 2032
- Table 58: Global Gas Detectors Market Revenue Million Forecast, by Country 2019 & 2032
- Table 59: Global Gas Detectors Market Revenue Million Forecast, by Communication Type 2019 & 2032
- Table 60: Global Gas Detectors Market Revenue Million Forecast, by Type of Detector 2019 & 2032
- Table 61: Global Gas Detectors Market Revenue Million Forecast, by End-User Industry 2019 & 2032
- Table 62: Global Gas Detectors Market Revenue Million Forecast, by Country 2019 & 2032
- Table 63: Global Gas Detectors Market Revenue Million Forecast, by Communication Type 2019 & 2032
- Table 64: Global Gas Detectors Market Revenue Million Forecast, by Type of Detector 2019 & 2032
- Table 65: Global Gas Detectors Market Revenue Million Forecast, by End-User Industry 2019 & 2032
- Table 66: Global Gas Detectors Market Revenue Million Forecast, by Country 2019 & 2032
- Table 67: Global Gas Detectors Market Revenue Million Forecast, by Communication Type 2019 & 2032
- Table 68: Global Gas Detectors Market Revenue Million Forecast, by Type of Detector 2019 & 2032
- Table 69: Global Gas Detectors Market Revenue Million Forecast, by End-User Industry 2019 & 2032
- Table 70: Global Gas Detectors Market Revenue Million Forecast, by Country 2019 & 2032
Frequently Asked Questions
1. What is the projected Compound Annual Growth Rate (CAGR) of the Gas Detectors Market?
The projected CAGR is approximately 4.13%.
2. Which companies are prominent players in the Gas Detectors Market?
Key companies in the market include International Gas Detectors Ltd, Honeywell International Inc, Sensidyne L, New Cosmos Electric Co Ltd, Industrial Scientific Corporatioh, Trolex Ltd, MSA Safety Inc, SENSIT Technologies LLC, Dragerwerk AG & Co KGaA, Hanwei Electronics Group Corporation, Crowncon Detection Instruments Limited, Emerson Electric Company.
3. What are the main segments of the Gas Detectors Market?
The market segments include Communication Type, Type of Detector, End-User Industry.
4. Can you provide details about the market size?
The market size is estimated to be USD 3.25 Million as of 2022.
5. What are some drivers contributing to market growth?
Growing Awareness about Hazards across Major Industries; Stringent Government Regulations for Safety of Workers; Companies Focusing on Smart Detectors.
6. What are the notable trends driving market growth?
Oil and Gas Sector is Expected to Hold Major Share.
7. Are there any restraints impacting market growth?
Intense Competition in the Market.
8. Can you provide examples of recent developments in the market?
December 2023 - CO2Meter, one of the leading manufacturers in gas detection solutions announced the release of an industrial gas detector designed to monitor gases in industrial environments. The highly anticipated CM-900 industrial gas safety series would measure either oxygen or carbon dioxide, protecting employees working near and around hazardous gases in the field. The environmentally adaptive industrial enclosure also creates advantages for both harsh and wash-down environments.
9. What pricing options are available for accessing the report?
Pricing options include single-user, multi-user, and enterprise licenses priced at USD 4750, USD 5250, and USD 8750 respectively.
10. Is the market size provided in terms of value or volume?
The market size is provided in terms of value, measured in Million.
11. Are there any specific market keywords associated with the report?
Yes, the market keyword associated with the report is "Gas Detectors Market," which aids in identifying and referencing the specific market segment covered.
12. How do I determine which pricing option suits my needs best?
The pricing options vary based on user requirements and access needs. Individual users may opt for single-user licenses, while businesses requiring broader access may choose multi-user or enterprise licenses for cost-effective access to the report.
13. Are there any additional resources or data provided in the Gas Detectors Market report?
While the report offers comprehensive insights, it's advisable to review the specific contents or supplementary materials provided to ascertain if additional resources or data are available.
14. How can I stay updated on further developments or reports in the Gas Detectors Market?
To stay informed about further developments, trends, and reports in the Gas Detectors Market, consider subscribing to industry newsletters, following relevant companies and organizations, or regularly checking reputable industry news sources and publications.
Methodology
Step 1 - Identification of Relevant Samples Size from Population Database


Step 2 - Approaches for Defining Global Market Size (Value, Volume* & Price*)

Note*: In applicable scenarios
Step 3 - Data Sources
Primary Research
- Web Analytics
- Survey Reports
- Research Institute
- Latest Research Reports
- Opinion Leaders
Secondary Research
- Annual Reports
- White Paper
- Latest Press Release
- Industry Association
- Paid Database
- Investor Presentations

Step 4 - Data Triangulation
Involves using different sources of information in order to increase the validity of a study
These sources are likely to be stakeholders in a program - participants, other researchers, program staff, other community members, and so on.
Then we put all data in single framework & apply various statistical tools to find out the dynamic on the market.
During the analysis stage, feedback from the stakeholder groups would be compared to determine areas of agreement as well as areas of divergence


