GCC Solar Photovoltaic Industry Decoded: Comprehensive Analysis and Forecasts 2025-2033

GCC Solar Photovoltaic Industry by Deployment (Utility, Commercial and Industrial, Residential), by Geography (United Arab Emirates, Saudi Arabia, Rest of GCC), by United Arab Emirates, by Saudi Arabia, by Rest of GCC Forecast 2025-2033

Sep 20 2025
Base Year: 2024

234 Pages
Main Logo

GCC Solar Photovoltaic Industry Decoded: Comprehensive Analysis and Forecasts 2025-2033


Home
Industries
Energy & Power
sponsor image
sponsor image
sponsor image
sponsor image
sponsor image

Tailored for you

  • In-depth Analysis Tailored to Specified Regions or Segments
  • Company Profiles Customized to User Preferences
  • Comprehensive Insights Focused on Specific Segments or Regions
  • Customized Evaluation of Competitive Landscape to Meet Your Needs
  • Tailored Customization to Address Other Specific Requirements
Ask for customization


Key Insights

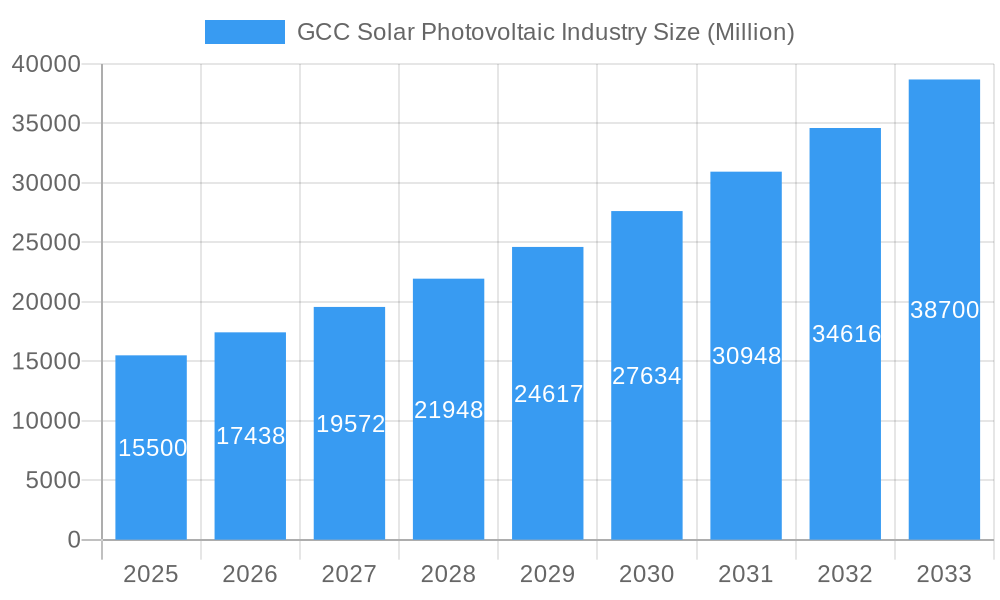
The GCC Solar Photovoltaic (PV) industry is poised for exceptional growth, with a current market size projected to exceed USD 15,000 million and a robust Compound Annual Growth Rate (CAGR) of over 12.50%. This surge is primarily driven by the region's ambitious renewable energy targets, substantial government investments in clean energy infrastructure, and the decreasing cost of solar technology. Key drivers include the urgent need to diversify economies away from fossil fuels, enhance energy security, and meet rapidly increasing electricity demand. Governments are actively promoting solar adoption through supportive policies, incentives, and large-scale utility projects, fostering a favorable investment climate. The ongoing development of mega-projects, coupled with a growing awareness of environmental sustainability, further accelerates market expansion.
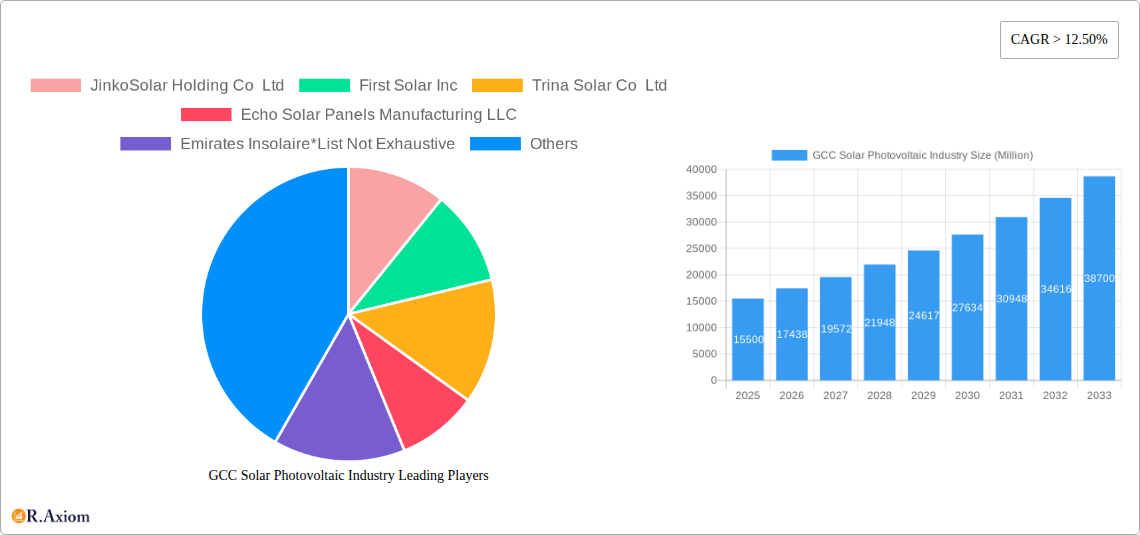
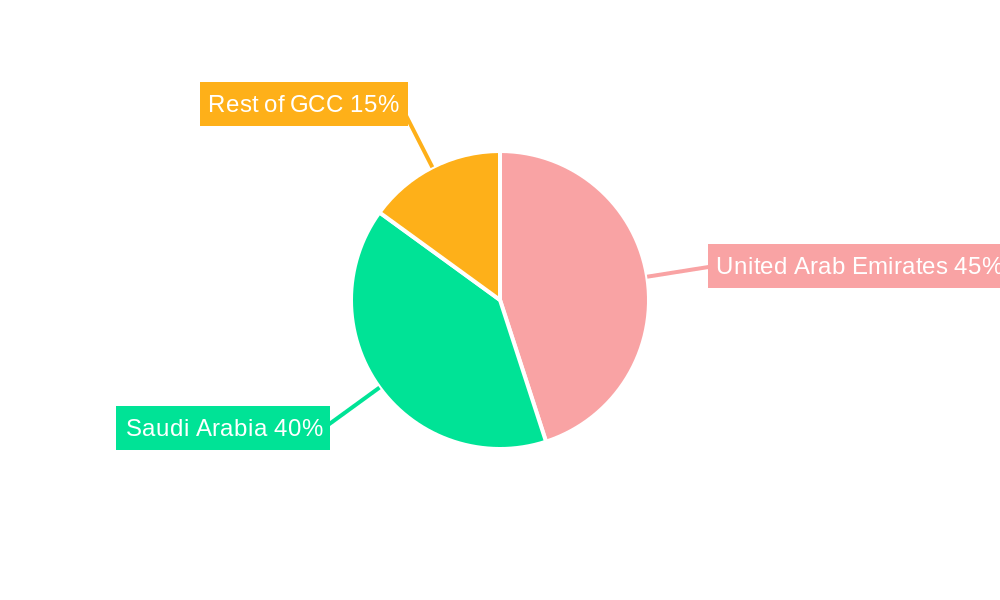
The market is strategically segmented across deployment types, with the Utility sector leading the charge, followed by Commercial and Industrial (C&I) and Residential applications. The United Arab Emirates and Saudi Arabia are the dominant geographical markets, spearheading the region's solar PV revolution, with the Rest of the GCC countries showing significant potential for growth. Key players like JinkoSolar, First Solar, Trina Solar, and local entities such as Echo Solar Panels Manufacturing LLC and Emirates Insolaire are actively shaping the market landscape through innovation and capacity expansion. Emerging trends include the integration of battery storage solutions with solar PV systems to address intermittency, advancements in bifacial solar panel technology for enhanced efficiency, and the increasing adoption of smart grid technologies to optimize solar energy integration. While the market exhibits immense promise, challenges such as grid integration complexities, land acquisition for large-scale projects, and the availability of skilled labor need to be strategically addressed to ensure sustained and efficient growth.

GCC Solar Photovoltaic Industry Research Report - Market Size, Growth & Forecast

GCC Solar Photovoltaic Industry Market Concentration & Innovation

The GCC solar photovoltaic (PV) industry is characterized by a moderate level of market concentration, with key global players alongside emerging regional manufacturers vying for dominance. Companies like JinkoSolar Holding Co. Ltd, First Solar Inc., and Trina Solar Co. Ltd command significant market share due to their established manufacturing capabilities and extensive global supply chains. Regionally, entities such as Echo Solar Panels Manufacturing LLC and Emirates Insolaire are increasingly contributing to the local production landscape. Innovation is a critical driver, fueled by the pursuit of higher efficiency modules, advanced bifacial solar technologies, and integrated energy storage solutions. Regulatory frameworks are continuously evolving to support renewable energy adoption, including feed-in tariffs, net metering policies, and ambitious national targets for solar power integration. Product substitutes, such as concentrated solar power (CSP) and other renewable energy sources, present competition, but the falling cost and improving efficiency of PV make it a strong contender. End-user trends are shifting towards distributed generation and smart grid integration, with a growing interest in rooftop solar for residential and commercial sectors. Mergers and acquisitions (M&A) activities, though less prevalent than in mature markets, are expected to increase as larger players seek to expand their regional footprint and smaller companies consolidate to achieve economies of scale. The investment in M&A deals is projected to grow significantly in the coming years as strategic partnerships and acquisitions become more common.

GCC Solar Photovoltaic Industry Industry Trends & Insights

The GCC solar photovoltaic industry is poised for substantial growth, driven by a confluence of factors including aggressive renewable energy targets, declining technology costs, and a growing imperative for energy diversification. The market is expected to witness a robust Compound Annual Growth Rate (CAGR) of approximately 15-20% during the forecast period of 2025–2033. This expansion is underpinned by significant government initiatives aimed at reducing reliance on fossil fuels and bolstering the clean energy sector. Technological disruptions are continuously reshaping the industry, with advancements in solar panel efficiency, such as the increasing adoption of PERC (Passivated Emitter and Rear Cell) and TOPCon (Tunnel Oxide Passivated Contact) technologies, leading to higher energy yields from smaller footprints. Bifacial solar panels, which capture sunlight from both sides, are gaining traction, offering enhanced energy generation. The integration of artificial intelligence (AI) and machine learning in solar farm management and predictive maintenance is also improving operational efficiency and reliability. Consumer preferences are evolving, with a growing demand for sustainable energy solutions from both residential and industrial sectors. This is evident in the rising adoption of rooftop solar installations and power purchase agreements (PPAs) for commercial and industrial (C&I) projects. The competitive dynamics within the GCC solar PV market are intensifying, with both established international manufacturers and increasingly capable local players competing on price, quality, and service. Market penetration for solar PV is still relatively nascent in some segments, presenting significant opportunities for further expansion. The increasing awareness of climate change and the economic benefits of renewable energy are further fueling this positive market outlook. Strategic investments in large-scale solar projects, coupled with supportive policies, are creating a fertile ground for sustained growth and innovation within the GCC solar PV landscape.

GCC Solar Photovoltaic Industry Growth

Dominant Markets & Segments in GCC Solar Photovoltaic Industry

The United Arab Emirates (UAE) and Saudi Arabia are the undisputed dominant markets within the GCC solar photovoltaic industry, driven by their ambitious renewable energy mandates and substantial investments in large-scale solar projects.

  • United Arab Emirates: The UAE has consistently led the region in solar PV deployment.
    • Key Drivers:
      • National Renewable Energy Targets: The UAE's vision to achieve a significant percentage of its energy mix from clean sources by 2050 necessitates massive solar installations.
      • Government Support and Incentives: Policies such as net metering, tax exemptions, and competitive tendering processes for renewable energy projects have accelerated adoption.
      • World-Class Infrastructure: The development of robust grid infrastructure capable of integrating large volumes of solar power is a critical enabler.
      • Leading Utilities: Dubai Electricity and Water Authority (DEWA) has been a frontrunner in developing and managing utility-scale solar parks, such as the Mohammed bin Rashid Al Maktoum Solar Park.
  • Saudi Arabia: Saudi Arabia is rapidly emerging as a major player, with massive pipeline projects and a strong commitment to its Vision 2030.
    • Key Drivers:
      • Vision 2030 Goals: The nation's economic diversification plan places a strong emphasis on renewable energy, including solar PV, to reduce oil dependency.
      • Strategic Investments: Significant investments from entities like ACWA Power are driving the development of utility-scale projects, exemplified by the Sakaka PV IPP.
      • Favorable Resource Potential: Abundant solar irradiation across the country makes solar PV a highly viable and cost-effective energy source.
      • Industrial Development: Initiatives like the planned thin-film industrial park by Hanergy Thin Film Power Group signal a move towards local manufacturing and job creation.

Dominant Deployment Segments:

  • Utility-Scale Deployment: This segment currently dominates the GCC solar PV market, characterized by the development of mega solar power plants (e.g., hundreds of megawatts to gigawatts). These projects are crucial for meeting national energy demands and achieving renewable energy targets. The investment in utility-scale projects often involves international developers and financiers, attracted by the competitive tariffs and government backing.
  • Commercial and Industrial (C&I) Deployment: This segment is experiencing significant growth, driven by businesses seeking to reduce operational costs through lower electricity bills and enhance their corporate social responsibility (CSR) profiles by adopting clean energy. Policies encouraging self-consumption and the installation of rooftop solar on commercial buildings are gaining momentum.
  • Residential Deployment: While still a smaller segment compared to utility-scale, residential solar PV is on an upward trajectory. Falling system costs, attractive financing options, and increasing environmental awareness among homeowners are contributing to its expansion. Government incentives and simplified interconnection processes are crucial for fostering this segment's growth.

The "Rest of GCC" (comprising Kuwait, Oman, Qatar, and Bahrain) is also actively pursuing solar PV development, albeit at a different pace and scale. These countries are implementing their own renewable energy targets and are gradually increasing their solar PV capacity, often looking to the successes of the UAE and Saudi Arabia as blueprints for their strategies.

GCC Solar Photovoltaic Industry Product Developments

Product development in the GCC solar photovoltaic industry is increasingly focused on enhancing efficiency and durability to withstand the region's harsh climatic conditions. Innovations include advanced multi-busbar (MBB) solar cells, which improve current collection and reduce resistance, leading to higher power output. The widespread adoption of bifacial solar panels, capable of generating electricity from both sides, is a significant trend, offering up to 20% increased energy yield. Anti-reflective coatings and self-cleaning surfaces are being integrated to maximize light absorption and minimize performance degradation due to dust and sand. Furthermore, the development of robust mounting structures and advanced inverters designed for desert environments is crucial. These product advancements aim to deliver higher lifetime energy yields, lower levelized cost of energy (LCOE), and improved reliability, making solar PV an even more competitive and attractive energy solution in the GCC.

Report Scope & Segmentation Analysis

This report provides a comprehensive analysis of the GCC solar photovoltaic industry, encompassing key segments across deployment and geography. The market is segmented by deployment types: Utility, Commercial and Industrial (C&I), and Residential. The Utility segment focuses on large-scale solar power plants developed by governments and independent power producers, contributing significantly to the region's energy mix. The C&I segment examines solar installations on commercial and industrial facilities, driven by cost savings and sustainability goals. The Residential segment explores rooftop solar solutions for homes, indicating growing consumer adoption. Geographically, the report analyzes the market within the United Arab Emirates and Saudi Arabia, recognizing their leadership roles, as well as the "Rest of GCC" comprising Oman, Kuwait, Qatar, and Bahrain. Growth projections and market sizes are provided for each segment, alongside an assessment of the competitive dynamics and key growth drivers influencing their development throughout the study period of 2019–2033.

Key Drivers of GCC Solar Photovoltaic Industry Growth

Several key factors are propelling the growth of the GCC solar photovoltaic industry.

  • Ambitious Renewable Energy Targets: Nations across the GCC have set aggressive goals to increase the share of renewable energy in their power generation mix, directly driving demand for solar PV.
  • Declining Technology Costs: The continuous reduction in the cost of solar panels and balance-of-system components makes solar PV increasingly economically competitive with conventional energy sources.
  • Government Support and Policies: Favorable regulatory frameworks, including feed-in tariffs, net metering policies, and attractive tendering processes, are creating an enabling environment for solar investment.
  • Energy Diversification Imperative: The strategic need to diversify energy sources away from oil and gas, driven by economic and environmental considerations, is a significant catalyst.
  • Technological Advancements: Improvements in solar panel efficiency, bifacial technology, and energy storage solutions enhance the performance and reliability of solar installations.

Challenges in the GCC Solar Photovoltaic Industry Sector

Despite its promising growth, the GCC solar photovoltaic industry faces several challenges.

  • Intermittency and Storage: The inherent intermittency of solar power necessitates significant investment in energy storage solutions to ensure a stable and reliable power supply, which can increase project costs.
  • Grid Integration and Infrastructure: Integrating large-scale solar power into existing grid infrastructure requires substantial upgrades and smart grid technologies, which can be complex and costly.
  • Harsh Environmental Conditions: High temperatures, dust, and humidity in the GCC region can impact the performance and longevity of solar panels, requiring specialized, more expensive equipment and increased maintenance.
  • Supply Chain Vulnerabilities: Reliance on imported solar panels and components can expose the industry to global supply chain disruptions and price volatility.
  • Regulatory Uncertainty: While frameworks are improving, any shifts in government policies or incentives can create uncertainty for investors and developers.

Emerging Opportunities in GCC Solar Photovoltaic Industry

The GCC solar photovoltaic industry is ripe with emerging opportunities. The increasing focus on green hydrogen production, powered by solar energy, presents a significant new market. The expansion of smart cities and sustainable development initiatives across the region will drive demand for distributed solar generation and integrated renewable energy solutions. Advancements in floating solar technology offer potential for deployment on reservoirs and water bodies, conserving land resources. Furthermore, the growth of electric vehicle (EV) charging infrastructure, powered by solar, creates synergistic opportunities. The development of regional manufacturing capabilities for solar components presents a chance to reduce import dependency and create local employment.

Leading Players in the GCC Solar Photovoltaic Industry Market

  • JinkoSolar Holding Co Ltd
  • First Solar Inc
  • Trina Solar Co Ltd
  • Echo Solar Panels Manufacturing LLC
  • Emirates Insolaire
  • Sunergy Solar
  • Canadian Solar Inc
  • Dubai Electricity and Water Authority
  • Masdar Abu Dhabi Future Energy Company
  • ACWA Power

Key Developments in GCC Solar Photovoltaic Industry Industry

  • April 2021: ACWA Power inaugurated the 300 MW Sakaka PV IPP, the country's first utility-scale renewable energy project, at an investment cost of SAR 1.2 billion. The project was awarded to ACWA Power at a record-breaking tariff of USD 2.3417 cents/kWh (8.781 halalas/kWh). This development set a new benchmark for cost-competitiveness in utility-scale solar in Saudi Arabia and the wider GCC.
  • Early 2020: Hanergy Thin Film Power Group announced its plan to build a thin-film industrial park in Saudi Arabia, at an estimated cost of USD 1 billion (EUR 870 million). Upon completion, this project is set to be the first of its kind in the Middle East, signifying a push towards local manufacturing and advanced solar technology development within the region.

Strategic Outlook for GCC Solar Photovoltaic Industry Market

The strategic outlook for the GCC solar photovoltaic industry remains exceptionally strong, driven by unwavering government commitment to energy transition and economic diversification. The continuous decline in solar PV costs, coupled with advancements in efficiency and storage technologies, will further enhance its competitiveness. Increased focus on utility-scale projects, alongside the burgeoning C&I and residential segments, will fuel market expansion. Strategic partnerships and potential M&A activities among leading players are anticipated, leading to market consolidation and enhanced capabilities. The region's abundant solar resources, coupled with supportive regulatory environments, position it as a prime destination for significant solar PV investment and innovation in the coming decade.

GCC Solar Photovoltaic Industry Segmentation

  • 1. Deployment
    • 1.1. Utility
    • 1.2. Commercial and Industrial
    • 1.3. Residential
  • 2. Geography
    • 2.1. United Arab Emirates
    • 2.2. Saudi Arabia
    • 2.3. Rest of GCC

GCC Solar Photovoltaic Industry Segmentation By Geography

  • 1. United Arab Emirates
  • 2. Saudi Arabia
  • 3. Rest of GCC
GCC Solar Photovoltaic Industry Regional Share


GCC Solar Photovoltaic Industry REPORT HIGHLIGHTS

AspectsDetails
Study Period 2019-2033
Base Year 2024
Estimated Year 2025
Forecast Period2025-2033
Historical Period2019-2024
Growth RateCAGR of > 12.50% from 2019-2033
Segmentation
    • By Deployment
      • Utility
      • Commercial and Industrial
      • Residential
    • By Geography
      • United Arab Emirates
      • Saudi Arabia
      • Rest of GCC
  • By Geography
    • United Arab Emirates
    • Saudi Arabia
    • Rest of GCC


Table of Contents

  1. 1. Introduction
    • 1.1. Research Scope
    • 1.2. Market Segmentation
    • 1.3. Research Methodology
    • 1.4. Definitions and Assumptions
  2. 2. Executive Summary
    • 2.1. Introduction
  3. 3. Market Dynamics
    • 3.1. Introduction
      • 3.2. Market Drivers
        • 3.2.1. 4.; Increasing Solar Energy Demand4.; Declining Cost of Solar PV Systems
      • 3.3. Market Restrains
        • 3.3.1. 4.; Strong Dependence on Prevailing Weather Condition
      • 3.4. Market Trends
        • 3.4.1. Utility Sector as a Significant Sector
  4. 4. Market Factor Analysis
    • 4.1. Porters Five Forces
    • 4.2. Supply/Value Chain
    • 4.3. PESTEL analysis
    • 4.4. Market Entropy
    • 4.5. Patent/Trademark Analysis
  5. 5. Global GCC Solar Photovoltaic Industry Analysis, Insights and Forecast, 2019-2031
    • 5.1. Market Analysis, Insights and Forecast - by Deployment
      • 5.1.1. Utility
      • 5.1.2. Commercial and Industrial
      • 5.1.3. Residential
    • 5.2. Market Analysis, Insights and Forecast - by Geography
      • 5.2.1. United Arab Emirates
      • 5.2.2. Saudi Arabia
      • 5.2.3. Rest of GCC
    • 5.3. Market Analysis, Insights and Forecast - by Region
      • 5.3.1. United Arab Emirates
      • 5.3.2. Saudi Arabia
      • 5.3.3. Rest of GCC
  6. 6. United Arab Emirates GCC Solar Photovoltaic Industry Analysis, Insights and Forecast, 2019-2031
    • 6.1. Market Analysis, Insights and Forecast - by Deployment
      • 6.1.1. Utility
      • 6.1.2. Commercial and Industrial
      • 6.1.3. Residential
    • 6.2. Market Analysis, Insights and Forecast - by Geography
      • 6.2.1. United Arab Emirates
      • 6.2.2. Saudi Arabia
      • 6.2.3. Rest of GCC
  7. 7. Saudi Arabia GCC Solar Photovoltaic Industry Analysis, Insights and Forecast, 2019-2031
    • 7.1. Market Analysis, Insights and Forecast - by Deployment
      • 7.1.1. Utility
      • 7.1.2. Commercial and Industrial
      • 7.1.3. Residential
    • 7.2. Market Analysis, Insights and Forecast - by Geography
      • 7.2.1. United Arab Emirates
      • 7.2.2. Saudi Arabia
      • 7.2.3. Rest of GCC
  8. 8. Rest of GCC GCC Solar Photovoltaic Industry Analysis, Insights and Forecast, 2019-2031
    • 8.1. Market Analysis, Insights and Forecast - by Deployment
      • 8.1.1. Utility
      • 8.1.2. Commercial and Industrial
      • 8.1.3. Residential
    • 8.2. Market Analysis, Insights and Forecast - by Geography
      • 8.2.1. United Arab Emirates
      • 8.2.2. Saudi Arabia
      • 8.2.3. Rest of GCC
  9. 9. North America GCC Solar Photovoltaic Industry Analysis, Insights and Forecast, 2019-2031
      • 9.1. Market Analysis, Insights and Forecast - By Country/Sub-region
        • 9.1.1 United States
        • 9.1.2 Canada
        • 9.1.3 Mexico
  10. 10. Europe GCC Solar Photovoltaic Industry Analysis, Insights and Forecast, 2019-2031
      • 10.1. Market Analysis, Insights and Forecast - By Country/Sub-region
        • 10.1.1 Germany
        • 10.1.2 United Kingdom
        • 10.1.3 France
        • 10.1.4 Spain
        • 10.1.5 Italy
        • 10.1.6 Spain
        • 10.1.7 Belgium
        • 10.1.8 Netherland
        • 10.1.9 Nordics
        • 10.1.10 Rest of Europe
  11. 11. Asia Pacific GCC Solar Photovoltaic Industry Analysis, Insights and Forecast, 2019-2031
      • 11.1. Market Analysis, Insights and Forecast - By Country/Sub-region
        • 11.1.1 China
        • 11.1.2 Japan
        • 11.1.3 India
        • 11.1.4 South Korea
        • 11.1.5 Southeast Asia
        • 11.1.6 Australia
        • 11.1.7 Indonesia
        • 11.1.8 Phillipes
        • 11.1.9 Singapore
        • 11.1.10 Thailandc
        • 11.1.11 Rest of Asia Pacific
  12. 12. South America GCC Solar Photovoltaic Industry Analysis, Insights and Forecast, 2019-2031
      • 12.1. Market Analysis, Insights and Forecast - By Country/Sub-region
        • 12.1.1 Brazil
        • 12.1.2 Argentina
        • 12.1.3 Peru
        • 12.1.4 Chile
        • 12.1.5 Colombia
        • 12.1.6 Ecuador
        • 12.1.7 Venezuela
        • 12.1.8 Rest of South America
  13. 13. North America GCC Solar Photovoltaic Industry Analysis, Insights and Forecast, 2019-2031
      • 13.1. Market Analysis, Insights and Forecast - By Country/Sub-region
        • 13.1.1 United States
        • 13.1.2 Canada
        • 13.1.3 Mexico
  14. 14. MEA GCC Solar Photovoltaic Industry Analysis, Insights and Forecast, 2019-2031
      • 14.1. Market Analysis, Insights and Forecast - By Country/Sub-region
        • 14.1.1 United Arab Emirates
        • 14.1.2 Saudi Arabia
        • 14.1.3 South Africa
        • 14.1.4 Rest of Middle East and Africa
  15. 15. Competitive Analysis
    • 15.1. Global Market Share Analysis 2024
      • 15.2. Company Profiles
        • 15.2.1 JinkoSolar Holding Co Ltd
          • 15.2.1.1. Overview
          • 15.2.1.2. Products
          • 15.2.1.3. SWOT Analysis
          • 15.2.1.4. Recent Developments
          • 15.2.1.5. Financials (Based on Availability)
        • 15.2.2 First Solar Inc
          • 15.2.2.1. Overview
          • 15.2.2.2. Products
          • 15.2.2.3. SWOT Analysis
          • 15.2.2.4. Recent Developments
          • 15.2.2.5. Financials (Based on Availability)
        • 15.2.3 Trina Solar Co Ltd
          • 15.2.3.1. Overview
          • 15.2.3.2. Products
          • 15.2.3.3. SWOT Analysis
          • 15.2.3.4. Recent Developments
          • 15.2.3.5. Financials (Based on Availability)
        • 15.2.4 Echo Solar Panels Manufacturing LLC
          • 15.2.4.1. Overview
          • 15.2.4.2. Products
          • 15.2.4.3. SWOT Analysis
          • 15.2.4.4. Recent Developments
          • 15.2.4.5. Financials (Based on Availability)
        • 15.2.5 Emirates Insolaire*List Not Exhaustive
          • 15.2.5.1. Overview
          • 15.2.5.2. Products
          • 15.2.5.3. SWOT Analysis
          • 15.2.5.4. Recent Developments
          • 15.2.5.5. Financials (Based on Availability)
        • 15.2.6 Sunergy Solar
          • 15.2.6.1. Overview
          • 15.2.6.2. Products
          • 15.2.6.3. SWOT Analysis
          • 15.2.6.4. Recent Developments
          • 15.2.6.5. Financials (Based on Availability)
        • 15.2.7 Canadian Solar Inc
          • 15.2.7.1. Overview
          • 15.2.7.2. Products
          • 15.2.7.3. SWOT Analysis
          • 15.2.7.4. Recent Developments
          • 15.2.7.5. Financials (Based on Availability)
        • 15.2.8 Dubai Electricity and Water Authority
          • 15.2.8.1. Overview
          • 15.2.8.2. Products
          • 15.2.8.3. SWOT Analysis
          • 15.2.8.4. Recent Developments
          • 15.2.8.5. Financials (Based on Availability)
        • 15.2.9 Masdar Abu Dhabi Future Energy Company
          • 15.2.9.1. Overview
          • 15.2.9.2. Products
          • 15.2.9.3. SWOT Analysis
          • 15.2.9.4. Recent Developments
          • 15.2.9.5. Financials (Based on Availability)
        • 15.2.10 ACWA Power
          • 15.2.10.1. Overview
          • 15.2.10.2. Products
          • 15.2.10.3. SWOT Analysis
          • 15.2.10.4. Recent Developments
          • 15.2.10.5. Financials (Based on Availability)

List of Figures

  1. Figure 1: Global GCC Solar Photovoltaic Industry Revenue Breakdown (Million, %) by Region 2024 & 2032
  2. Figure 2: North America GCC Solar Photovoltaic Industry Revenue (Million), by Country 2024 & 2032
  3. Figure 3: North America GCC Solar Photovoltaic Industry Revenue Share (%), by Country 2024 & 2032
  4. Figure 4: Europe GCC Solar Photovoltaic Industry Revenue (Million), by Country 2024 & 2032
  5. Figure 5: Europe GCC Solar Photovoltaic Industry Revenue Share (%), by Country 2024 & 2032
  6. Figure 6: Asia Pacific GCC Solar Photovoltaic Industry Revenue (Million), by Country 2024 & 2032
  7. Figure 7: Asia Pacific GCC Solar Photovoltaic Industry Revenue Share (%), by Country 2024 & 2032
  8. Figure 8: South America GCC Solar Photovoltaic Industry Revenue (Million), by Country 2024 & 2032
  9. Figure 9: South America GCC Solar Photovoltaic Industry Revenue Share (%), by Country 2024 & 2032
  10. Figure 10: North America GCC Solar Photovoltaic Industry Revenue (Million), by Country 2024 & 2032
  11. Figure 11: North America GCC Solar Photovoltaic Industry Revenue Share (%), by Country 2024 & 2032
  12. Figure 12: MEA GCC Solar Photovoltaic Industry Revenue (Million), by Country 2024 & 2032
  13. Figure 13: MEA GCC Solar Photovoltaic Industry Revenue Share (%), by Country 2024 & 2032
  14. Figure 14: United Arab Emirates GCC Solar Photovoltaic Industry Revenue (Million), by Deployment 2024 & 2032
  15. Figure 15: United Arab Emirates GCC Solar Photovoltaic Industry Revenue Share (%), by Deployment 2024 & 2032
  16. Figure 16: United Arab Emirates GCC Solar Photovoltaic Industry Revenue (Million), by Geography 2024 & 2032
  17. Figure 17: United Arab Emirates GCC Solar Photovoltaic Industry Revenue Share (%), by Geography 2024 & 2032
  18. Figure 18: United Arab Emirates GCC Solar Photovoltaic Industry Revenue (Million), by Country 2024 & 2032
  19. Figure 19: United Arab Emirates GCC Solar Photovoltaic Industry Revenue Share (%), by Country 2024 & 2032
  20. Figure 20: Saudi Arabia GCC Solar Photovoltaic Industry Revenue (Million), by Deployment 2024 & 2032
  21. Figure 21: Saudi Arabia GCC Solar Photovoltaic Industry Revenue Share (%), by Deployment 2024 & 2032
  22. Figure 22: Saudi Arabia GCC Solar Photovoltaic Industry Revenue (Million), by Geography 2024 & 2032
  23. Figure 23: Saudi Arabia GCC Solar Photovoltaic Industry Revenue Share (%), by Geography 2024 & 2032
  24. Figure 24: Saudi Arabia GCC Solar Photovoltaic Industry Revenue (Million), by Country 2024 & 2032
  25. Figure 25: Saudi Arabia GCC Solar Photovoltaic Industry Revenue Share (%), by Country 2024 & 2032
  26. Figure 26: Rest of GCC GCC Solar Photovoltaic Industry Revenue (Million), by Deployment 2024 & 2032
  27. Figure 27: Rest of GCC GCC Solar Photovoltaic Industry Revenue Share (%), by Deployment 2024 & 2032
  28. Figure 28: Rest of GCC GCC Solar Photovoltaic Industry Revenue (Million), by Geography 2024 & 2032
  29. Figure 29: Rest of GCC GCC Solar Photovoltaic Industry Revenue Share (%), by Geography 2024 & 2032
  30. Figure 30: Rest of GCC GCC Solar Photovoltaic Industry Revenue (Million), by Country 2024 & 2032
  31. Figure 31: Rest of GCC GCC Solar Photovoltaic Industry Revenue Share (%), by Country 2024 & 2032

List of Tables

  1. Table 1: Global GCC Solar Photovoltaic Industry Revenue Million Forecast, by Region 2019 & 2032
  2. Table 2: Global GCC Solar Photovoltaic Industry Revenue Million Forecast, by Deployment 2019 & 2032
  3. Table 3: Global GCC Solar Photovoltaic Industry Revenue Million Forecast, by Geography 2019 & 2032
  4. Table 4: Global GCC Solar Photovoltaic Industry Revenue Million Forecast, by Region 2019 & 2032
  5. Table 5: Global GCC Solar Photovoltaic Industry Revenue Million Forecast, by Country 2019 & 2032
  6. Table 6: United States GCC Solar Photovoltaic Industry Revenue (Million) Forecast, by Application 2019 & 2032
  7. Table 7: Canada GCC Solar Photovoltaic Industry Revenue (Million) Forecast, by Application 2019 & 2032
  8. Table 8: Mexico GCC Solar Photovoltaic Industry Revenue (Million) Forecast, by Application 2019 & 2032
  9. Table 9: Global GCC Solar Photovoltaic Industry Revenue Million Forecast, by Country 2019 & 2032
  10. Table 10: Germany GCC Solar Photovoltaic Industry Revenue (Million) Forecast, by Application 2019 & 2032
  11. Table 11: United Kingdom GCC Solar Photovoltaic Industry Revenue (Million) Forecast, by Application 2019 & 2032
  12. Table 12: France GCC Solar Photovoltaic Industry Revenue (Million) Forecast, by Application 2019 & 2032
  13. Table 13: Spain GCC Solar Photovoltaic Industry Revenue (Million) Forecast, by Application 2019 & 2032
  14. Table 14: Italy GCC Solar Photovoltaic Industry Revenue (Million) Forecast, by Application 2019 & 2032
  15. Table 15: Spain GCC Solar Photovoltaic Industry Revenue (Million) Forecast, by Application 2019 & 2032
  16. Table 16: Belgium GCC Solar Photovoltaic Industry Revenue (Million) Forecast, by Application 2019 & 2032
  17. Table 17: Netherland GCC Solar Photovoltaic Industry Revenue (Million) Forecast, by Application 2019 & 2032
  18. Table 18: Nordics GCC Solar Photovoltaic Industry Revenue (Million) Forecast, by Application 2019 & 2032
  19. Table 19: Rest of Europe GCC Solar Photovoltaic Industry Revenue (Million) Forecast, by Application 2019 & 2032
  20. Table 20: Global GCC Solar Photovoltaic Industry Revenue Million Forecast, by Country 2019 & 2032
  21. Table 21: China GCC Solar Photovoltaic Industry Revenue (Million) Forecast, by Application 2019 & 2032
  22. Table 22: Japan GCC Solar Photovoltaic Industry Revenue (Million) Forecast, by Application 2019 & 2032
  23. Table 23: India GCC Solar Photovoltaic Industry Revenue (Million) Forecast, by Application 2019 & 2032
  24. Table 24: South Korea GCC Solar Photovoltaic Industry Revenue (Million) Forecast, by Application 2019 & 2032
  25. Table 25: Southeast Asia GCC Solar Photovoltaic Industry Revenue (Million) Forecast, by Application 2019 & 2032
  26. Table 26: Australia GCC Solar Photovoltaic Industry Revenue (Million) Forecast, by Application 2019 & 2032
  27. Table 27: Indonesia GCC Solar Photovoltaic Industry Revenue (Million) Forecast, by Application 2019 & 2032
  28. Table 28: Phillipes GCC Solar Photovoltaic Industry Revenue (Million) Forecast, by Application 2019 & 2032
  29. Table 29: Singapore GCC Solar Photovoltaic Industry Revenue (Million) Forecast, by Application 2019 & 2032
  30. Table 30: Thailandc GCC Solar Photovoltaic Industry Revenue (Million) Forecast, by Application 2019 & 2032
  31. Table 31: Rest of Asia Pacific GCC Solar Photovoltaic Industry Revenue (Million) Forecast, by Application 2019 & 2032
  32. Table 32: Global GCC Solar Photovoltaic Industry Revenue Million Forecast, by Country 2019 & 2032
  33. Table 33: Brazil GCC Solar Photovoltaic Industry Revenue (Million) Forecast, by Application 2019 & 2032
  34. Table 34: Argentina GCC Solar Photovoltaic Industry Revenue (Million) Forecast, by Application 2019 & 2032
  35. Table 35: Peru GCC Solar Photovoltaic Industry Revenue (Million) Forecast, by Application 2019 & 2032
  36. Table 36: Chile GCC Solar Photovoltaic Industry Revenue (Million) Forecast, by Application 2019 & 2032
  37. Table 37: Colombia GCC Solar Photovoltaic Industry Revenue (Million) Forecast, by Application 2019 & 2032
  38. Table 38: Ecuador GCC Solar Photovoltaic Industry Revenue (Million) Forecast, by Application 2019 & 2032
  39. Table 39: Venezuela GCC Solar Photovoltaic Industry Revenue (Million) Forecast, by Application 2019 & 2032
  40. Table 40: Rest of South America GCC Solar Photovoltaic Industry Revenue (Million) Forecast, by Application 2019 & 2032
  41. Table 41: Global GCC Solar Photovoltaic Industry Revenue Million Forecast, by Country 2019 & 2032
  42. Table 42: United States GCC Solar Photovoltaic Industry Revenue (Million) Forecast, by Application 2019 & 2032
  43. Table 43: Canada GCC Solar Photovoltaic Industry Revenue (Million) Forecast, by Application 2019 & 2032
  44. Table 44: Mexico GCC Solar Photovoltaic Industry Revenue (Million) Forecast, by Application 2019 & 2032
  45. Table 45: Global GCC Solar Photovoltaic Industry Revenue Million Forecast, by Country 2019 & 2032
  46. Table 46: United Arab Emirates GCC Solar Photovoltaic Industry Revenue (Million) Forecast, by Application 2019 & 2032
  47. Table 47: Saudi Arabia GCC Solar Photovoltaic Industry Revenue (Million) Forecast, by Application 2019 & 2032
  48. Table 48: South Africa GCC Solar Photovoltaic Industry Revenue (Million) Forecast, by Application 2019 & 2032
  49. Table 49: Rest of Middle East and Africa GCC Solar Photovoltaic Industry Revenue (Million) Forecast, by Application 2019 & 2032
  50. Table 50: Global GCC Solar Photovoltaic Industry Revenue Million Forecast, by Deployment 2019 & 2032
  51. Table 51: Global GCC Solar Photovoltaic Industry Revenue Million Forecast, by Geography 2019 & 2032
  52. Table 52: Global GCC Solar Photovoltaic Industry Revenue Million Forecast, by Country 2019 & 2032
  53. Table 53: Global GCC Solar Photovoltaic Industry Revenue Million Forecast, by Deployment 2019 & 2032
  54. Table 54: Global GCC Solar Photovoltaic Industry Revenue Million Forecast, by Geography 2019 & 2032
  55. Table 55: Global GCC Solar Photovoltaic Industry Revenue Million Forecast, by Country 2019 & 2032
  56. Table 56: Global GCC Solar Photovoltaic Industry Revenue Million Forecast, by Deployment 2019 & 2032
  57. Table 57: Global GCC Solar Photovoltaic Industry Revenue Million Forecast, by Geography 2019 & 2032
  58. Table 58: Global GCC Solar Photovoltaic Industry Revenue Million Forecast, by Country 2019 & 2032


Frequently Asked Questions

1. What is the projected Compound Annual Growth Rate (CAGR) of the GCC Solar Photovoltaic Industry?

The projected CAGR is approximately > 12.50%.

2. Which companies are prominent players in the GCC Solar Photovoltaic Industry?

Key companies in the market include JinkoSolar Holding Co Ltd, First Solar Inc, Trina Solar Co Ltd, Echo Solar Panels Manufacturing LLC, Emirates Insolaire*List Not Exhaustive, Sunergy Solar, Canadian Solar Inc, Dubai Electricity and Water Authority, Masdar Abu Dhabi Future Energy Company, ACWA Power.

3. What are the main segments of the GCC Solar Photovoltaic Industry?

The market segments include Deployment, Geography.

4. Can you provide details about the market size?

The market size is estimated to be USD XX Million as of 2022.

5. What are some drivers contributing to market growth?

4.; Increasing Solar Energy Demand4.; Declining Cost of Solar PV Systems.

6. What are the notable trends driving market growth?

Utility Sector as a Significant Sector.

7. Are there any restraints impacting market growth?

4.; Strong Dependence on Prevailing Weather Condition.

8. Can you provide examples of recent developments in the market?

In April 2021, ACWA Power inaugurated the 300 MW Sakaka PV IPP, the country's first utility-scale renewable energy project, at an investment cost of SAR 1.2 billion. The project was awarded to ACWA Power at a record-breaking tariff of USD 2.3417 cents/kWh (8.781 halalas/kWh).

9. What pricing options are available for accessing the report?

Pricing options include single-user, multi-user, and enterprise licenses priced at USD 4750, USD 5250, and USD 8750 respectively.

10. Is the market size provided in terms of value or volume?

The market size is provided in terms of value, measured in Million.

11. Are there any specific market keywords associated with the report?

Yes, the market keyword associated with the report is "GCC Solar Photovoltaic Industry," which aids in identifying and referencing the specific market segment covered.

12. How do I determine which pricing option suits my needs best?

The pricing options vary based on user requirements and access needs. Individual users may opt for single-user licenses, while businesses requiring broader access may choose multi-user or enterprise licenses for cost-effective access to the report.

13. Are there any additional resources or data provided in the GCC Solar Photovoltaic Industry report?

While the report offers comprehensive insights, it's advisable to review the specific contents or supplementary materials provided to ascertain if additional resources or data are available.

14. How can I stay updated on further developments or reports in the GCC Solar Photovoltaic Industry?

To stay informed about further developments, trends, and reports in the GCC Solar Photovoltaic Industry, consider subscribing to industry newsletters, following relevant companies and organizations, or regularly checking reputable industry news sources and publications.


Methodology

Step 1 - Identification of Relevant Samples Size from Population Database

Step Chart
Bar Chart
Method Chart

Step 2 - Approaches for Defining Global Market Size (Value, Volume* & Price*)

Approach Chart
Top-down and bottom-up approaches are used to validate the global market size and estimate the market size for manufactures, regional segments, product, and application.

Note*: In applicable scenarios

Step 3 - Data Sources

Primary Research

  • Web Analytics
  • Survey Reports
  • Research Institute
  • Latest Research Reports
  • Opinion Leaders

Secondary Research

  • Annual Reports
  • White Paper
  • Latest Press Release
  • Industry Association
  • Paid Database
  • Investor Presentations
Analyst Chart

Step 4 - Data Triangulation

Involves using different sources of information in order to increase the validity of a study

These sources are likely to be stakeholders in a program - participants, other researchers, program staff, other community members, and so on.

Then we put all data in single framework & apply various statistical tools to find out the dynamic on the market.

During the analysis stage, feedback from the stakeholder groups would be compared to determine areas of agreement as well as areas of divergence

Additionally, after gathering mixed and scattered data from a wide range of sources, data is triangulated and correlated to come up with estimated figures which are further validated through primary mediums or industry experts, opinion leaders.

About Research Axiom

Research Axiom delivers in-depth market research, industry analysis, and consulting for pharmaceuticals, automotive, IT, and consumer goods. Our reports provide the clarity you need to make informed decisions and drive innovation.

Our team combines primary research, advanced analytics, and sector expertise to deliver actionable intelligence. We offer syndicated reports, custom research, and consulting services tailored to your business needs.

At Research Axiom, we are committed to quality, transparency, and client satisfaction. Every report is rigorously validated to ensure accuracy and relevance. Our global perspective and local expertise help you understand both the big picture and the finer details of your market.

Stay informed with Research Axiom. Subscribe to our newsletter for the latest updates and research highlights, and follow us on social media for real-time insights. Research Axiom – Turning Data into Business Advantage.

artwork spiralartwork spiralRelated Reports
artwork underline

Understanding Growth Trends in MEA Battery Industry Market

Explore the booming MEA battery market, projected to exceed $7.06 million by 2025 with a CAGR over 7%. Discover key drivers, trends like lithium-ion adoption, and market segments in Saudi Arabia, UAE, South Africa & more.

October 2025
Base Year: 2024
No Of Pages: 234
Price: $4750

South Asia Renewable Energy Industry 2025-2033 Overview: Trends, Competitor Dynamics, and Opportunities

The size of the South Asia Renewable Energy Industry market was valued at USD XX Million in 2024 and is projected to reach USD XXX Million by 2033, with an expected CAGR of 12.00">> 12.00% during the forecast period.

October 2025
Base Year: 2024
No Of Pages: 234
Price: $4750

Regional Insights into North America Smart Transformer Industry Market Growth

Explore the booming North American smart transformer market, driven by grid modernization, renewable energy, and increasing demand for intelligent power solutions. Discover market size, growth drivers, and key players shaping the future of electrical grids.

October 2025
Base Year: 2024
No Of Pages: 234
Price: $4750

Algeria Oil and Gas Downstream Industry Market Disruption Trends and Insights

Explore the dynamic Algeria Oil and Gas Downstream Industry market, projected for significant growth driven by refining upgrades and petrochemical expansion. Understand key trends and market size forecasts.

October 2025
Base Year: 2024
No Of Pages: 197
Price: $3800

Unlocking Growth in South Korea Oil & Gas Industry Market 2025-2033

The size of the South Korea Oil & Gas Industry market was valued at USD XX Million in 2024 and is projected to reach USD XXX Million by 2033, with an expected CAGR of 1.50">> 1.50% during the forecast period.

October 2025
Base Year: 2024
No Of Pages: 197
Price: $3800

Asia Pacific Air Quality Monitoring Market Strategic Dynamics: Competitor Analysis 2025-2033

The size of the Asia Pacific Air Quality Monitoring Market market was valued at USD 77.40 Million in 2024 and is projected to reach USD 105.68 Million by 2033, with an expected CAGR of 4.55% during the forecast period.

October 2025
Base Year: 2024
No Of Pages: 234
Price: $4750

Uzbekistan Power EPC Market CAGR Trends: Growth Outlook 2025-2033

The size of the Uzbekistan Power EPC Market market was valued at USD XX Million in 2024 and is projected to reach USD XXX Million by 2033, with an expected CAGR of 2.41% during the forecast period.

October 2025
Base Year: 2024
No Of Pages: 197
Price: $3800

Regional Insights into Industrial Demand Response Management Systems Market Market Growth

Explore the booming Industrial Demand Response Management Systems market, driven by smart grid adoption and energy efficiency trends. Discover market size, CAGR, key drivers, and regional growth.

October 2025
Base Year: 2024
No Of Pages: 234
Price: $4750

China Switchgear Market CAGR Growth Drivers and Trends: Forecasts 2025-2033

Explore the dynamic China Switchgear Market forecast, analyzing its USD 9.64 billion size and 4.39% CAGR. Discover key drivers like smart grids and renewables, market trends in GIS/AIS, and industry segments for 2025-2033.

October 2025
Base Year: 2024
No Of Pages: 197
Price: $3800

North America Completion Equipment And Services Market Competitive Advantage: Trends and Opportunities to 2033

Explore the North America Completion Equipment and Services Market analysis, identifying key drivers like energy demand and technological advancements. Discover market size, CAGR, restraints, and key companies shaping the future of oil and gas completions.

October 2025
Base Year: 2024
No Of Pages: 234
Price: $4750

Iran Oil and Gas Exploration and Production Industry Market Overview: Trends and Strategic Forecasts 2025-2033

Explore the robust Iran Oil and Gas Exploration and Production market outlook. Discover key drivers, emerging trends, and significant growth opportunities in this vital energy sector through 2033.

October 2025
Base Year: 2024
No Of Pages: 197
Price: $3800

Angola Oil and Gas Upstream Industry Planning for the Future: Key Trends 2025-2033

Explore the Angola Oil and Gas Upstream Industry market analysis, drivers, trends, and forecast. Discover growth opportunities in offshore and onshore exploration, with key insights into market size, CAGR, and major players like ExxonMobil and Chevron.

October 2025
Base Year: 2024
No Of Pages: 197
Price: $3800

Emerging Markets Driving Hydro Generators Industry Growth

Explore the booming Hydro Generators Industry market analysis, drivers, trends, and growth projections up to 2033. Discover key players and regional insights for this vital renewable energy sector.

October 2025
Base Year: 2024
No Of Pages: 234
Price: $4750

Water-Based Drilling and Completion Fluids Industry Decade Long Trends, Analysis and Forecast 2025-2033

The size of the Water-Based Drilling and Completion Fluids Industry market was valued at USD XX Million in 2024 and is projected to reach USD XXX Million by 2033, with an expected CAGR of 5.00">> 5.00% during the forecast period.

October 2025
Base Year: 2024
No Of Pages: 234
Price: $4750

Insights into LPG Industry in India Industry Dynamics

The size of the LPG Industry in India market was valued at USD XX Million in 2024 and is projected to reach USD XXX Million by 2033, with an expected CAGR of 3.50% during the forecast period.

October 2025
Base Year: 2024
No Of Pages: 197
Price: $3800

UK Geothermal Power Industry Drivers of Growth: Opportunities to 2033

Explore the burgeoning UK geothermal power market, driven by net-zero goals and technological innovation. Discover market size, growth drivers, key applications (power generation, direct heat), and leading companies.

October 2025
Base Year: 2024
No Of Pages: 197
Price: $3800

Growth Roadmap for Canada Waste to Energy Market Market 2025-2033

Explore the expanding Canadian Waste to Energy market. Discover key drivers, trends in thermal and biological technologies, and growth forecasts driven by sustainability and policy in Canada's waste management sector.

October 2025
Base Year: 2024
No Of Pages: 197
Price: $3800

Vietnam Oil and Gas Industry 2025 Market Trends and 2033 Forecasts: Exploring Growth Potential

Explore the dynamic Vietnam Oil and Gas Industry market analysis, drivers, trends, restraints, and key segments. Discover growth opportunities and major players shaping Vietnam's energy future.

September 2025
Base Year: 2024
No Of Pages: 197
Price: $3800

Direct Methanol Fuel Cells Market in North America: Market Dynamics and Forecasts 2025-2033

Explore the booming Direct Methanol Fuel Cell (DMFC) market, driven by innovation and demand for portable power. Discover market size, CAGR > 13%, key drivers, restraints, and regional insights for 2019-2033.

September 2025
Base Year: 2024
No Of Pages: 234
Price: $4750

Offshore Helicopter Services Market 2025-2033 Overview: Trends, Dynamics, and Growth Opportunities

The size of the Offshore Helicopter Services Market market was valued at USD 3.54 Million in 2024 and is projected to reach USD 4.63 Million by 2033, with an expected CAGR of 3.90% during the forecast period.

September 2025
Base Year: 2024
No Of Pages: 234
Price: $4750

Asia-Pacific Electrical Bushing Market Strategic Roadmap: Analysis and Forecasts 2025-2033

Explore the dynamic Asia-Pacific Electrical Bushing Market forecast from 2025-2033. Discover key drivers, trends, restraints, and market share for transformers and switchgears, featuring Oil Impregnated Paper and Resin Impregnated Paper bushings.

September 2025
Base Year: 2024
No Of Pages: 234
Price: $4750

Offshore Drilling Industry Future-proof Strategies: Trends, Competitor Dynamics, and Opportunities 2025-2033

Explore the global offshore drilling industry market size of USD 73.20 million, driven by increasing energy demand and technological advancements, with a CAGR of 6.78% from 2025-2033. Analyze key drivers, trends, restraints, and regional opportunities.

September 2025
Base Year: 2024
No Of Pages: 234
Price: $4750

Navigating Gas Market Market Growth 2025-2033

Explore the booming Gas Market, driven by over 50% CAGR and Power-to-X innovations. Discover key drivers, emerging trends, and market segments for sustainable energy solutions.

September 2025
Base Year: 2024
No Of Pages: 234
Price: $4750

Southeast Asia Hydropower Market XX CAGR Growth Outlook 2025-2033

Explore the dynamic Southeast Asia Hydropower Market, driven by rising energy demands and sustainable development. Discover key insights, market size projections, growth drivers, and leading companies shaping the future of renewable energy in the region.

September 2025
Base Year: 2024
No Of Pages: 234
Price: $4750

South-East Asia DC Distribution Network Market in North America: Market Dynamics and Forecasts 2025-2033

The size of the South-East Asia DC Distribution Network Market market was valued at USD XX Million in 2024 and is projected to reach USD XXX Million by 2033, with an expected CAGR of 5.50">> 5.50% during the forecast period.

September 2025
Base Year: 2024
No Of Pages: 234
Price: $4750

South Europe Renewable Energy Market Competitive Advantage: Trends and Opportunities to 2033

Explore the booming South Europe Renewable Energy Market (2025-2033) with insights on market size, drivers, trends, and leading companies in solar, wind, and hydropower.

September 2025
Base Year: 2024
No Of Pages: 234
Price: $4750

Asia-Pacific Offshore Energy Market Market Expansion: Growth Outlook 2025-2033

Explore the booming Asia-Pacific offshore energy market, driven by offshore wind, wave, and tidal power. Uncover market size, CAGR > 9%, key drivers, trends, and restraints shaping this crucial energy transition.

September 2025
Base Year: 2024
No Of Pages: 234
Price: $4750

Understanding Consumer Behavior in Netherlands Solar Energy Market Market: 2025-2033

Explore the booming Netherlands solar energy market, forecast for significant growth with key insights on drivers, trends, restraints, and market segments. Discover opportunities in PV and CSP technologies for residential, industrial, and utility applications.

September 2025
Base Year: 2024
No Of Pages: 197
Price: $3800

Strategic Analysis of Electric Two-wheeler Battery Market Industry Opportunities

The size of the Electric Two-wheeler Battery Market market was valued at USD 10.25 Million in 2024 and is projected to reach USD 32.90 Million by 2033, with an expected CAGR of 18.13% during the forecast period.

September 2025
Base Year: 2024
No Of Pages: 234
Price: $4750

Romania Power Industry Navigating Dynamics Comprehensive Analysis and Forecasts 2025-2033

Explore the dynamic Romanian power industry market forecast 2025-2033. Discover key insights on market size, CAGR 5.66%, drivers, restraints, and segments including renewables, hydropower, and T&D.

September 2025
Base Year: 2024
No Of Pages: 197
Price: $3800

Africa Refined Petroleum Products Market 2025-2033 Trends: Unveiling Growth Opportunities and Competitor Dynamics

Explore the dynamic Africa Refined Petroleum Products Market. Discover key growth drivers, market size projections exceeding $XX billion by 2033, and CAGR over 5.00%. Analyze segments, regional trends in Nigeria, Algeria, Egypt, South Africa, and the vast Rest of Africa. Essential for energy industry stakeholders.

September 2025
Base Year: 2024
No Of Pages: 234
Price: $4750

Analyzing Consumer Behavior in United Kingdom Nuclear Power Industry Market

The size of the United Kingdom Nuclear Power Industry market was valued at USD XX Million in 2024 and is projected to reach USD XXX Million by 2033, with an expected CAGR of 5.00">> 5.00% during the forecast period.

September 2025
Base Year: 2024
No Of Pages: 197
Price: $3800

United States Nuclear Power Plant Equipment Market Market Analysis and Growth Roadmap

Explore the robust growth of the United States Nuclear Power Plant Equipment Market. Discover key insights, market drivers, trends, and vital company information for this essential energy sector.

September 2025
Base Year: 2024
No Of Pages: 197
Price: $3800

GCC Solar Photovoltaic Industry Decoded: Comprehensive Analysis and Forecasts 2025-2033

Explore the booming GCC Solar Photovoltaic (PV) market, projected to exceed $15.5 billion with a CAGR over 12.5%. Discover key drivers, trends, and regional opportunities in UAE, Saudi Arabia, and the wider GCC for solar energy investment.

September 2025
Base Year: 2024
No Of Pages: 234
Price: $4750

Coiled Tubing Services Market Market Demand and Consumption Trends: Outlook 2025-2033

The size of the Coiled Tubing Services Market market was valued at USD XX Million in 2024 and is projected to reach USD XXX Million by 2033, with an expected CAGR of 6.00">> 6.00% during the forecast period.

September 2025
Base Year: 2024
No Of Pages: 234
Price: $4750

Construction Portable Generators Market Charting Growth Trajectories: Analysis and Forecasts 2025-2033

Explore the booming Construction Portable Generators Market, driven by urbanization and infrastructure growth. Discover key segments, power ratings, fuel types, and leading companies shaping this dynamic industry.

September 2025
Base Year: 2024
No Of Pages: 234
Price: $4750

Global Lithium-ion Battery Separator Market For Electric Vehicle Application Market’s Growth Catalysts

Explore the dynamic Global Lithium-ion Battery Separator Market for EV Applications. Discover market size, CAGR of 10.79%, key drivers, trends, and regional insights.

September 2025
Base Year: 2024
No Of Pages: 234
Price: $4750

Power Management Industry Innovations Shaping Market Growth 2025-2033

The size of the Power Management Industry market was valued at USD XX Million in 2024 and is projected to reach USD XXX Million by 2033, with an expected CAGR of 7.02% during the forecast period.

September 2025
Base Year: 2024
No Of Pages: 234
Price: $4750

Strategic Vision for United Arab Emirates Fuel Station Market Industry Trends

Explore the dynamic UAE fuel station market analysis from 2019-2033. Discover market size, CAGR of 2.21%, key drivers, trends, restraints, and leading companies in the United Arab Emirates.

September 2025
Base Year: 2024
No Of Pages: 197
Price: $3800

Comprehensive Overview of Europe Battery Market Trends: 2025-2033

The size of the Europe Battery Market market was valued at USD XX Million in 2024 and is projected to reach USD XXX Million by 2033, with an expected CAGR of 13.44% during the forecast period.

September 2025
Base Year: 2024
No Of Pages: 234
Price: $4750

Spent Fuel And Nuclear Waste Management Industry Consumer Behavior Dynamics: Key Trends 2025-2033

The size of the Spent Fuel And Nuclear Waste Management Industry market was valued at USD XX Million in 2024 and is projected to reach USD XXX Million by 2033, with an expected CAGR of % during the forecast period.

September 2025
Base Year: 2024
No Of Pages: 234
Price: $4750

Solid Control Equipment Market Navigating Dynamics Comprehensive Analysis and Forecasts 2025-2033

Explore the growing Solid Control Equipment market, driven by oil & gas demand and technological innovation. Get insights into market size, CAGR, key players, and regional trends through 2033.

September 2025
Base Year: 2024
No Of Pages: 234
Price: $4750

Unveiling Thailand Power Generation Industry Growth Patterns: CAGR Analysis and Forecasts 2025-2033

The size of the Thailand Power Generation Industry market was valued at USD XX Million in 2024 and is projected to reach USD XXX Million by 2033, with an expected CAGR of 5.80% during the forecast period.

September 2025
Base Year: 2024
No Of Pages: 197
Price: $3800

Austria Waste to Energy Industry Strategic Insights: Analysis 2025 and Forecasts 2033

Explore the booming Austrian Waste to Energy market analysis, including key drivers, trends, and growth projections for 2025-2033. Discover market size, CAGR, and technological advancements.

September 2025
Base Year: 2024
No Of Pages: 197
Price: $3800

United Kingdom Power Market Competitive Strategies: Trends and Forecasts 2025-2033

Explore the booming United Kingdom power market, driven by renewables and net-zero goals. Get insights into market size, CAGR, key drivers, restraints, and leading companies shaping the future of energy.

September 2025
Base Year: 2024
No Of Pages: 197
Price: $3800

Diesel Generator Industry Future-proof Strategies: Trends, Competitor Dynamics, and Opportunities 2025-2033

Explore the dynamic Diesel Generator market forecast 2025-2033, analyzing market size, CAGR 5.37%, key drivers, and restraints. Discover regional trends and segment insights for reliable power solutions.

September 2025
Base Year: 2024
No Of Pages: 234
Price: $4750

Strategic Vision for Spain Wind Energy Industry Industry Trends

The size of the Spain Wind Energy Industry market was valued at USD XX Million in 2024 and is projected to reach USD XXX Million by 2033, with an expected CAGR of 8.00">> 8.00% during the forecast period.

September 2025
Base Year: 2024
No Of Pages: 197
Price: $3800

South America Intelligent Pigging Market 2025-2033: Preparing for Growth and Change

Explore the robust growth of the South America Intelligent Pigging Market (2025-2033), driven by pipeline integrity, oil & gas inspection, and advanced leak detection technologies. Discover market drivers, trends, and key players.

September 2025
Base Year: 2024
No Of Pages: 234
Price: $4750

North America Natural Gas Market Unlocking Growth Potential: Analysis and Forecasts 2025-2033

The size of the North America Natural Gas Market market was valued at USD XX Million in 2024 and is projected to reach USD XXX Million by 2033, with an expected CAGR of 5.00">> 5.00% during the forecast period.

September 2025
Base Year: 2024
No Of Pages: 197
Price: $3800

Global Gear Market Projected to Grow at XX CAGR: Insights and Forecasts 2025-2033

The size of the Global Gear Market market was valued at USD 210 Million in 2024 and is projected to reach USD 311.00 Million by 2033, with an expected CAGR of 5.77% during the forecast period.

September 2025
Base Year: 2024
No Of Pages: 234
Price: $4750
  • Home
  • About Us
  • Industries
    • Aerospace & Defense
    • Agriculture
    • Animal Nutrition & Wellness
    • Automotive
    • Chemicals & Materials
    • Consumer Goods and Services
    • Energy & Power
    • Financial Services and Investment Intelligence
    • Food & Beverage
    • Home and Property Improvement
    • Hospitality and Tourism
    • Logistics
    • Manufacturing Products and Services
    • Packaging
    • Professional and Commercial Services
    • Real Estate and Construction
    • Retail
    • Technology, Media and Telecom
    • Healthcare
  • Services
  • Contact
Main Logo
  • Home
  • About Us
  • Industries
    • Aerospace & Defense
    • Agriculture
    • Animal Nutrition & Wellness
    • Automotive
    • Chemicals & Materials
    • Consumer Goods and Services
    • Energy & Power
    • Financial Services and Investment Intelligence
    • Food & Beverage
    • Home and Property Improvement
    • Hospitality and Tourism
    • Logistics
    • Manufacturing Products and Services
    • Packaging
    • Professional and Commercial Services
    • Real Estate and Construction
    • Retail
    • Technology, Media and Telecom
    • Healthcare
  • Services
  • Contact
+17162654855
[email protected]

+17162654855

[email protected]

Business Address

Head Office

Ansec House 3 rd floor Tank Road, Yerwada, Pune, Maharashtra 411014

Contact Information

Craig Francis

Business Development Head

+17162654855

[email protected]

Secure Payment Partners

payment image
RetailLogisticsPackagingAutomotiveHealthcareAgricultureEnergy & PowerFood & BeverageAerospace & DefenseChemicals & MaterialsHospitality and TourismAnimal Nutrition & WellnessConsumer Goods and ServicesReal Estate and ConstructionHome and Property ImprovementTechnology, Media and TelecomManufacturing Products and ServicesFinancial Services and Investment Intelligence

© 2025 PRDUA Research & Media Private Limited, All rights reserved

Privacy Policy
Terms and Conditions
FAQ