

Key Insights
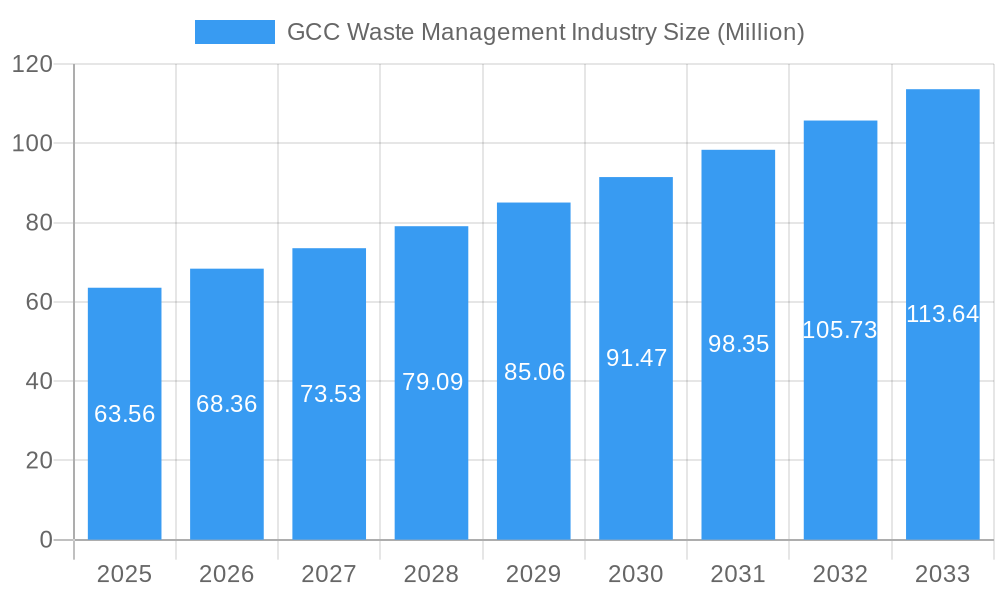
The GCC waste management market, valued at $63.56 million in 2025, is experiencing robust growth, projected to expand at a Compound Annual Growth Rate (CAGR) of 7.38% from 2025 to 2033. This growth is fueled by several key drivers. Increasing urbanization across the GCC nations is leading to a surge in waste generation, necessitating advanced and efficient waste management solutions. Stricter government regulations promoting environmental sustainability and waste reduction initiatives are also playing a crucial role. Furthermore, rising environmental awareness among citizens and a growing focus on recycling and resource recovery are contributing to market expansion. Key market trends include the adoption of innovative technologies such as waste-to-energy plants and advanced sorting facilities, a shift towards public-private partnerships for infrastructure development, and a growing demand for specialized waste management services catering to specific industries like healthcare and construction.
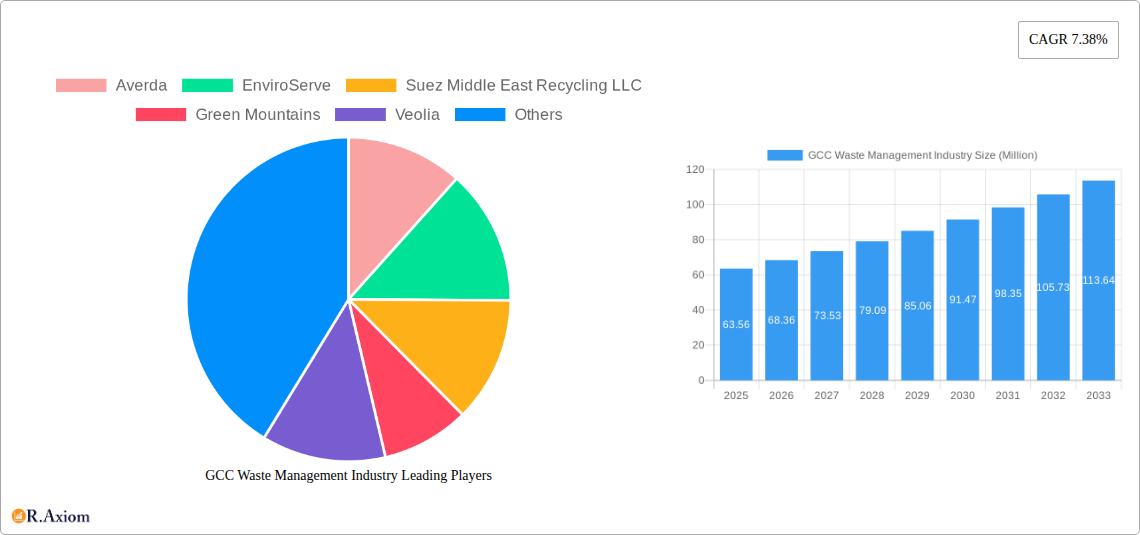
GCC Waste Management Industry Market Size (In Million)
However, challenges remain. High infrastructure costs associated with establishing and maintaining modern waste management facilities pose a significant restraint. The market also faces challenges related to inconsistent waste segregation practices among the population, hindering efficient recycling and resource recovery efforts. Addressing these challenges through public awareness campaigns, incentivizing proper waste disposal, and fostering collaboration between stakeholders is critical for realizing the full potential of the GCC waste management sector. The competitive landscape is dynamic, with both international giants like Suez and Veolia, and regional players such as Averda, Bee'ah, and Dulsco, vying for market share. The market's future hinges on successfully navigating the interplay of technological advancements, regulatory frameworks, and evolving consumer behavior.
GCC Waste Management Industry Company Market Share
GCC Waste Management Industry: A Comprehensive Market Report (2019-2033)
This detailed report provides a comprehensive analysis of the GCC waste management industry, covering market size, growth drivers, challenges, and future opportunities. The study period spans from 2019 to 2033, with 2025 serving as both the base and estimated year. The forecast period is 2025-2033, and the historical period encompasses 2019-2024. This report is essential for industry stakeholders, investors, and policymakers seeking actionable insights into this dynamic market.
GCC Waste Management Industry Market Concentration & Innovation
The GCC waste management market exhibits a moderately concentrated landscape, with several large players and numerous smaller regional operators. Market share data for 2025 indicates that the top 5 players (Averda, Bee'ah, Suez Middle East Recycling LLC, Veolia, and Dulsco Waste Management Services) collectively hold approximately xx% of the market. However, significant fragmentation exists among smaller companies specializing in niche services or regional markets.
Innovation in the sector is driven by several factors:
- Stringent environmental regulations: GCC governments are increasingly enforcing stricter waste management regulations, pushing companies to adopt innovative technologies and sustainable practices.
- Technological advancements: The adoption of advanced technologies such as AI-powered waste sorting, waste-to-energy solutions, and smart waste management systems is transforming the industry.
- Rising environmental awareness: Growing public awareness about environmental sustainability is driving demand for eco-friendly waste management solutions.
Mergers and acquisitions (M&A) activity has been moderate. Recent deals include xx Million USD deal between [Company A] and [Company B] focused on expanding [service type] capabilities and an estimated xx Million USD deal between [Company C] and [Company D] for market consolidation in [geographic area]. These activities reflect a trend of consolidation and expansion within the sector. Product substitution is evident with the increasing use of recyclable materials and compostable alternatives.
GCC Waste Management Industry Industry Trends & Insights
The GCC waste management industry is experiencing robust and dynamic growth, driven by a confluence of powerful trends and a significant shift towards environmental stewardship. This evolution is reshaping how waste is handled and perceived across the region.
- Rapid Urbanization and Population Growth: As GCC cities continue to expand and attract a growing population, the volume of municipal solid waste (MSW) is escalating. This necessitates the development and implementation of more sophisticated and scalable waste management solutions to cope with the increased generation rates.
- Sustained Economic Development and Diversification: The ongoing economic diversification efforts and large-scale infrastructure projects across the GCC are not only fostering industrial growth but also contributing to a more complex waste stream. This includes industrial, commercial, and construction and demolition (C&D) waste, demanding specialized management approaches.
- Proactive Government Initiatives and Policy Frameworks: Governments throughout the GCC are demonstrating strong commitment to sustainability through comprehensive policy development, substantial investments in green infrastructure, and widespread public awareness campaigns. This proactive stance is successfully steering the industry away from traditional landfill-reliant models towards integrated waste management systems that prioritize reduction, reuse, recycling, and energy recovery.
The market is currently undergoing a significant technological transformation. The adoption of advanced waste-to-energy (WtE) technologies, such as incineration with energy recovery and anaerobic digestion, is gaining momentum. Furthermore, the integration of smart bins, real-time tracking systems, and data-driven digital waste management platforms is revolutionizing operational efficiency and resource optimization. Consumer preferences are increasingly aligning with environmentally responsible and convenient waste disposal and recycling options. The competitive landscape is dynamic, with established global and regional players continuously innovating to meet evolving demands, while new entrants are introducing disruptive, cost-effective, and sustainable solutions. The Compound Annual Growth Rate (CAGR) for the GCC waste management industry during the forecast period (2025-2033) is projected to be robust, with significant growth anticipated, and the penetration of sustainable waste management practices expected to reach substantial levels by 2033.
Dominant Markets & Segments in GCC Waste Management Industry
The UAE and Saudi Arabia are the leading markets for waste management in the GCC, owing to their larger populations, higher economic activity, and robust infrastructure development.
Key Drivers for Dominance:
- Strong government support: Both countries have implemented comprehensive waste management strategies, incentivizing private sector investment and promoting technological advancements.
- Advanced infrastructure: The UAE and Saudi Arabia possess relatively advanced waste management infrastructure compared to other GCC countries.
- Higher waste generation: The higher levels of economic activity and population density in these two countries lead to greater waste generation, creating a larger market for waste management services.
Detailed analysis reveals a higher concentration of large-scale waste management companies in these two nations, coupled with substantial investments in new technologies and infrastructure projects. The municipal solid waste (MSW) segment constitutes the largest share of the market, followed by industrial waste and hazardous waste. The construction and demolition waste segments are also experiencing significant growth due to ongoing infrastructure projects.
GCC Waste Management Industry Product Developments
Recent product innovations include advanced waste sorting technologies using AI and machine learning, enabling greater efficiency and recovery of recyclable materials. Waste-to-energy plants are being increasingly deployed to convert waste into renewable energy, reducing landfill dependency and contributing to sustainability goals. Smart bins equipped with sensors and IoT capabilities are being implemented to optimize waste collection routes and improve efficiency. These developments offer significant competitive advantages, addressing market needs for efficient, sustainable, and cost-effective waste management solutions.
Report Scope & Segmentation Analysis
This report segments the GCC waste management market based on several factors, including:
Waste Type: Municipal solid waste (MSW), industrial waste, hazardous waste, construction and demolition waste, e-waste, medical waste. The MSW segment is expected to witness the highest growth, driven by increasing urbanization.
Service Type: Collection, transportation, processing, recycling, disposal, waste-to-energy. The waste-to-energy segment is gaining traction due to environmental concerns and the potential for revenue generation.
Technology: Traditional methods, advanced technologies (e.g., AI-powered sorting, anaerobic digestion). The adoption of advanced technologies is rapidly accelerating.
Each segment's growth projections, market sizes, and competitive dynamics are analyzed in detail within the report.
Key Drivers of GCC Waste Management Industry Growth
The accelerated growth of the GCC waste management industry is propelled by several interconnected and influential factors:
- Stringent Government Regulations and Enforcement: Robust environmental legislation and clear policy directives are compelling businesses and municipalities to adopt higher standards for waste handling, treatment, and disposal, thereby driving investment in compliant solutions.
- Technological Advancements and Innovation: Continuous innovation in waste processing, sorting, and energy recovery technologies, particularly in areas like advanced WtE, material recovery facilities (MRFs), and digital monitoring, is enhancing efficiency, reducing environmental impact, and unlocking new value streams.
- Significant Private Sector Investment and Partnerships: The increasing involvement and substantial capital injections from private sector entities are crucial for expanding the industry's capacity, upgrading infrastructure, and fostering the development of specialized waste management services.
- Heightened Public Awareness and Corporate Social Responsibility: A growing societal consciousness regarding environmental sustainability and the principles of a circular economy is fueling demand for eco-friendly waste management solutions, alongside a stronger emphasis on Corporate Social Responsibility (CSR) initiatives.
Challenges in the GCC Waste Management Industry Sector
The GCC waste management industry faces several challenges:
- High landfill reliance: Many GCC countries still heavily rely on landfills, which are unsustainable in the long term.
- Lack of skilled workforce: A shortage of skilled professionals is hampering the efficient implementation of advanced technologies.
- High operating costs: The costs associated with waste collection, processing, and disposal can be significant, particularly for remote areas.
- Water scarcity: Many areas face challenges managing waste effectively due to water scarcity, affecting certain technologies.
Emerging Opportunities in GCC Waste Management Industry
The evolving landscape of waste management in the GCC presents a wealth of exciting and profitable opportunities for forward-thinking organizations:
- Waste-to-Energy (WtE) Solutions: The strategic imperative to reduce landfill dependency and generate clean energy makes WtE technologies a prime growth area, offering significant potential for renewable energy production and resource valorization.
- Enhanced Recycling and Advanced Resource Recovery: Opportunities abound in improving the efficiency and scope of recycling programs, as well as in developing sophisticated methods for recovering valuable materials and components from diverse waste streams, creating new revenue streams and supporting a circular economy.
- Digitalization and Smart Waste Management: The implementation of IoT-enabled smart bins, AI-powered route optimization, sophisticated data analytics platforms, and integrated management software offers immense potential to streamline operations, reduce costs, improve service delivery, and enhance transparency.
- Circular Economy Models and Extended Producer Responsibility (EPR): The strategic transition towards circular economy principles, focusing on waste prevention, product longevity, reuse, and comprehensive recycling, alongside the implementation of EPR schemes, opens up significant avenues for innovation and sustainable business development.
Leading Players in the GCC Waste Management Industry Market
- Averda
- EnviroServe
- Suez Middle East Recycling LLC
- Green Mountains
- Veolia
- Blue LLC
- Envac
- SEPCO Environment
- Wasco
- Saudi Investment Recycling Company
- Dulsco Waste Management Services
- Bee'ah
- Power Waste Management and Transport LLC
- Al Haya Enviro
- Bin-Ovation
- United Waste Management Company
- Kuwait Waste Collection and Recycling Company
List Not Exhaustive
Key Developments in GCC Waste Management Industry Industry
- December 2023: Wardwizard Innovations and Mobility partnered with BEEAH Group to promote electric vehicles in the GCC and Africa, impacting waste collection vehicle technology.
- October 2022: Marafiq began construction of a new sewage treatment plant at Jeddah Airport II (300,000 m3/d capacity, expandable to 500,000 m3/d), signifying investments in wastewater management infrastructure.
- September 2022: Ashghal awarded a USD 1.48 billion contract for a 150,000 cubic meter per day sewage treatment facility in Qatar, highlighting significant public-private partnerships in the sector.
Strategic Outlook for GCC Waste Management Industry Market
The GCC waste management industry is on an upward trajectory, poised for substantial expansion and transformation. This growth is underpinned by the synergistic forces of escalating urbanization, robust economic development, and increasingly stringent environmental regulations that prioritize sustainability. The widespread adoption of cutting-edge technologies, coupled with unwavering governmental support and strategic private sector investments, will undoubtedly act as catalysts for accelerated market evolution. The industry's future will be defined by its commitment to sustainable waste management practices, the proactive embrace of circular economy principles, and the significant development of waste-to-energy solutions. These factors will collectively create a fertile ground for lucrative opportunities, fostering innovation and growth for both established industry leaders and emerging pioneers.
GCC Waste Management Industry Segmentation
-
1. Waste Type
- 1.1. Industrial Waste
- 1.2. Municipal Solid Waste
- 1.3. Hazardous Waste
- 1.4. E-Waste
- 1.5. Plastic Waste
- 1.6. Bio-Medical Waste
-
2. Disposal Method
- 2.1. Collection
- 2.2. Landfills
- 2.3. Incineration
- 2.4. Recycling
GCC Waste Management Industry Segmentation By Geography
-
1. North America
- 1.1. United States
- 1.2. Canada
- 1.3. Mexico
-
2. South America
- 2.1. Brazil
- 2.2. Argentina
- 2.3. Rest of South America
-
3. Europe
- 3.1. United Kingdom
- 3.2. Germany
- 3.3. France
- 3.4. Italy
- 3.5. Spain
- 3.6. Russia
- 3.7. Benelux
- 3.8. Nordics
- 3.9. Rest of Europe
-
4. Middle East & Africa
- 4.1. Turkey
- 4.2. Israel
- 4.3. GCC
- 4.4. North Africa
- 4.5. South Africa
- 4.6. Rest of Middle East & Africa
-
5. Asia Pacific
- 5.1. China
- 5.2. India
- 5.3. Japan
- 5.4. South Korea
- 5.5. ASEAN
- 5.6. Oceania
- 5.7. Rest of Asia Pacific
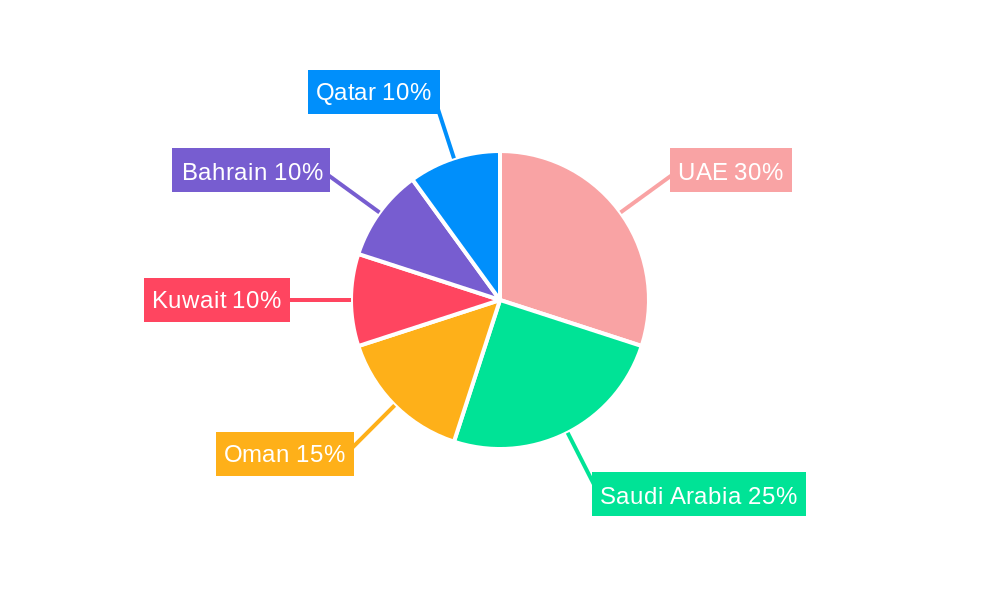
GCC Waste Management Industry Regional Market Share
Geographic Coverage of GCC Waste Management Industry
GCC Waste Management Industry REPORT HIGHLIGHTS
| Aspects | Details |
|---|---|
| Study Period | 2020-2034 |
| Base Year | 2025 |
| Estimated Year | 2026 |
| Forecast Period | 2026-2034 |
| Historical Period | 2020-2025 |
| Growth Rate | CAGR of 7.38% from 2020-2034 |
| Segmentation |
|
Table of Contents
- 1. Introduction
- 1.1. Research Scope
- 1.2. Market Segmentation
- 1.3. Research Objective
- 1.4. Definitions and Assumptions
- 2. Executive Summary
- 2.1. Market Snapshot
- 3. Market Dynamics
- 3.1. Market Drivers
- 3.2. Market Restrains
- 3.3. Market Trends
- 3.4. Market Opportunities
- 4. Market Factor Analysis
- 4.1. Porters Five Forces
- 4.1.1. Bargaining Power of Suppliers
- 4.1.2. Bargaining Power of Buyers
- 4.1.3. Threat of New Entrants
- 4.1.4. Threat of Substitutes
- 4.1.5. Competitive Rivalry
- 4.2. PESTEL analysis
- 4.3. BCG Analysis
- 4.3.1. Stars (High Growth, High Market Share)
- 4.3.2. Cash Cows (Low Growth, High Market Share)
- 4.3.3. Question Mark (High Growth, Low Market Share)
- 4.3.4. Dogs (Low Growth, Low Market Share)
- 4.4. Ansoff Matrix Analysis
- 4.5. Supply Chain Analysis
- 4.6. Regulatory Landscape
- 4.7. Current Market Potential and Opportunity Assessment (TAM–SAM–SOM Framework)
- 4.8. RAX Analyst Note
- 4.1. Porters Five Forces
- 5. Market Analysis, Insights and Forecast 2021-2033
- 5.1. Market Analysis, Insights and Forecast - by Waste Type
- 5.1.1. Industrial Waste
- 5.1.2. Municipal Solid Waste
- 5.1.3. Hazardous Waste
- 5.1.4. E-Waste
- 5.1.5. Plastic Waste
- 5.1.6. Bio-Medical Waste
- 5.2. Market Analysis, Insights and Forecast - by Disposal Method
- 5.2.1. Collection
- 5.2.2. Landfills
- 5.2.3. Incineration
- 5.2.4. Recycling
- 5.3. Market Analysis, Insights and Forecast - by Region
- 5.3.1. North America
- 5.3.2. South America
- 5.3.3. Europe
- 5.3.4. Middle East & Africa
- 5.3.5. Asia Pacific
- 5.1. Market Analysis, Insights and Forecast - by Waste Type
- 6. Global GCC Waste Management Industry Analysis, Insights and Forecast, 2021-2033
- 6.1. Market Analysis, Insights and Forecast - by Waste Type
- 6.1.1. Industrial Waste
- 6.1.2. Municipal Solid Waste
- 6.1.3. Hazardous Waste
- 6.1.4. E-Waste
- 6.1.5. Plastic Waste
- 6.1.6. Bio-Medical Waste
- 6.2. Market Analysis, Insights and Forecast - by Disposal Method
- 6.2.1. Collection
- 6.2.2. Landfills
- 6.2.3. Incineration
- 6.2.4. Recycling
- 6.1. Market Analysis, Insights and Forecast - by Waste Type
- 7. North America GCC Waste Management Industry Analysis, Insights and Forecast, 2020-2032
- 7.1. Market Analysis, Insights and Forecast - by Waste Type
- 7.1.1. Industrial Waste
- 7.1.2. Municipal Solid Waste
- 7.1.3. Hazardous Waste
- 7.1.4. E-Waste
- 7.1.5. Plastic Waste
- 7.1.6. Bio-Medical Waste
- 7.2. Market Analysis, Insights and Forecast - by Disposal Method
- 7.2.1. Collection
- 7.2.2. Landfills
- 7.2.3. Incineration
- 7.2.4. Recycling
- 7.1. Market Analysis, Insights and Forecast - by Waste Type
- 8. South America GCC Waste Management Industry Analysis, Insights and Forecast, 2020-2032
- 8.1. Market Analysis, Insights and Forecast - by Waste Type
- 8.1.1. Industrial Waste
- 8.1.2. Municipal Solid Waste
- 8.1.3. Hazardous Waste
- 8.1.4. E-Waste
- 8.1.5. Plastic Waste
- 8.1.6. Bio-Medical Waste
- 8.2. Market Analysis, Insights and Forecast - by Disposal Method
- 8.2.1. Collection
- 8.2.2. Landfills
- 8.2.3. Incineration
- 8.2.4. Recycling
- 8.1. Market Analysis, Insights and Forecast - by Waste Type
- 9. Europe GCC Waste Management Industry Analysis, Insights and Forecast, 2020-2032
- 9.1. Market Analysis, Insights and Forecast - by Waste Type
- 9.1.1. Industrial Waste
- 9.1.2. Municipal Solid Waste
- 9.1.3. Hazardous Waste
- 9.1.4. E-Waste
- 9.1.5. Plastic Waste
- 9.1.6. Bio-Medical Waste
- 9.2. Market Analysis, Insights and Forecast - by Disposal Method
- 9.2.1. Collection
- 9.2.2. Landfills
- 9.2.3. Incineration
- 9.2.4. Recycling
- 9.1. Market Analysis, Insights and Forecast - by Waste Type
- 10. Middle East & Africa GCC Waste Management Industry Analysis, Insights and Forecast, 2020-2032
- 10.1. Market Analysis, Insights and Forecast - by Waste Type
- 10.1.1. Industrial Waste
- 10.1.2. Municipal Solid Waste
- 10.1.3. Hazardous Waste
- 10.1.4. E-Waste
- 10.1.5. Plastic Waste
- 10.1.6. Bio-Medical Waste
- 10.2. Market Analysis, Insights and Forecast - by Disposal Method
- 10.2.1. Collection
- 10.2.2. Landfills
- 10.2.3. Incineration
- 10.2.4. Recycling
- 10.1. Market Analysis, Insights and Forecast - by Waste Type
- 11. Asia Pacific GCC Waste Management Industry Analysis, Insights and Forecast, 2020-2032
- 11.1. Market Analysis, Insights and Forecast - by Waste Type
- 11.1.1. Industrial Waste
- 11.1.2. Municipal Solid Waste
- 11.1.3. Hazardous Waste
- 11.1.4. E-Waste
- 11.1.5. Plastic Waste
- 11.1.6. Bio-Medical Waste
- 11.2. Market Analysis, Insights and Forecast - by Disposal Method
- 11.2.1. Collection
- 11.2.2. Landfills
- 11.2.3. Incineration
- 11.2.4. Recycling
- 11.1. Market Analysis, Insights and Forecast - by Waste Type
- 12. Competitive Analysis
- 12.1. Company Profiles
- 12.1.1 Averda
- 12.1.1.1. Company Overview
- 12.1.1.2. Products
- 12.1.1.3. Company Financials
- 12.1.1.4. SWOT Analysis
- 12.1.2 EnviroServe
- 12.1.2.1. Company Overview
- 12.1.2.2. Products
- 12.1.2.3. Company Financials
- 12.1.2.4. SWOT Analysis
- 12.1.3 Suez Middle East Recycling LLC
- 12.1.3.1. Company Overview
- 12.1.3.2. Products
- 12.1.3.3. Company Financials
- 12.1.3.4. SWOT Analysis
- 12.1.4 Green Mountains
- 12.1.4.1. Company Overview
- 12.1.4.2. Products
- 12.1.4.3. Company Financials
- 12.1.4.4. SWOT Analysis
- 12.1.5 Veolia
- 12.1.5.1. Company Overview
- 12.1.5.2. Products
- 12.1.5.3. Company Financials
- 12.1.5.4. SWOT Analysis
- 12.1.6 Blue LLC
- 12.1.6.1. Company Overview
- 12.1.6.2. Products
- 12.1.6.3. Company Financials
- 12.1.6.4. SWOT Analysis
- 12.1.7 Envac
- 12.1.7.1. Company Overview
- 12.1.7.2. Products
- 12.1.7.3. Company Financials
- 12.1.7.4. SWOT Analysis
- 12.1.8 SEPCO Environment
- 12.1.8.1. Company Overview
- 12.1.8.2. Products
- 12.1.8.3. Company Financials
- 12.1.8.4. SWOT Analysis
- 12.1.9 Wasco
- 12.1.9.1. Company Overview
- 12.1.9.2. Products
- 12.1.9.3. Company Financials
- 12.1.9.4. SWOT Analysis
- 12.1.10 Saudi Investment Recycling Company
- 12.1.10.1. Company Overview
- 12.1.10.2. Products
- 12.1.10.3. Company Financials
- 12.1.10.4. SWOT Analysis
- 12.1.11 Dulsco Waste Management Services
- 12.1.11.1. Company Overview
- 12.1.11.2. Products
- 12.1.11.3. Company Financials
- 12.1.11.4. SWOT Analysis
- 12.1.12 Bee'ah
- 12.1.12.1. Company Overview
- 12.1.12.2. Products
- 12.1.12.3. Company Financials
- 12.1.12.4. SWOT Analysis
- 12.1.13 Power Waste Management and Transport LLC
- 12.1.13.1. Company Overview
- 12.1.13.2. Products
- 12.1.13.3. Company Financials
- 12.1.13.4. SWOT Analysis
- 12.1.14 Al Haya Enviro
- 12.1.14.1. Company Overview
- 12.1.14.2. Products
- 12.1.14.3. Company Financials
- 12.1.14.4. SWOT Analysis
- 12.1.15 Bin-Ovation
- 12.1.15.1. Company Overview
- 12.1.15.2. Products
- 12.1.15.3. Company Financials
- 12.1.15.4. SWOT Analysis
- 12.1.16 United Waste Management Company
- 12.1.16.1. Company Overview
- 12.1.16.2. Products
- 12.1.16.3. Company Financials
- 12.1.16.4. SWOT Analysis
- 12.1.17 Kuwait Waste Collection and Recycling Company**List Not Exhaustive
- 12.1.17.1. Company Overview
- 12.1.17.2. Products
- 12.1.17.3. Company Financials
- 12.1.17.4. SWOT Analysis
- 12.1.1 Averda
- 12.2. Market Entropy
- 12.2.1 Company's Key Areas Served
- 12.2.2 Recent Developments
- 12.3. Company Market Share Analysis 2025
- 12.3.1 Top 5 Companies Market Share Analysis
- 12.3.2 Top 3 Companies Market Share Analysis
- 12.4. List of Potential Customers
- 13. Research Methodology
List of Figures
- Figure 1: Global GCC Waste Management Industry Revenue Breakdown (Million, %) by Region 2025 & 2033
- Figure 2: Global GCC Waste Management Industry Volume Breakdown (Billion, %) by Region 2025 & 2033
- Figure 3: North America GCC Waste Management Industry Revenue (Million), by Waste Type 2025 & 2033
- Figure 4: North America GCC Waste Management Industry Volume (Billion), by Waste Type 2025 & 2033
- Figure 5: North America GCC Waste Management Industry Revenue Share (%), by Waste Type 2025 & 2033
- Figure 6: North America GCC Waste Management Industry Volume Share (%), by Waste Type 2025 & 2033
- Figure 7: North America GCC Waste Management Industry Revenue (Million), by Disposal Method 2025 & 2033
- Figure 8: North America GCC Waste Management Industry Volume (Billion), by Disposal Method 2025 & 2033
- Figure 9: North America GCC Waste Management Industry Revenue Share (%), by Disposal Method 2025 & 2033
- Figure 10: North America GCC Waste Management Industry Volume Share (%), by Disposal Method 2025 & 2033
- Figure 11: North America GCC Waste Management Industry Revenue (Million), by Country 2025 & 2033
- Figure 12: North America GCC Waste Management Industry Volume (Billion), by Country 2025 & 2033
- Figure 13: North America GCC Waste Management Industry Revenue Share (%), by Country 2025 & 2033
- Figure 14: North America GCC Waste Management Industry Volume Share (%), by Country 2025 & 2033
- Figure 15: South America GCC Waste Management Industry Revenue (Million), by Waste Type 2025 & 2033
- Figure 16: South America GCC Waste Management Industry Volume (Billion), by Waste Type 2025 & 2033
- Figure 17: South America GCC Waste Management Industry Revenue Share (%), by Waste Type 2025 & 2033
- Figure 18: South America GCC Waste Management Industry Volume Share (%), by Waste Type 2025 & 2033
- Figure 19: South America GCC Waste Management Industry Revenue (Million), by Disposal Method 2025 & 2033
- Figure 20: South America GCC Waste Management Industry Volume (Billion), by Disposal Method 2025 & 2033
- Figure 21: South America GCC Waste Management Industry Revenue Share (%), by Disposal Method 2025 & 2033
- Figure 22: South America GCC Waste Management Industry Volume Share (%), by Disposal Method 2025 & 2033
- Figure 23: South America GCC Waste Management Industry Revenue (Million), by Country 2025 & 2033
- Figure 24: South America GCC Waste Management Industry Volume (Billion), by Country 2025 & 2033
- Figure 25: South America GCC Waste Management Industry Revenue Share (%), by Country 2025 & 2033
- Figure 26: South America GCC Waste Management Industry Volume Share (%), by Country 2025 & 2033
- Figure 27: Europe GCC Waste Management Industry Revenue (Million), by Waste Type 2025 & 2033
- Figure 28: Europe GCC Waste Management Industry Volume (Billion), by Waste Type 2025 & 2033
- Figure 29: Europe GCC Waste Management Industry Revenue Share (%), by Waste Type 2025 & 2033
- Figure 30: Europe GCC Waste Management Industry Volume Share (%), by Waste Type 2025 & 2033
- Figure 31: Europe GCC Waste Management Industry Revenue (Million), by Disposal Method 2025 & 2033
- Figure 32: Europe GCC Waste Management Industry Volume (Billion), by Disposal Method 2025 & 2033
- Figure 33: Europe GCC Waste Management Industry Revenue Share (%), by Disposal Method 2025 & 2033
- Figure 34: Europe GCC Waste Management Industry Volume Share (%), by Disposal Method 2025 & 2033
- Figure 35: Europe GCC Waste Management Industry Revenue (Million), by Country 2025 & 2033
- Figure 36: Europe GCC Waste Management Industry Volume (Billion), by Country 2025 & 2033
- Figure 37: Europe GCC Waste Management Industry Revenue Share (%), by Country 2025 & 2033
- Figure 38: Europe GCC Waste Management Industry Volume Share (%), by Country 2025 & 2033
- Figure 39: Middle East & Africa GCC Waste Management Industry Revenue (Million), by Waste Type 2025 & 2033
- Figure 40: Middle East & Africa GCC Waste Management Industry Volume (Billion), by Waste Type 2025 & 2033
- Figure 41: Middle East & Africa GCC Waste Management Industry Revenue Share (%), by Waste Type 2025 & 2033
- Figure 42: Middle East & Africa GCC Waste Management Industry Volume Share (%), by Waste Type 2025 & 2033
- Figure 43: Middle East & Africa GCC Waste Management Industry Revenue (Million), by Disposal Method 2025 & 2033
- Figure 44: Middle East & Africa GCC Waste Management Industry Volume (Billion), by Disposal Method 2025 & 2033
- Figure 45: Middle East & Africa GCC Waste Management Industry Revenue Share (%), by Disposal Method 2025 & 2033
- Figure 46: Middle East & Africa GCC Waste Management Industry Volume Share (%), by Disposal Method 2025 & 2033
- Figure 47: Middle East & Africa GCC Waste Management Industry Revenue (Million), by Country 2025 & 2033
- Figure 48: Middle East & Africa GCC Waste Management Industry Volume (Billion), by Country 2025 & 2033
- Figure 49: Middle East & Africa GCC Waste Management Industry Revenue Share (%), by Country 2025 & 2033
- Figure 50: Middle East & Africa GCC Waste Management Industry Volume Share (%), by Country 2025 & 2033
- Figure 51: Asia Pacific GCC Waste Management Industry Revenue (Million), by Waste Type 2025 & 2033
- Figure 52: Asia Pacific GCC Waste Management Industry Volume (Billion), by Waste Type 2025 & 2033
- Figure 53: Asia Pacific GCC Waste Management Industry Revenue Share (%), by Waste Type 2025 & 2033
- Figure 54: Asia Pacific GCC Waste Management Industry Volume Share (%), by Waste Type 2025 & 2033
- Figure 55: Asia Pacific GCC Waste Management Industry Revenue (Million), by Disposal Method 2025 & 2033
- Figure 56: Asia Pacific GCC Waste Management Industry Volume (Billion), by Disposal Method 2025 & 2033
- Figure 57: Asia Pacific GCC Waste Management Industry Revenue Share (%), by Disposal Method 2025 & 2033
- Figure 58: Asia Pacific GCC Waste Management Industry Volume Share (%), by Disposal Method 2025 & 2033
- Figure 59: Asia Pacific GCC Waste Management Industry Revenue (Million), by Country 2025 & 2033
- Figure 60: Asia Pacific GCC Waste Management Industry Volume (Billion), by Country 2025 & 2033
- Figure 61: Asia Pacific GCC Waste Management Industry Revenue Share (%), by Country 2025 & 2033
- Figure 62: Asia Pacific GCC Waste Management Industry Volume Share (%), by Country 2025 & 2033
List of Tables
- Table 1: Global GCC Waste Management Industry Revenue Million Forecast, by Waste Type 2020 & 2033
- Table 2: Global GCC Waste Management Industry Volume Billion Forecast, by Waste Type 2020 & 2033
- Table 3: Global GCC Waste Management Industry Revenue Million Forecast, by Disposal Method 2020 & 2033
- Table 4: Global GCC Waste Management Industry Volume Billion Forecast, by Disposal Method 2020 & 2033
- Table 5: Global GCC Waste Management Industry Revenue Million Forecast, by Region 2020 & 2033
- Table 6: Global GCC Waste Management Industry Volume Billion Forecast, by Region 2020 & 2033
- Table 7: Global GCC Waste Management Industry Revenue Million Forecast, by Waste Type 2020 & 2033
- Table 8: Global GCC Waste Management Industry Volume Billion Forecast, by Waste Type 2020 & 2033
- Table 9: Global GCC Waste Management Industry Revenue Million Forecast, by Disposal Method 2020 & 2033
- Table 10: Global GCC Waste Management Industry Volume Billion Forecast, by Disposal Method 2020 & 2033
- Table 11: Global GCC Waste Management Industry Revenue Million Forecast, by Country 2020 & 2033
- Table 12: Global GCC Waste Management Industry Volume Billion Forecast, by Country 2020 & 2033
- Table 13: United States GCC Waste Management Industry Revenue (Million) Forecast, by Application 2020 & 2033
- Table 14: United States GCC Waste Management Industry Volume (Billion) Forecast, by Application 2020 & 2033
- Table 15: Canada GCC Waste Management Industry Revenue (Million) Forecast, by Application 2020 & 2033
- Table 16: Canada GCC Waste Management Industry Volume (Billion) Forecast, by Application 2020 & 2033
- Table 17: Mexico GCC Waste Management Industry Revenue (Million) Forecast, by Application 2020 & 2033
- Table 18: Mexico GCC Waste Management Industry Volume (Billion) Forecast, by Application 2020 & 2033
- Table 19: Global GCC Waste Management Industry Revenue Million Forecast, by Waste Type 2020 & 2033
- Table 20: Global GCC Waste Management Industry Volume Billion Forecast, by Waste Type 2020 & 2033
- Table 21: Global GCC Waste Management Industry Revenue Million Forecast, by Disposal Method 2020 & 2033
- Table 22: Global GCC Waste Management Industry Volume Billion Forecast, by Disposal Method 2020 & 2033
- Table 23: Global GCC Waste Management Industry Revenue Million Forecast, by Country 2020 & 2033
- Table 24: Global GCC Waste Management Industry Volume Billion Forecast, by Country 2020 & 2033
- Table 25: Brazil GCC Waste Management Industry Revenue (Million) Forecast, by Application 2020 & 2033
- Table 26: Brazil GCC Waste Management Industry Volume (Billion) Forecast, by Application 2020 & 2033
- Table 27: Argentina GCC Waste Management Industry Revenue (Million) Forecast, by Application 2020 & 2033
- Table 28: Argentina GCC Waste Management Industry Volume (Billion) Forecast, by Application 2020 & 2033
- Table 29: Rest of South America GCC Waste Management Industry Revenue (Million) Forecast, by Application 2020 & 2033
- Table 30: Rest of South America GCC Waste Management Industry Volume (Billion) Forecast, by Application 2020 & 2033
- Table 31: Global GCC Waste Management Industry Revenue Million Forecast, by Waste Type 2020 & 2033
- Table 32: Global GCC Waste Management Industry Volume Billion Forecast, by Waste Type 2020 & 2033
- Table 33: Global GCC Waste Management Industry Revenue Million Forecast, by Disposal Method 2020 & 2033
- Table 34: Global GCC Waste Management Industry Volume Billion Forecast, by Disposal Method 2020 & 2033
- Table 35: Global GCC Waste Management Industry Revenue Million Forecast, by Country 2020 & 2033
- Table 36: Global GCC Waste Management Industry Volume Billion Forecast, by Country 2020 & 2033
- Table 37: United Kingdom GCC Waste Management Industry Revenue (Million) Forecast, by Application 2020 & 2033
- Table 38: United Kingdom GCC Waste Management Industry Volume (Billion) Forecast, by Application 2020 & 2033
- Table 39: Germany GCC Waste Management Industry Revenue (Million) Forecast, by Application 2020 & 2033
- Table 40: Germany GCC Waste Management Industry Volume (Billion) Forecast, by Application 2020 & 2033
- Table 41: France GCC Waste Management Industry Revenue (Million) Forecast, by Application 2020 & 2033
- Table 42: France GCC Waste Management Industry Volume (Billion) Forecast, by Application 2020 & 2033
- Table 43: Italy GCC Waste Management Industry Revenue (Million) Forecast, by Application 2020 & 2033
- Table 44: Italy GCC Waste Management Industry Volume (Billion) Forecast, by Application 2020 & 2033
- Table 45: Spain GCC Waste Management Industry Revenue (Million) Forecast, by Application 2020 & 2033
- Table 46: Spain GCC Waste Management Industry Volume (Billion) Forecast, by Application 2020 & 2033
- Table 47: Russia GCC Waste Management Industry Revenue (Million) Forecast, by Application 2020 & 2033
- Table 48: Russia GCC Waste Management Industry Volume (Billion) Forecast, by Application 2020 & 2033
- Table 49: Benelux GCC Waste Management Industry Revenue (Million) Forecast, by Application 2020 & 2033
- Table 50: Benelux GCC Waste Management Industry Volume (Billion) Forecast, by Application 2020 & 2033
- Table 51: Nordics GCC Waste Management Industry Revenue (Million) Forecast, by Application 2020 & 2033
- Table 52: Nordics GCC Waste Management Industry Volume (Billion) Forecast, by Application 2020 & 2033
- Table 53: Rest of Europe GCC Waste Management Industry Revenue (Million) Forecast, by Application 2020 & 2033
- Table 54: Rest of Europe GCC Waste Management Industry Volume (Billion) Forecast, by Application 2020 & 2033
- Table 55: Global GCC Waste Management Industry Revenue Million Forecast, by Waste Type 2020 & 2033
- Table 56: Global GCC Waste Management Industry Volume Billion Forecast, by Waste Type 2020 & 2033
- Table 57: Global GCC Waste Management Industry Revenue Million Forecast, by Disposal Method 2020 & 2033
- Table 58: Global GCC Waste Management Industry Volume Billion Forecast, by Disposal Method 2020 & 2033
- Table 59: Global GCC Waste Management Industry Revenue Million Forecast, by Country 2020 & 2033
- Table 60: Global GCC Waste Management Industry Volume Billion Forecast, by Country 2020 & 2033
- Table 61: Turkey GCC Waste Management Industry Revenue (Million) Forecast, by Application 2020 & 2033
- Table 62: Turkey GCC Waste Management Industry Volume (Billion) Forecast, by Application 2020 & 2033
- Table 63: Israel GCC Waste Management Industry Revenue (Million) Forecast, by Application 2020 & 2033
- Table 64: Israel GCC Waste Management Industry Volume (Billion) Forecast, by Application 2020 & 2033
- Table 65: GCC GCC Waste Management Industry Revenue (Million) Forecast, by Application 2020 & 2033
- Table 66: GCC GCC Waste Management Industry Volume (Billion) Forecast, by Application 2020 & 2033
- Table 67: North Africa GCC Waste Management Industry Revenue (Million) Forecast, by Application 2020 & 2033
- Table 68: North Africa GCC Waste Management Industry Volume (Billion) Forecast, by Application 2020 & 2033
- Table 69: South Africa GCC Waste Management Industry Revenue (Million) Forecast, by Application 2020 & 2033
- Table 70: South Africa GCC Waste Management Industry Volume (Billion) Forecast, by Application 2020 & 2033
- Table 71: Rest of Middle East & Africa GCC Waste Management Industry Revenue (Million) Forecast, by Application 2020 & 2033
- Table 72: Rest of Middle East & Africa GCC Waste Management Industry Volume (Billion) Forecast, by Application 2020 & 2033
- Table 73: Global GCC Waste Management Industry Revenue Million Forecast, by Waste Type 2020 & 2033
- Table 74: Global GCC Waste Management Industry Volume Billion Forecast, by Waste Type 2020 & 2033
- Table 75: Global GCC Waste Management Industry Revenue Million Forecast, by Disposal Method 2020 & 2033
- Table 76: Global GCC Waste Management Industry Volume Billion Forecast, by Disposal Method 2020 & 2033
- Table 77: Global GCC Waste Management Industry Revenue Million Forecast, by Country 2020 & 2033
- Table 78: Global GCC Waste Management Industry Volume Billion Forecast, by Country 2020 & 2033
- Table 79: China GCC Waste Management Industry Revenue (Million) Forecast, by Application 2020 & 2033
- Table 80: China GCC Waste Management Industry Volume (Billion) Forecast, by Application 2020 & 2033
- Table 81: India GCC Waste Management Industry Revenue (Million) Forecast, by Application 2020 & 2033
- Table 82: India GCC Waste Management Industry Volume (Billion) Forecast, by Application 2020 & 2033
- Table 83: Japan GCC Waste Management Industry Revenue (Million) Forecast, by Application 2020 & 2033
- Table 84: Japan GCC Waste Management Industry Volume (Billion) Forecast, by Application 2020 & 2033
- Table 85: South Korea GCC Waste Management Industry Revenue (Million) Forecast, by Application 2020 & 2033
- Table 86: South Korea GCC Waste Management Industry Volume (Billion) Forecast, by Application 2020 & 2033
- Table 87: ASEAN GCC Waste Management Industry Revenue (Million) Forecast, by Application 2020 & 2033
- Table 88: ASEAN GCC Waste Management Industry Volume (Billion) Forecast, by Application 2020 & 2033
- Table 89: Oceania GCC Waste Management Industry Revenue (Million) Forecast, by Application 2020 & 2033
- Table 90: Oceania GCC Waste Management Industry Volume (Billion) Forecast, by Application 2020 & 2033
- Table 91: Rest of Asia Pacific GCC Waste Management Industry Revenue (Million) Forecast, by Application 2020 & 2033
- Table 92: Rest of Asia Pacific GCC Waste Management Industry Volume (Billion) Forecast, by Application 2020 & 2033
Frequently Asked Questions
1. What is the projected Compound Annual Growth Rate (CAGR) of the GCC Waste Management Industry?
The projected CAGR is approximately 7.38%.
2. Which companies are prominent players in the GCC Waste Management Industry?
Key companies in the market include Averda, EnviroServe, Suez Middle East Recycling LLC, Green Mountains, Veolia, Blue LLC, Envac, SEPCO Environment, Wasco, Saudi Investment Recycling Company, Dulsco Waste Management Services, Bee'ah, Power Waste Management and Transport LLC, Al Haya Enviro, Bin-Ovation, United Waste Management Company, Kuwait Waste Collection and Recycling Company**List Not Exhaustive.
3. What are the main segments of the GCC Waste Management Industry?
The market segments include Waste Type, Disposal Method.
4. Can you provide details about the market size?
The market size is estimated to be USD 63.56 Million as of 2022.
5. What are some drivers contributing to market growth?
4.; Increasing demand for mining waste co-disposable.
6. What are the notable trends driving market growth?
Increasing E-waste Generation in Gulf Cooperation Council Region.
7. Are there any restraints impacting market growth?
4.; Increasing demand for mining waste co-disposable.
8. Can you provide examples of recent developments in the market?
December 2023: Electric mobility firm Wardwizard Innovations and Mobility entered into an agreement with the Sharjah Government co-owned sustainable waste management company BEEAH Group (BG) for the manufacturing of electric vehicles. Under this collaboration, Wardwizard Innovations and Mobility, along with BEEAH Group, will jointly promote electric vehicles in GCC nations and the African region.
9. What pricing options are available for accessing the report?
Pricing options include single-user, multi-user, and enterprise licenses priced at USD 3800, USD 4500, and USD 5800 respectively.
10. Is the market size provided in terms of value or volume?
The market size is provided in terms of value, measured in Million and volume, measured in Billion.
11. Are there any specific market keywords associated with the report?
Yes, the market keyword associated with the report is "GCC Waste Management Industry," which aids in identifying and referencing the specific market segment covered.
12. How do I determine which pricing option suits my needs best?
The pricing options vary based on user requirements and access needs. Individual users may opt for single-user licenses, while businesses requiring broader access may choose multi-user or enterprise licenses for cost-effective access to the report.
13. Are there any additional resources or data provided in the GCC Waste Management Industry report?
While the report offers comprehensive insights, it's advisable to review the specific contents or supplementary materials provided to ascertain if additional resources or data are available.
14. How can I stay updated on further developments or reports in the GCC Waste Management Industry?
To stay informed about further developments, trends, and reports in the GCC Waste Management Industry, consider subscribing to industry newsletters, following relevant companies and organizations, or regularly checking reputable industry news sources and publications.
Methodology
Step 1 - Identification of Relevant Samples Size from Population Database


Step 2 - Approaches for Defining Global Market Size (Value, Volume* & Price*)

Note*: In applicable scenarios
Step 3 - Data Sources
Primary Research
- Web Analytics
- Survey Reports
- Research Institute
- Latest Research Reports
- Opinion Leaders
Secondary Research
- Annual Reports
- White Paper
- Latest Press Release
- Industry Association
- Paid Database
- Investor Presentations

Step 4 - Data Triangulation
Involves using different sources of information in order to increase the validity of a study
These sources are likely to be stakeholders in a program - participants, other researchers, program staff, other community members, and so on.
Then we put all data in single framework & apply various statistical tools to find out the dynamic on the market.
During the analysis stage, feedback from the stakeholder groups would be compared to determine areas of agreement as well as areas of divergence