

Key Insights
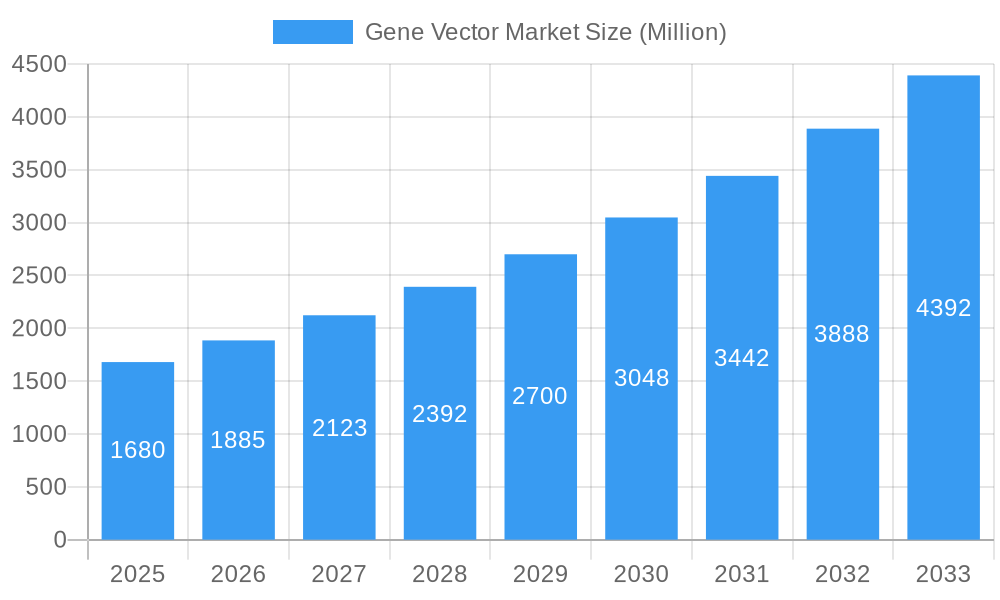
The global gene vector market, valued at $1.68 billion in 2025, is poised for robust growth, exhibiting a compound annual growth rate (CAGR) of 12.45% from 2025 to 2033. This expansion is fueled by several key drivers. The increasing prevalence of genetic disorders, coupled with advancements in gene editing technologies like CRISPR-Cas9, is significantly boosting demand for gene vectors as essential tools in gene therapy. Furthermore, the rising investments in research and development by both pharmaceutical companies and academic institutions are accelerating the development of innovative gene therapies and expanding the clinical application of gene vectors. Stringent regulatory approvals and high manufacturing costs pose significant challenges, but the overall market trajectory is positive, driven by the growing success of gene therapy trials and the expanding pipeline of promising therapies targeting a wide array of diseases. Major players like Abbott Laboratories, Becton Dickinson, and Thermo Fisher Scientific are actively shaping market dynamics through their innovative product offerings and strategic partnerships. The market is segmented by vector type (viral vectors, non-viral vectors), application (oncology, infectious diseases, genetic disorders), and end-user (pharmaceutical companies, research institutions). The North American market is expected to maintain a significant share due to robust healthcare infrastructure and high adoption rates of advanced therapies.
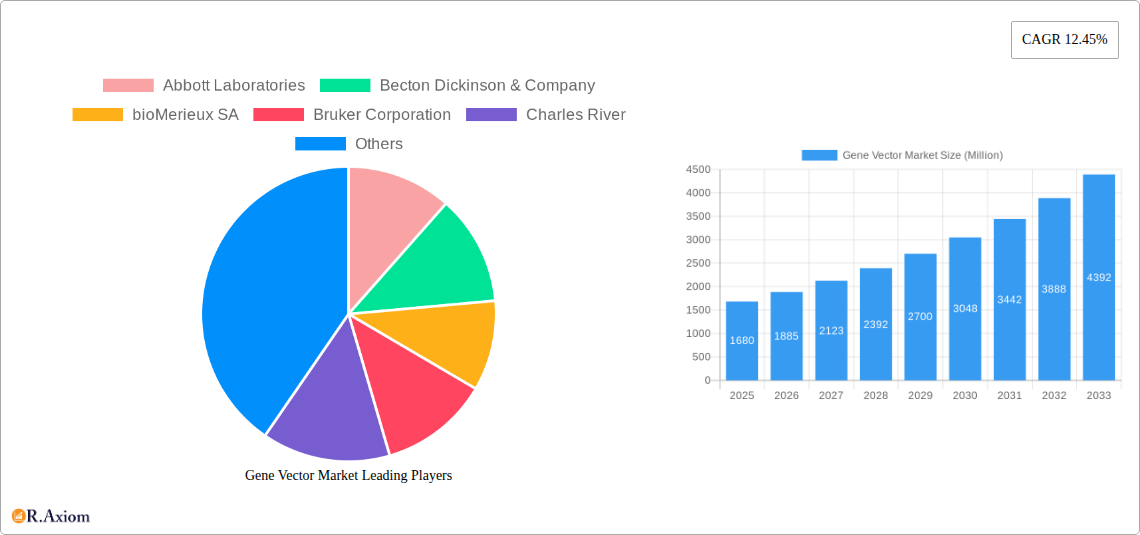
Gene Vector Market Market Size (In Billion)
The forecast period (2025-2033) promises substantial growth, primarily driven by the continuous clinical success of gene therapies and the broadening therapeutic landscape. The market is expected to witness increased competition among established players and emerging biotech firms as the field matures. Strategic collaborations and mergers and acquisitions are anticipated to reshape the competitive landscape. The increasing awareness among patients and healthcare providers regarding the benefits of gene therapy is further contributing to market expansion. However, challenges related to long-term safety and efficacy of gene therapies need to be addressed. Ongoing efforts to enhance the safety profile and improve the efficacy of gene vectors will further drive market growth throughout the forecast period.
Gene Vector Market Company Market Share
This detailed report provides a comprehensive analysis of the Gene Vector Market, encompassing market size, segmentation, growth drivers, challenges, and key players. The study period covers 2019-2033, with 2025 as the base and estimated year, and a forecast period of 2025-2033. This report is essential for industry stakeholders, investors, and researchers seeking actionable insights into this rapidly evolving market.
Gene Vector Market Concentration & Innovation
The Gene Vector Market exhibits a moderately concentrated landscape, with a few key players holding significant market share. However, the market is also characterized by considerable innovation, driven by advancements in gene editing technologies like CRISPR-Cas9 and improved viral vector production methods. Regulatory frameworks, while evolving, play a crucial role in shaping market dynamics. The presence of substitute therapies, albeit limited, adds a layer of competitive pressure. End-user trends toward personalized medicine and increased demand for effective gene therapies fuel market expansion.
Market Concentration Metrics:
- Top 5 players hold approximately xx% of the market share (2024).
- Average market concentration ratio (CR5): xx% (2024).
Innovation Drivers:
- Advancements in gene editing technologies.
- Development of novel viral and non-viral vector systems.
- Increased R&D investment in gene therapy.
M&A Activity: While specific deal values aren't consistently reported publicly for all transactions, the observed M&A activity indicates a robust level of consolidation and strategic investments within the sector, with an estimated total deal value exceeding USD xx Million in the period 2019-2024.
Gene Vector Market Industry Trends & Insights
The Gene Vector Market is experiencing significant growth, driven primarily by increasing prevalence of genetic disorders, rising demand for personalized medicine, and substantial investments in research and development. Technological advancements, such as the development of safer and more efficient gene delivery systems, are further accelerating market expansion. The competitive landscape is characterized by both established players and emerging biotech companies vying for market share. Consumer preferences are shifting toward less invasive and more targeted therapies, creating opportunities for innovative gene vector solutions.
Key Metrics:
- CAGR (2025-2033): xx%
- Market Penetration: xx% (2024) in major markets.
Dominant Markets & Segments in Gene Vector Market
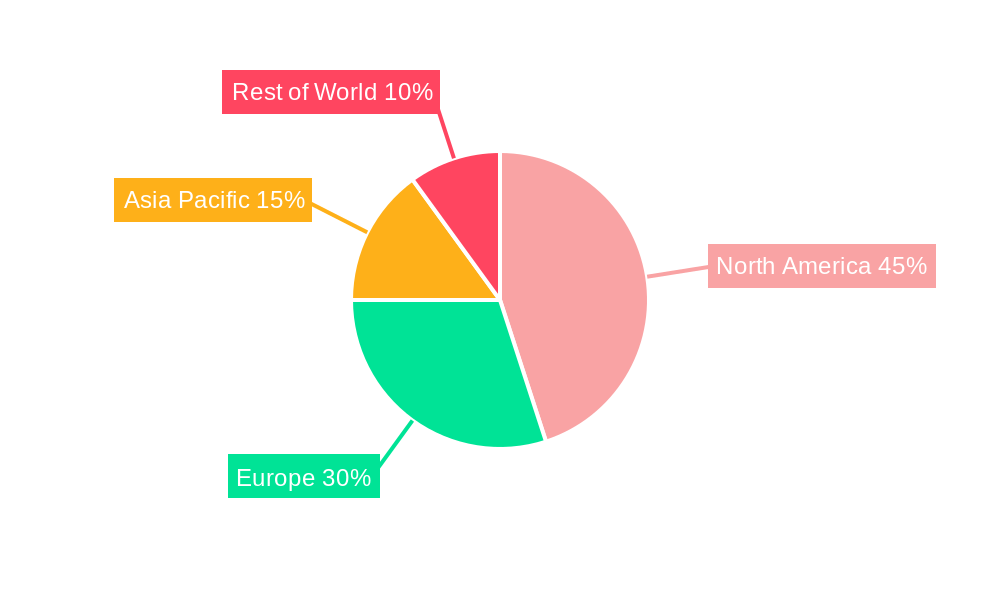
The North American market currently dominates the Gene Vector Market, driven by robust research and development infrastructure, favorable regulatory environment, and high healthcare expenditure. Europe follows as a significant market, with growth fueled by increasing government support for gene therapy research. Asia Pacific is a rapidly expanding market, although regulatory hurdles remain a significant challenge.
Key Drivers of North American Dominance:
- Strong R&D infrastructure and funding.
- Favorable regulatory framework.
- High healthcare expenditure and advanced medical facilities.
Other Regions: European markets are showing steady growth driven by increasing investments in biotechnology, while the Asia Pacific market faces challenges with regulatory approvals.
Gene Vector Market Product Developments
Recent advancements in gene vector technology have led to the development of more efficient and safer gene delivery systems. This includes improved viral vectors (e.g., AAV, lentiviral) with enhanced tropism and reduced immunogenicity, as well as advancements in non-viral delivery methods. These innovations are enabling the development of novel gene therapies for a broader range of diseases, translating into competitive advantages for companies offering these improved technologies.
Report Scope & Segmentation Analysis
The Gene Vector Market is segmented by vector type (viral, non-viral), application (oncology, infectious diseases, genetic disorders), and geography. Viral vectors dominate the market due to their higher efficiency, while non-viral vectors are gaining traction due to their improved safety profile. Oncology applications represent the largest segment, followed by genetic disorders and infectious diseases. Growth projections vary by segment, with viral vectors and oncology applications expected to exhibit the fastest growth during the forecast period. Competitive dynamics within each segment are influenced by factors such as technological innovation, regulatory approvals, and pricing strategies.
Key Drivers of Gene Vector Market Growth
Several factors are driving the growth of the Gene Vector Market:
- Technological advancements: Improved gene editing technologies and safer viral vectors.
- Increased prevalence of genetic disorders: Growing need for effective treatment options.
- Rising investments in R&D: Significant funding for gene therapy research and development.
- Favorable regulatory environment: Approvals for innovative gene therapies are accelerating.
Challenges in the Gene Vector Market Sector
The Gene Vector Market faces several challenges:
- Regulatory hurdles: Stringent regulatory processes for gene therapy approvals.
- High cost of development and manufacturing: Developing and producing gene therapies is expensive.
- Potential for adverse events: Concerns regarding safety and efficacy.
- Competition: Intense competition among established players and emerging biotech firms.
Emerging Opportunities in Gene Vector Market
Emerging opportunities in the Gene Vector Market include:
- Expansion into new therapeutic areas: Application of gene vectors to treat previously untreatable diseases.
- Development of novel vector systems: Advancements in safer and more efficient gene delivery systems.
- Personalized medicine: Tailoring gene therapy to individual patient needs.
- Expansion into emerging markets: Growth potential in developing countries.
Leading Players in the Gene Vector Market Market
Key Developments in Gene Vector Market Industry
- November 2023: Genezen, a cell and gene therapy (CGT) CDMO, received funding worth USD 18.5 Million, led by Ampersand Capital Partners. This funding boosts retroviral, lentiviral, and AAV vector manufacturing capabilities.
- April 2024: Ring Therapeutics successfully delivered a viral gene to the retinas of mice using its Anellogy platform (human anellovirus-based). This signifies progress in targeted gene delivery.
Strategic Outlook for Gene Vector Market Market
The Gene Vector Market holds significant growth potential, fueled by continuous technological advancements, expanding therapeutic applications, and increasing investments in research and development. The market is poised for substantial expansion over the next decade, driven by the growing prevalence of genetic disorders, increasing demand for personalized medicine, and a favorable regulatory landscape that is progressively streamlining the approval process for innovative gene therapies. This creates numerous opportunities for both established companies and new entrants alike.
Gene Vector Market Segmentation
-
1. Product Type
- 1.1. Consumables
-
1.2. Instruments
- 1.2.1. Automated Identification & Testing Systems
- 1.2.2. Biolumin
- 1.2.3. Mass Spectrometers
- 1.2.4. Others
- 1.3. Reagents & Kits
-
2. Method
- 2.1. Cellular Component-based Testing
- 2.2. Nucleic Acid-based Testing
- 2.3. Others
-
3. End User
- 3.1. Clinical Laboratories
- 3.2. Food & Beverage Industry
- 3.3. Healthcare Facilities
- 3.4. Life Science Research & Development Facilities
- 3.5. Other End Users
Gene Vector Market Segmentation By Geography
-
1. North America
- 1.1. United States
- 1.2. Canada
- 1.3. Mexico
-
2. Europe
- 2.1. Germany
- 2.2. United Kingdom
- 2.3. France
- 2.4. Italy
- 2.5. Spain
- 2.6. Rest of Europe
-
3. Asia Pacific
- 3.1. China
- 3.2. Japan
- 3.3. India
- 3.4. Australia
- 3.5. South Korea
- 3.6. Rest of Asia Pacific
-
4. Middle East and Africa
- 4.1. GCC
- 4.2. South Africa
- 4.3. Rest of Middle East and Africa
-
5. South America
- 5.1. Brazil
- 5.2. Argentina
- 5.3. Rest of South America
Gene Vector Market Regional Market Share
Geographic Coverage of Gene Vector Market
Gene Vector Market REPORT HIGHLIGHTS
| Aspects | Details |
|---|---|
| Study Period | 2020-2034 |
| Base Year | 2025 |
| Estimated Year | 2026 |
| Forecast Period | 2026-2034 |
| Historical Period | 2020-2025 |
| Growth Rate | CAGR of 12.45% from 2020-2034 |
| Segmentation |
|
Table of Contents
- 1. Introduction
- 1.1. Research Scope
- 1.2. Market Segmentation
- 1.3. Research Objective
- 1.4. Definitions and Assumptions
- 2. Executive Summary
- 2.1. Market Snapshot
- 3. Market Dynamics
- 3.1. Market Drivers
- 3.2. Market Restrains
- 3.3. Market Trends
- 3.4. Market Opportunities
- 4. Market Factor Analysis
- 4.1. Porters Five Forces
- 4.1.1. Bargaining Power of Suppliers
- 4.1.2. Bargaining Power of Buyers
- 4.1.3. Threat of New Entrants
- 4.1.4. Threat of Substitutes
- 4.1.5. Competitive Rivalry
- 4.2. PESTEL analysis
- 4.3. BCG Analysis
- 4.3.1. Stars (High Growth, High Market Share)
- 4.3.2. Cash Cows (Low Growth, High Market Share)
- 4.3.3. Question Mark (High Growth, Low Market Share)
- 4.3.4. Dogs (Low Growth, Low Market Share)
- 4.4. Ansoff Matrix Analysis
- 4.5. Supply Chain Analysis
- 4.6. Regulatory Landscape
- 4.7. Current Market Potential and Opportunity Assessment (TAM–SAM–SOM Framework)
- 4.8. RAX Analyst Note
- 4.1. Porters Five Forces
- 5. Market Analysis, Insights and Forecast 2021-2033
- 5.1. Market Analysis, Insights and Forecast - by Product Type
- 5.1.1. Consumables
- 5.1.2. Instruments
- 5.1.2.1. Automated Identification & Testing Systems
- 5.1.2.2. Biolumin
- 5.1.2.3. Mass Spectrometers
- 5.1.2.4. Others
- 5.1.3. Reagents & Kits
- 5.2. Market Analysis, Insights and Forecast - by Method
- 5.2.1. Cellular Component-based Testing
- 5.2.2. Nucleic Acid-based Testing
- 5.2.3. Others
- 5.3. Market Analysis, Insights and Forecast - by End User
- 5.3.1. Clinical Laboratories
- 5.3.2. Food & Beverage Industry
- 5.3.3. Healthcare Facilities
- 5.3.4. Life Science Research & Development Facilities
- 5.3.5. Other End Users
- 5.4. Market Analysis, Insights and Forecast - by Region
- 5.4.1. North America
- 5.4.2. Europe
- 5.4.3. Asia Pacific
- 5.4.4. Middle East and Africa
- 5.4.5. South America
- 5.1. Market Analysis, Insights and Forecast - by Product Type
- 6. Global Gene Vector Market Analysis, Insights and Forecast, 2021-2033
- 6.1. Market Analysis, Insights and Forecast - by Product Type
- 6.1.1. Consumables
- 6.1.2. Instruments
- 6.1.2.1. Automated Identification & Testing Systems
- 6.1.2.2. Biolumin
- 6.1.2.3. Mass Spectrometers
- 6.1.2.4. Others
- 6.1.3. Reagents & Kits
- 6.2. Market Analysis, Insights and Forecast - by Method
- 6.2.1. Cellular Component-based Testing
- 6.2.2. Nucleic Acid-based Testing
- 6.2.3. Others
- 6.3. Market Analysis, Insights and Forecast - by End User
- 6.3.1. Clinical Laboratories
- 6.3.2. Food & Beverage Industry
- 6.3.3. Healthcare Facilities
- 6.3.4. Life Science Research & Development Facilities
- 6.3.5. Other End Users
- 6.1. Market Analysis, Insights and Forecast - by Product Type
- 7. North America Gene Vector Market Analysis, Insights and Forecast, 2020-2032
- 7.1. Market Analysis, Insights and Forecast - by Product Type
- 7.1.1. Consumables
- 7.1.2. Instruments
- 7.1.2.1. Automated Identification & Testing Systems
- 7.1.2.2. Biolumin
- 7.1.2.3. Mass Spectrometers
- 7.1.2.4. Others
- 7.1.3. Reagents & Kits
- 7.2. Market Analysis, Insights and Forecast - by Method
- 7.2.1. Cellular Component-based Testing
- 7.2.2. Nucleic Acid-based Testing
- 7.2.3. Others
- 7.3. Market Analysis, Insights and Forecast - by End User
- 7.3.1. Clinical Laboratories
- 7.3.2. Food & Beverage Industry
- 7.3.3. Healthcare Facilities
- 7.3.4. Life Science Research & Development Facilities
- 7.3.5. Other End Users
- 7.1. Market Analysis, Insights and Forecast - by Product Type
- 8. Europe Gene Vector Market Analysis, Insights and Forecast, 2020-2032
- 8.1. Market Analysis, Insights and Forecast - by Product Type
- 8.1.1. Consumables
- 8.1.2. Instruments
- 8.1.2.1. Automated Identification & Testing Systems
- 8.1.2.2. Biolumin
- 8.1.2.3. Mass Spectrometers
- 8.1.2.4. Others
- 8.1.3. Reagents & Kits
- 8.2. Market Analysis, Insights and Forecast - by Method
- 8.2.1. Cellular Component-based Testing
- 8.2.2. Nucleic Acid-based Testing
- 8.2.3. Others
- 8.3. Market Analysis, Insights and Forecast - by End User
- 8.3.1. Clinical Laboratories
- 8.3.2. Food & Beverage Industry
- 8.3.3. Healthcare Facilities
- 8.3.4. Life Science Research & Development Facilities
- 8.3.5. Other End Users
- 8.1. Market Analysis, Insights and Forecast - by Product Type
- 9. Asia Pacific Gene Vector Market Analysis, Insights and Forecast, 2020-2032
- 9.1. Market Analysis, Insights and Forecast - by Product Type
- 9.1.1. Consumables
- 9.1.2. Instruments
- 9.1.2.1. Automated Identification & Testing Systems
- 9.1.2.2. Biolumin
- 9.1.2.3. Mass Spectrometers
- 9.1.2.4. Others
- 9.1.3. Reagents & Kits
- 9.2. Market Analysis, Insights and Forecast - by Method
- 9.2.1. Cellular Component-based Testing
- 9.2.2. Nucleic Acid-based Testing
- 9.2.3. Others
- 9.3. Market Analysis, Insights and Forecast - by End User
- 9.3.1. Clinical Laboratories
- 9.3.2. Food & Beverage Industry
- 9.3.3. Healthcare Facilities
- 9.3.4. Life Science Research & Development Facilities
- 9.3.5. Other End Users
- 9.1. Market Analysis, Insights and Forecast - by Product Type
- 10. Middle East and Africa Gene Vector Market Analysis, Insights and Forecast, 2020-2032
- 10.1. Market Analysis, Insights and Forecast - by Product Type
- 10.1.1. Consumables
- 10.1.2. Instruments
- 10.1.2.1. Automated Identification & Testing Systems
- 10.1.2.2. Biolumin
- 10.1.2.3. Mass Spectrometers
- 10.1.2.4. Others
- 10.1.3. Reagents & Kits
- 10.2. Market Analysis, Insights and Forecast - by Method
- 10.2.1. Cellular Component-based Testing
- 10.2.2. Nucleic Acid-based Testing
- 10.2.3. Others
- 10.3. Market Analysis, Insights and Forecast - by End User
- 10.3.1. Clinical Laboratories
- 10.3.2. Food & Beverage Industry
- 10.3.3. Healthcare Facilities
- 10.3.4. Life Science Research & Development Facilities
- 10.3.5. Other End Users
- 10.1. Market Analysis, Insights and Forecast - by Product Type
- 11. South America Gene Vector Market Analysis, Insights and Forecast, 2020-2032
- 11.1. Market Analysis, Insights and Forecast - by Product Type
- 11.1.1. Consumables
- 11.1.2. Instruments
- 11.1.2.1. Automated Identification & Testing Systems
- 11.1.2.2. Biolumin
- 11.1.2.3. Mass Spectrometers
- 11.1.2.4. Others
- 11.1.3. Reagents & Kits
- 11.2. Market Analysis, Insights and Forecast - by Method
- 11.2.1. Cellular Component-based Testing
- 11.2.2. Nucleic Acid-based Testing
- 11.2.3. Others
- 11.3. Market Analysis, Insights and Forecast - by End User
- 11.3.1. Clinical Laboratories
- 11.3.2. Food & Beverage Industry
- 11.3.3. Healthcare Facilities
- 11.3.4. Life Science Research & Development Facilities
- 11.3.5. Other End Users
- 11.1. Market Analysis, Insights and Forecast - by Product Type
- 12. Competitive Analysis
- 12.1. Company Profiles
- 12.1.1 Abbott Laboratories
- 12.1.1.1. Company Overview
- 12.1.1.2. Products
- 12.1.1.3. Company Financials
- 12.1.1.4. SWOT Analysis
- 12.1.2 Becton Dickinson & Company
- 12.1.2.1. Company Overview
- 12.1.2.2. Products
- 12.1.2.3. Company Financials
- 12.1.2.4. SWOT Analysis
- 12.1.3 bioMerieux SA
- 12.1.3.1. Company Overview
- 12.1.3.2. Products
- 12.1.3.3. Company Financials
- 12.1.3.4. SWOT Analysis
- 12.1.4 Bruker Corporation
- 12.1.4.1. Company Overview
- 12.1.4.2. Products
- 12.1.4.3. Company Financials
- 12.1.4.4. SWOT Analysis
- 12.1.5 Charles River
- 12.1.5.1. Company Overview
- 12.1.5.2. Products
- 12.1.5.3. Company Financials
- 12.1.5.4. SWOT Analysis
- 12.1.6 Danaher Corporation
- 12.1.6.1. Company Overview
- 12.1.6.2. Products
- 12.1.6.3. Company Financials
- 12.1.6.4. SWOT Analysis
- 12.1.7 Merck KGaA
- 12.1.7.1. Company Overview
- 12.1.7.2. Products
- 12.1.7.3. Company Financials
- 12.1.7.4. SWOT Analysis
- 12.1.8 Sartorius Group
- 12.1.8.1. Company Overview
- 12.1.8.2. Products
- 12.1.8.3. Company Financials
- 12.1.8.4. SWOT Analysis
- 12.1.9 Shimadzu Corporation
- 12.1.9.1. Company Overview
- 12.1.9.2. Products
- 12.1.9.3. Company Financials
- 12.1.9.4. SWOT Analysis
- 12.1.10 Thermo Fisher Scientific*List Not Exhaustive
- 12.1.10.1. Company Overview
- 12.1.10.2. Products
- 12.1.10.3. Company Financials
- 12.1.10.4. SWOT Analysis
- 12.1.1 Abbott Laboratories
- 12.2. Market Entropy
- 12.2.1 Company's Key Areas Served
- 12.2.2 Recent Developments
- 12.3. Company Market Share Analysis 2025
- 12.3.1 Top 5 Companies Market Share Analysis
- 12.3.2 Top 3 Companies Market Share Analysis
- 12.4. List of Potential Customers
- 13. Research Methodology
List of Figures
- Figure 1: Global Gene Vector Market Revenue Breakdown (Million, %) by Region 2025 & 2033
- Figure 2: Global Gene Vector Market Volume Breakdown (Billion, %) by Region 2025 & 2033
- Figure 3: North America Gene Vector Market Revenue (Million), by Product Type 2025 & 2033
- Figure 4: North America Gene Vector Market Volume (Billion), by Product Type 2025 & 2033
- Figure 5: North America Gene Vector Market Revenue Share (%), by Product Type 2025 & 2033
- Figure 6: North America Gene Vector Market Volume Share (%), by Product Type 2025 & 2033
- Figure 7: North America Gene Vector Market Revenue (Million), by Method 2025 & 2033
- Figure 8: North America Gene Vector Market Volume (Billion), by Method 2025 & 2033
- Figure 9: North America Gene Vector Market Revenue Share (%), by Method 2025 & 2033
- Figure 10: North America Gene Vector Market Volume Share (%), by Method 2025 & 2033
- Figure 11: North America Gene Vector Market Revenue (Million), by End User 2025 & 2033
- Figure 12: North America Gene Vector Market Volume (Billion), by End User 2025 & 2033
- Figure 13: North America Gene Vector Market Revenue Share (%), by End User 2025 & 2033
- Figure 14: North America Gene Vector Market Volume Share (%), by End User 2025 & 2033
- Figure 15: North America Gene Vector Market Revenue (Million), by Country 2025 & 2033
- Figure 16: North America Gene Vector Market Volume (Billion), by Country 2025 & 2033
- Figure 17: North America Gene Vector Market Revenue Share (%), by Country 2025 & 2033
- Figure 18: North America Gene Vector Market Volume Share (%), by Country 2025 & 2033
- Figure 19: Europe Gene Vector Market Revenue (Million), by Product Type 2025 & 2033
- Figure 20: Europe Gene Vector Market Volume (Billion), by Product Type 2025 & 2033
- Figure 21: Europe Gene Vector Market Revenue Share (%), by Product Type 2025 & 2033
- Figure 22: Europe Gene Vector Market Volume Share (%), by Product Type 2025 & 2033
- Figure 23: Europe Gene Vector Market Revenue (Million), by Method 2025 & 2033
- Figure 24: Europe Gene Vector Market Volume (Billion), by Method 2025 & 2033
- Figure 25: Europe Gene Vector Market Revenue Share (%), by Method 2025 & 2033
- Figure 26: Europe Gene Vector Market Volume Share (%), by Method 2025 & 2033
- Figure 27: Europe Gene Vector Market Revenue (Million), by End User 2025 & 2033
- Figure 28: Europe Gene Vector Market Volume (Billion), by End User 2025 & 2033
- Figure 29: Europe Gene Vector Market Revenue Share (%), by End User 2025 & 2033
- Figure 30: Europe Gene Vector Market Volume Share (%), by End User 2025 & 2033
- Figure 31: Europe Gene Vector Market Revenue (Million), by Country 2025 & 2033
- Figure 32: Europe Gene Vector Market Volume (Billion), by Country 2025 & 2033
- Figure 33: Europe Gene Vector Market Revenue Share (%), by Country 2025 & 2033
- Figure 34: Europe Gene Vector Market Volume Share (%), by Country 2025 & 2033
- Figure 35: Asia Pacific Gene Vector Market Revenue (Million), by Product Type 2025 & 2033
- Figure 36: Asia Pacific Gene Vector Market Volume (Billion), by Product Type 2025 & 2033
- Figure 37: Asia Pacific Gene Vector Market Revenue Share (%), by Product Type 2025 & 2033
- Figure 38: Asia Pacific Gene Vector Market Volume Share (%), by Product Type 2025 & 2033
- Figure 39: Asia Pacific Gene Vector Market Revenue (Million), by Method 2025 & 2033
- Figure 40: Asia Pacific Gene Vector Market Volume (Billion), by Method 2025 & 2033
- Figure 41: Asia Pacific Gene Vector Market Revenue Share (%), by Method 2025 & 2033
- Figure 42: Asia Pacific Gene Vector Market Volume Share (%), by Method 2025 & 2033
- Figure 43: Asia Pacific Gene Vector Market Revenue (Million), by End User 2025 & 2033
- Figure 44: Asia Pacific Gene Vector Market Volume (Billion), by End User 2025 & 2033
- Figure 45: Asia Pacific Gene Vector Market Revenue Share (%), by End User 2025 & 2033
- Figure 46: Asia Pacific Gene Vector Market Volume Share (%), by End User 2025 & 2033
- Figure 47: Asia Pacific Gene Vector Market Revenue (Million), by Country 2025 & 2033
- Figure 48: Asia Pacific Gene Vector Market Volume (Billion), by Country 2025 & 2033
- Figure 49: Asia Pacific Gene Vector Market Revenue Share (%), by Country 2025 & 2033
- Figure 50: Asia Pacific Gene Vector Market Volume Share (%), by Country 2025 & 2033
- Figure 51: Middle East and Africa Gene Vector Market Revenue (Million), by Product Type 2025 & 2033
- Figure 52: Middle East and Africa Gene Vector Market Volume (Billion), by Product Type 2025 & 2033
- Figure 53: Middle East and Africa Gene Vector Market Revenue Share (%), by Product Type 2025 & 2033
- Figure 54: Middle East and Africa Gene Vector Market Volume Share (%), by Product Type 2025 & 2033
- Figure 55: Middle East and Africa Gene Vector Market Revenue (Million), by Method 2025 & 2033
- Figure 56: Middle East and Africa Gene Vector Market Volume (Billion), by Method 2025 & 2033
- Figure 57: Middle East and Africa Gene Vector Market Revenue Share (%), by Method 2025 & 2033
- Figure 58: Middle East and Africa Gene Vector Market Volume Share (%), by Method 2025 & 2033
- Figure 59: Middle East and Africa Gene Vector Market Revenue (Million), by End User 2025 & 2033
- Figure 60: Middle East and Africa Gene Vector Market Volume (Billion), by End User 2025 & 2033
- Figure 61: Middle East and Africa Gene Vector Market Revenue Share (%), by End User 2025 & 2033
- Figure 62: Middle East and Africa Gene Vector Market Volume Share (%), by End User 2025 & 2033
- Figure 63: Middle East and Africa Gene Vector Market Revenue (Million), by Country 2025 & 2033
- Figure 64: Middle East and Africa Gene Vector Market Volume (Billion), by Country 2025 & 2033
- Figure 65: Middle East and Africa Gene Vector Market Revenue Share (%), by Country 2025 & 2033
- Figure 66: Middle East and Africa Gene Vector Market Volume Share (%), by Country 2025 & 2033
- Figure 67: South America Gene Vector Market Revenue (Million), by Product Type 2025 & 2033
- Figure 68: South America Gene Vector Market Volume (Billion), by Product Type 2025 & 2033
- Figure 69: South America Gene Vector Market Revenue Share (%), by Product Type 2025 & 2033
- Figure 70: South America Gene Vector Market Volume Share (%), by Product Type 2025 & 2033
- Figure 71: South America Gene Vector Market Revenue (Million), by Method 2025 & 2033
- Figure 72: South America Gene Vector Market Volume (Billion), by Method 2025 & 2033
- Figure 73: South America Gene Vector Market Revenue Share (%), by Method 2025 & 2033
- Figure 74: South America Gene Vector Market Volume Share (%), by Method 2025 & 2033
- Figure 75: South America Gene Vector Market Revenue (Million), by End User 2025 & 2033
- Figure 76: South America Gene Vector Market Volume (Billion), by End User 2025 & 2033
- Figure 77: South America Gene Vector Market Revenue Share (%), by End User 2025 & 2033
- Figure 78: South America Gene Vector Market Volume Share (%), by End User 2025 & 2033
- Figure 79: South America Gene Vector Market Revenue (Million), by Country 2025 & 2033
- Figure 80: South America Gene Vector Market Volume (Billion), by Country 2025 & 2033
- Figure 81: South America Gene Vector Market Revenue Share (%), by Country 2025 & 2033
- Figure 82: South America Gene Vector Market Volume Share (%), by Country 2025 & 2033
List of Tables
- Table 1: Global Gene Vector Market Revenue Million Forecast, by Product Type 2020 & 2033
- Table 2: Global Gene Vector Market Volume Billion Forecast, by Product Type 2020 & 2033
- Table 3: Global Gene Vector Market Revenue Million Forecast, by Method 2020 & 2033
- Table 4: Global Gene Vector Market Volume Billion Forecast, by Method 2020 & 2033
- Table 5: Global Gene Vector Market Revenue Million Forecast, by End User 2020 & 2033
- Table 6: Global Gene Vector Market Volume Billion Forecast, by End User 2020 & 2033
- Table 7: Global Gene Vector Market Revenue Million Forecast, by Region 2020 & 2033
- Table 8: Global Gene Vector Market Volume Billion Forecast, by Region 2020 & 2033
- Table 9: Global Gene Vector Market Revenue Million Forecast, by Product Type 2020 & 2033
- Table 10: Global Gene Vector Market Volume Billion Forecast, by Product Type 2020 & 2033
- Table 11: Global Gene Vector Market Revenue Million Forecast, by Method 2020 & 2033
- Table 12: Global Gene Vector Market Volume Billion Forecast, by Method 2020 & 2033
- Table 13: Global Gene Vector Market Revenue Million Forecast, by End User 2020 & 2033
- Table 14: Global Gene Vector Market Volume Billion Forecast, by End User 2020 & 2033
- Table 15: Global Gene Vector Market Revenue Million Forecast, by Country 2020 & 2033
- Table 16: Global Gene Vector Market Volume Billion Forecast, by Country 2020 & 2033
- Table 17: United States Gene Vector Market Revenue (Million) Forecast, by Application 2020 & 2033
- Table 18: United States Gene Vector Market Volume (Billion) Forecast, by Application 2020 & 2033
- Table 19: Canada Gene Vector Market Revenue (Million) Forecast, by Application 2020 & 2033
- Table 20: Canada Gene Vector Market Volume (Billion) Forecast, by Application 2020 & 2033
- Table 21: Mexico Gene Vector Market Revenue (Million) Forecast, by Application 2020 & 2033
- Table 22: Mexico Gene Vector Market Volume (Billion) Forecast, by Application 2020 & 2033
- Table 23: Global Gene Vector Market Revenue Million Forecast, by Product Type 2020 & 2033
- Table 24: Global Gene Vector Market Volume Billion Forecast, by Product Type 2020 & 2033
- Table 25: Global Gene Vector Market Revenue Million Forecast, by Method 2020 & 2033
- Table 26: Global Gene Vector Market Volume Billion Forecast, by Method 2020 & 2033
- Table 27: Global Gene Vector Market Revenue Million Forecast, by End User 2020 & 2033
- Table 28: Global Gene Vector Market Volume Billion Forecast, by End User 2020 & 2033
- Table 29: Global Gene Vector Market Revenue Million Forecast, by Country 2020 & 2033
- Table 30: Global Gene Vector Market Volume Billion Forecast, by Country 2020 & 2033
- Table 31: Germany Gene Vector Market Revenue (Million) Forecast, by Application 2020 & 2033
- Table 32: Germany Gene Vector Market Volume (Billion) Forecast, by Application 2020 & 2033
- Table 33: United Kingdom Gene Vector Market Revenue (Million) Forecast, by Application 2020 & 2033
- Table 34: United Kingdom Gene Vector Market Volume (Billion) Forecast, by Application 2020 & 2033
- Table 35: France Gene Vector Market Revenue (Million) Forecast, by Application 2020 & 2033
- Table 36: France Gene Vector Market Volume (Billion) Forecast, by Application 2020 & 2033
- Table 37: Italy Gene Vector Market Revenue (Million) Forecast, by Application 2020 & 2033
- Table 38: Italy Gene Vector Market Volume (Billion) Forecast, by Application 2020 & 2033
- Table 39: Spain Gene Vector Market Revenue (Million) Forecast, by Application 2020 & 2033
- Table 40: Spain Gene Vector Market Volume (Billion) Forecast, by Application 2020 & 2033
- Table 41: Rest of Europe Gene Vector Market Revenue (Million) Forecast, by Application 2020 & 2033
- Table 42: Rest of Europe Gene Vector Market Volume (Billion) Forecast, by Application 2020 & 2033
- Table 43: Global Gene Vector Market Revenue Million Forecast, by Product Type 2020 & 2033
- Table 44: Global Gene Vector Market Volume Billion Forecast, by Product Type 2020 & 2033
- Table 45: Global Gene Vector Market Revenue Million Forecast, by Method 2020 & 2033
- Table 46: Global Gene Vector Market Volume Billion Forecast, by Method 2020 & 2033
- Table 47: Global Gene Vector Market Revenue Million Forecast, by End User 2020 & 2033
- Table 48: Global Gene Vector Market Volume Billion Forecast, by End User 2020 & 2033
- Table 49: Global Gene Vector Market Revenue Million Forecast, by Country 2020 & 2033
- Table 50: Global Gene Vector Market Volume Billion Forecast, by Country 2020 & 2033
- Table 51: China Gene Vector Market Revenue (Million) Forecast, by Application 2020 & 2033
- Table 52: China Gene Vector Market Volume (Billion) Forecast, by Application 2020 & 2033
- Table 53: Japan Gene Vector Market Revenue (Million) Forecast, by Application 2020 & 2033
- Table 54: Japan Gene Vector Market Volume (Billion) Forecast, by Application 2020 & 2033
- Table 55: India Gene Vector Market Revenue (Million) Forecast, by Application 2020 & 2033
- Table 56: India Gene Vector Market Volume (Billion) Forecast, by Application 2020 & 2033
- Table 57: Australia Gene Vector Market Revenue (Million) Forecast, by Application 2020 & 2033
- Table 58: Australia Gene Vector Market Volume (Billion) Forecast, by Application 2020 & 2033
- Table 59: South Korea Gene Vector Market Revenue (Million) Forecast, by Application 2020 & 2033
- Table 60: South Korea Gene Vector Market Volume (Billion) Forecast, by Application 2020 & 2033
- Table 61: Rest of Asia Pacific Gene Vector Market Revenue (Million) Forecast, by Application 2020 & 2033
- Table 62: Rest of Asia Pacific Gene Vector Market Volume (Billion) Forecast, by Application 2020 & 2033
- Table 63: Global Gene Vector Market Revenue Million Forecast, by Product Type 2020 & 2033
- Table 64: Global Gene Vector Market Volume Billion Forecast, by Product Type 2020 & 2033
- Table 65: Global Gene Vector Market Revenue Million Forecast, by Method 2020 & 2033
- Table 66: Global Gene Vector Market Volume Billion Forecast, by Method 2020 & 2033
- Table 67: Global Gene Vector Market Revenue Million Forecast, by End User 2020 & 2033
- Table 68: Global Gene Vector Market Volume Billion Forecast, by End User 2020 & 2033
- Table 69: Global Gene Vector Market Revenue Million Forecast, by Country 2020 & 2033
- Table 70: Global Gene Vector Market Volume Billion Forecast, by Country 2020 & 2033
- Table 71: GCC Gene Vector Market Revenue (Million) Forecast, by Application 2020 & 2033
- Table 72: GCC Gene Vector Market Volume (Billion) Forecast, by Application 2020 & 2033
- Table 73: South Africa Gene Vector Market Revenue (Million) Forecast, by Application 2020 & 2033
- Table 74: South Africa Gene Vector Market Volume (Billion) Forecast, by Application 2020 & 2033
- Table 75: Rest of Middle East and Africa Gene Vector Market Revenue (Million) Forecast, by Application 2020 & 2033
- Table 76: Rest of Middle East and Africa Gene Vector Market Volume (Billion) Forecast, by Application 2020 & 2033
- Table 77: Global Gene Vector Market Revenue Million Forecast, by Product Type 2020 & 2033
- Table 78: Global Gene Vector Market Volume Billion Forecast, by Product Type 2020 & 2033
- Table 79: Global Gene Vector Market Revenue Million Forecast, by Method 2020 & 2033
- Table 80: Global Gene Vector Market Volume Billion Forecast, by Method 2020 & 2033
- Table 81: Global Gene Vector Market Revenue Million Forecast, by End User 2020 & 2033
- Table 82: Global Gene Vector Market Volume Billion Forecast, by End User 2020 & 2033
- Table 83: Global Gene Vector Market Revenue Million Forecast, by Country 2020 & 2033
- Table 84: Global Gene Vector Market Volume Billion Forecast, by Country 2020 & 2033
- Table 85: Brazil Gene Vector Market Revenue (Million) Forecast, by Application 2020 & 2033
- Table 86: Brazil Gene Vector Market Volume (Billion) Forecast, by Application 2020 & 2033
- Table 87: Argentina Gene Vector Market Revenue (Million) Forecast, by Application 2020 & 2033
- Table 88: Argentina Gene Vector Market Volume (Billion) Forecast, by Application 2020 & 2033
- Table 89: Rest of South America Gene Vector Market Revenue (Million) Forecast, by Application 2020 & 2033
- Table 90: Rest of South America Gene Vector Market Volume (Billion) Forecast, by Application 2020 & 2033
Frequently Asked Questions
1. What is the projected Compound Annual Growth Rate (CAGR) of the Gene Vector Market?
The projected CAGR is approximately 12.45%.
2. Which companies are prominent players in the Gene Vector Market?
Key companies in the market include Abbott Laboratories, Becton Dickinson & Company, bioMerieux SA, Bruker Corporation, Charles River, Danaher Corporation, Merck KGaA, Sartorius Group, Shimadzu Corporation, Thermo Fisher Scientific*List Not Exhaustive.
3. What are the main segments of the Gene Vector Market?
The market segments include Product Type, Method, End User.
4. Can you provide details about the market size?
The market size is estimated to be USD 1.68 Million as of 2022.
5. What are some drivers contributing to market growth?
Rising Number of Infectious Diseases; Increasing Adoption by Food & Beverage Industry; Growing Government Initiatives.
6. What are the notable trends driving market growth?
The Segment for Cancer is Expected to Witness Substantial Growth Over the Forecast Period.
7. Are there any restraints impacting market growth?
Rising Number of Infectious Diseases; Increasing Adoption by Food & Beverage Industry; Growing Government Initiatives.
8. Can you provide examples of recent developments in the market?
April 2024: Ring Therapeutics successfully delivered a viral gene to the retinas of mice. The viral gene vector was developed using the company's Anellogy platform and was based on the human anellovirus.
9. What pricing options are available for accessing the report?
Pricing options include single-user, multi-user, and enterprise licenses priced at USD 4750, USD 5250, and USD 8750 respectively.
10. Is the market size provided in terms of value or volume?
The market size is provided in terms of value, measured in Million and volume, measured in Billion.
11. Are there any specific market keywords associated with the report?
Yes, the market keyword associated with the report is "Gene Vector Market," which aids in identifying and referencing the specific market segment covered.
12. How do I determine which pricing option suits my needs best?
The pricing options vary based on user requirements and access needs. Individual users may opt for single-user licenses, while businesses requiring broader access may choose multi-user or enterprise licenses for cost-effective access to the report.
13. Are there any additional resources or data provided in the Gene Vector Market report?
While the report offers comprehensive insights, it's advisable to review the specific contents or supplementary materials provided to ascertain if additional resources or data are available.
14. How can I stay updated on further developments or reports in the Gene Vector Market?
To stay informed about further developments, trends, and reports in the Gene Vector Market, consider subscribing to industry newsletters, following relevant companies and organizations, or regularly checking reputable industry news sources and publications.
Methodology
Step 1 - Identification of Relevant Samples Size from Population Database


Step 2 - Approaches for Defining Global Market Size (Value, Volume* & Price*)

Note*: In applicable scenarios
Step 3 - Data Sources
Primary Research
- Web Analytics
- Survey Reports
- Research Institute
- Latest Research Reports
- Opinion Leaders
Secondary Research
- Annual Reports
- White Paper
- Latest Press Release
- Industry Association
- Paid Database
- Investor Presentations

Step 4 - Data Triangulation
Involves using different sources of information in order to increase the validity of a study
These sources are likely to be stakeholders in a program - participants, other researchers, program staff, other community members, and so on.
Then we put all data in single framework & apply various statistical tools to find out the dynamic on the market.
During the analysis stage, feedback from the stakeholder groups would be compared to determine areas of agreement as well as areas of divergence