


Key Insights
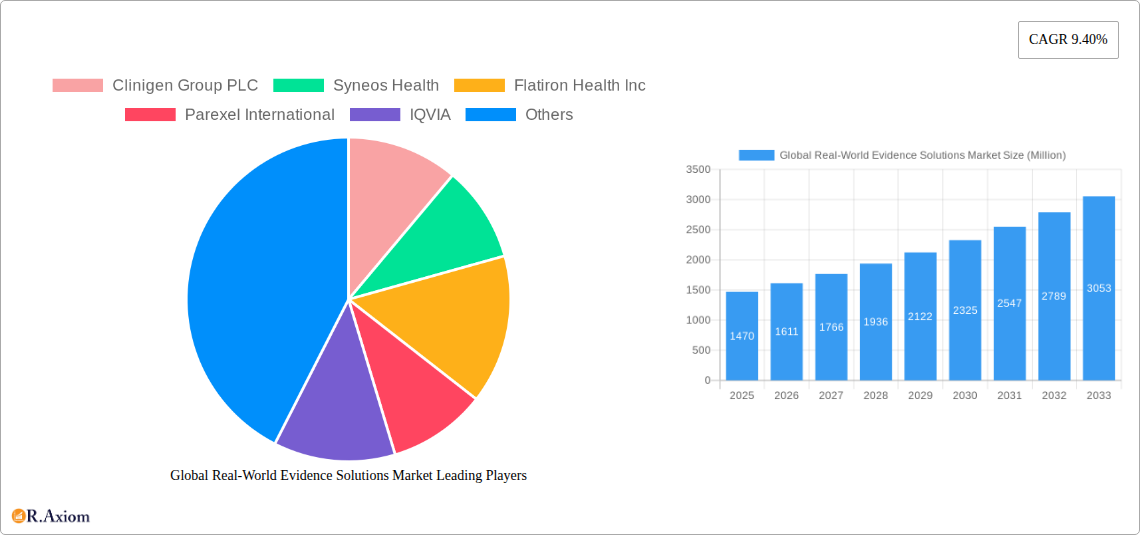
The Global Real-World Evidence (RWE) Solutions market is experiencing robust growth, projected to reach $1.47 billion in 2025 and maintain a Compound Annual Growth Rate (CAGR) of 9.40% from 2025 to 2033. This expansion is driven by several key factors. Increasing demand for faster and more cost-effective drug development and regulatory approvals fuels the adoption of RWE solutions. The growing volume of readily available healthcare data, including claims data, electronic health records (EHRs), and patient-generated health data (PGHD), offers rich insights for clinical research and post-market surveillance. Furthermore, the increasing prevalence of chronic diseases like oncology, immunology, and cardiovascular diseases necessitates effective real-world studies to understand long-term treatment effects and optimize patient care. Technological advancements in data analytics, artificial intelligence (AI), and machine learning (ML) further enhance the capabilities of RWE solutions, enabling more sophisticated data analysis and improved decision-making. The market is segmented by component (claims data, clinical settings data, patient-powered data, pharmacy data, and others), therapeutic area (oncology, immunology, neurology, cardiovascular disease, and others), and end-user (healthcare payers, healthcare providers, pharmaceutical & medical device companies, and others). North America currently dominates the market, but significant growth potential exists in Asia-Pacific and other emerging regions.
Global Real-World Evidence Solutions Market Market Size (In Billion)

The competitive landscape is characterized by a mix of large multinational companies and specialized technology providers. Key players such as IQVIA, Syneos Health, and Flatiron Health are investing heavily in developing advanced analytics platforms and expanding their service offerings to cater to the growing demand. The continued adoption of RWE solutions across the healthcare ecosystem is expected to drive further market consolidation and innovation. Factors such as data privacy concerns and regulatory hurdles represent challenges, but the overwhelming benefits of RWE in improving healthcare outcomes and streamlining drug development are expected to outweigh these obstacles, driving continued market growth throughout the forecast period.

Global Real-World Evidence Solutions Market Company Market Share
This in-depth report provides a comprehensive analysis of the Global Real-World Evidence (RWE) Solutions Market from 2019 to 2033. It delves into market dynamics, key players, emerging trends, and future growth projections, offering valuable insights for stakeholders across the healthcare and pharmaceutical industries. The report covers market segmentation by component (Claims Data, Clinical Settings Data, Patient-Powered Data, Pharmacy Data, Other Components), therapeutic area (Oncology, Immunology, Neurology, Cardiovascular Disease, Other Therapeutic Areas), and end-user (Healthcare Payers, Healthcare Providers, Pharmaceutical & Medical Device Companies, Other End Users). The study period spans 2019-2033, with 2025 as the base and estimated year, and a forecast period of 2025-2033. The historical period covered is 2019-2024.
Global Real-World Evidence Solutions Market Market Concentration & Innovation
The Global Real-World Evidence Solutions Market is characterized by a moderately concentrated landscape with several key players dominating the market share. While precise market share figures for individual companies are proprietary information within the full report, it's observed that leading companies like IQVIA, Syneos Health, and Parexel International hold significant market positions. The market's innovative nature is driven by advancements in data analytics, artificial intelligence (AI), and machine learning (ML). These technologies are enhancing the ability to extract meaningful insights from diverse RWE sources. The regulatory landscape plays a critical role, with agencies like the FDA increasingly embracing RWE in drug development and regulatory decisions. This necessitates robust data privacy and security protocols within the market. Product substitutes are minimal, mainly due to the unique nature of RWE data and the specialized expertise required for its analysis. However, the market witnesses increasing competition due to the entry of technology companies specializing in data analytics and cloud computing. End-user trends indicate a growing demand for real-time insights, personalized medicine solutions, and improved efficiency in clinical trials. Mergers and acquisitions (M&A) are frequent, with deals often valued in the hundreds of Millions, driven by companies seeking to expand their data capabilities and service offerings. For instance, while exact figures are not publicly available for all deals, several significant acquisitions involving substantial investment have shaped the market's competitive structure.
Global Real-World Evidence Solutions Market Industry Trends & Insights
The Global Real-World Evidence Solutions Market exhibits robust growth, projected to achieve a Compound Annual Growth Rate (CAGR) of xx% during the forecast period (2025-2033). This growth is fueled by several factors: increasing adoption of RWE by pharmaceutical and medical device companies for drug development and post-market surveillance; a growing emphasis on personalized medicine, which necessitates the use of RWE for targeted therapies; and escalating healthcare costs are driving the need for more efficient and cost-effective healthcare solutions. Technological advancements, particularly in big data analytics and AI, are significantly impacting market growth, enabling the processing and interpretation of massive datasets derived from various sources. Market penetration of RWE solutions is increasing rapidly, driven by awareness among healthcare professionals regarding the value of RWE in improving patient outcomes and treatment strategies. Competitive dynamics are characterized by innovation, strategic partnerships, and M&A activity, reflecting the market's dynamic nature. The market is also influenced by consumer preferences for greater transparency and control over their health data, emphasizing the need for ethical and secure RWE platforms.
Dominant Markets & Segments in Global Real-World Evidence Solutions Market
Leading Region/Country: North America currently dominates the market due to its advanced healthcare infrastructure, high RWE adoption rates, and supportive regulatory environment. Within North America, the USA holds a significant share.
Dominant Components: Claims data and electronic health record (EHR) data are currently the most dominant components, driving significant market revenue. However, the patient-powered data segment is experiencing rapid growth due to the increasing willingness of patients to share their health data and the increasing availability of wearable sensors that capture patient data outside of traditional clinical settings.
Dominant Therapeutic Areas: Oncology and cardiovascular disease currently hold significant market shares, driven by high prevalence rates and extensive research in these areas. However, the immunology and neurology sectors are experiencing rapid growth due to increasing investments in research and development.
Dominant End-Users: Pharmaceutical and medical device companies are leading end-users of RWE solutions, using these for clinical trial design, drug development, and regulatory submissions. Healthcare payers are also increasing their use of RWE to assess treatment effectiveness and optimize healthcare resource allocation.
Key Drivers in Dominant Segments:
- Pharmaceutical & Medical Device Companies: Stringent regulatory requirements for drug approvals, growing R&D investments, and the push for personalized medicine fuel high RWE adoption within this segment.
- Healthcare Payers: The need for cost-effective healthcare solutions and the ability of RWE to optimize resource allocation drives the use of RWE solutions.
- Oncology and Cardiovascular Disease: High prevalence rates and significant research investments in these areas create a large demand for RWE solutions.
Global Real-World Evidence Solutions Market Product Developments
Recent product innovations focus on integrating AI/ML for enhanced data analysis, cloud-based solutions for scalable data storage and processing, and user-friendly interfaces for improved accessibility. These advancements allow for more efficient data extraction, advanced statistical modeling, and generation of actionable insights. The competitive advantage lies in offering robust, scalable, and secure platforms that integrate diverse data sources, deliver timely insights, and comply with evolving regulatory requirements.
Report Scope & Segmentation Analysis
The report segments the market across various dimensions, including components (Claims Data, Clinical Settings Data, Patient-Powered Data, Pharmacy Data, Other Components), therapeutic areas (Oncology, Immunology, Neurology, Cardiovascular Disease, Other Therapeutic Areas), and end-users (Healthcare Payers, Healthcare Providers, Pharmaceutical & Medical Device Companies, Other End Users). Each segment is analyzed for growth projections, market sizes (in Millions), and competitive dynamics, providing a holistic understanding of the market landscape. For example, the Claims Data segment demonstrates a relatively mature market with steady growth projected, while the Patient-Powered Data segment exhibits rapid expansion. Similarly, the Oncology therapeutic area consistently shows high demand, reflective of the extensive research and development activities within the field.
Key Drivers of Global Real-World Evidence Solutions Market Growth
The market's growth is propelled by several factors: increasing adoption of RWE by regulatory bodies for drug approvals; rising demand for personalized medicine; technological advancements in data analytics and AI; and the growing need for cost-effective healthcare solutions. The regulatory environment, which is becoming increasingly supportive of RWE utilization, is a significant growth catalyst. The integration of wearable technology and remote monitoring also contributes to the expansion of available data.
Challenges in the Global Real-World Evidence Solutions Market Sector
Challenges include data privacy and security concerns; the need for interoperability between different data systems; regulatory complexities and variations across countries; and the potential for bias in RWE data. These factors can hinder the wider adoption of RWE solutions and influence market expansion. Furthermore, the high cost of developing and implementing RWE solutions can be a barrier for smaller companies. Data standardization and integration remains an ongoing hurdle impacting efficient data analysis.
Emerging Opportunities in Global Real-World Evidence Solutions Market
Emerging opportunities exist in developing innovative solutions for integrating various data sources; leveraging AI and machine learning for advanced data analysis; expanding into new geographic markets; and offering solutions that address specific therapeutic areas or patient populations. The increasing availability of patient-generated data through wearable sensors and mobile applications offers significant opportunities for expanding the scope of RWE. There is also scope for developing solutions that focus on patient engagement and empowerment.
Leading Players in the Global Real-World Evidence Solutions Market Market
Key Developments in Global Real-World Evidence Solutions Market Industry
December 2021: EVERSANA partnered with Janssen Research & Development LLC to advance evidence-based development of Janssen therapies. This strategic alliance signifies the increasing reliance on RWE for drug development.
October 2021: The Real-World Evidence Transparency Initiative launched a registry to promote transparency in RWE analysis and reporting. This initiative reflects the growing emphasis on data integrity and ethical considerations within the RWE field.
Strategic Outlook for Global Real-World Evidence Solutions Market Market
The Global Real-World Evidence Solutions Market holds immense potential for growth, driven by technological advancements, regulatory changes, and the expanding adoption of RWE across various sectors. The market's future growth hinges on overcoming challenges related to data privacy, security, and interoperability, while simultaneously capitalizing on opportunities in personalized medicine, patient engagement, and novel data sources. The continued integration of AI and machine learning will be crucial in unlocking the full potential of RWE. The market is poised for substantial expansion as the value of RWE in improving healthcare outcomes becomes increasingly recognized.
Global Real-World Evidence Solutions Market Segmentation
-
1. Component
- 1.1. Claims Data
- 1.2. Clinical Settings Data
- 1.3. Patient-Powered Data
- 1.4. Pharmacy Data
- 1.5. Other Components
-
2. Therapeutic Area
- 2.1. Oncology
- 2.2. Immunology
- 2.3. Neurology
- 2.4. Cardiovascular Disease
- 2.5. Other Therapeutic Areas
-
3. End User
- 3.1. Healthcare Payers
- 3.2. Healthcare Providers
- 3.3. Pharmaceutical & Medical Device Companies
- 3.4. Other End Users
Global Real-World Evidence Solutions Market Segmentation By Geography
-
1. North America
- 1.1. United States
- 1.2. Canada
- 1.3. Mexico
-
2. Europe
- 2.1. Germany
- 2.2. United Kingdom
- 2.3. France
- 2.4. Italy
- 2.5. Spain
- 2.6. Rest of Europe
-
3. Asia Pacific
- 3.1. China
- 3.2. Japan
- 3.3. India
- 3.4. Australia
- 3.5. South Korea
- 3.6. Rest of Asia Pacific
- 4. Middle East
-
5. GCC
- 5.1. South Africa
- 5.2. Rest of Middle East
-
6. South America
- 6.1. Brazil
- 6.2. Argentina
- 6.3. Rest of South America
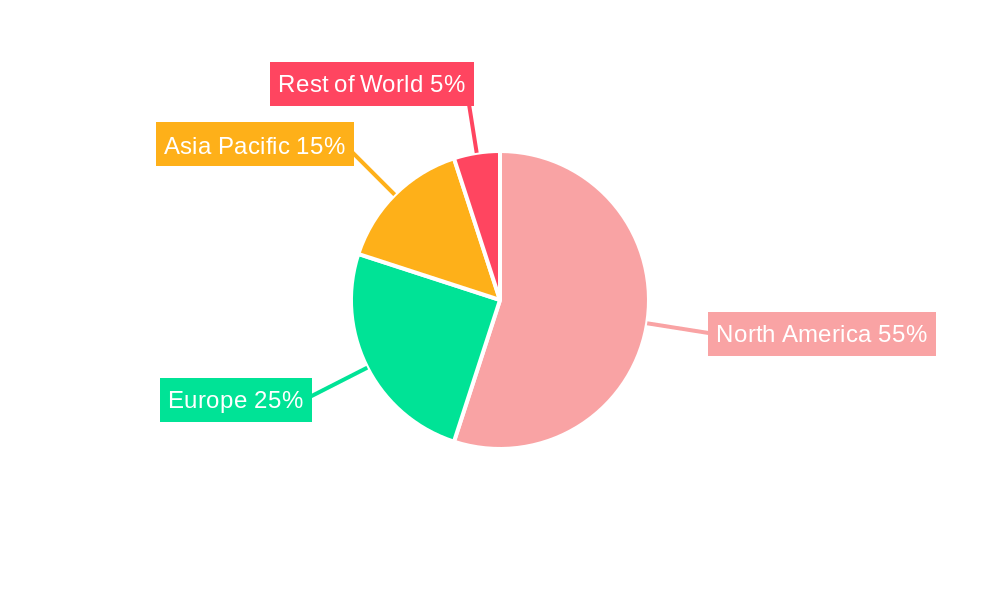
Global Real-World Evidence Solutions Market Regional Market Share
Geographic Coverage of Global Real-World Evidence Solutions Market
Global Real-World Evidence Solutions Market REPORT HIGHLIGHTS
| Aspects | Details |
|---|---|
| Study Period | 2020-2034 |
| Base Year | 2025 |
| Estimated Year | 2026 |
| Forecast Period | 2026-2034 |
| Historical Period | 2020-2025 |
| Growth Rate | CAGR of 9.40% from 2020-2034 |
| Segmentation |
|
Table of Contents
- 1. Introduction
- 1.1. Research Scope
- 1.2. Market Segmentation
- 1.3. Research Methodology
- 1.4. Definitions and Assumptions
- 2. Executive Summary
- 2.1. Introduction
- 3. Market Dynamics
- 3.1. Introduction
- 3.2. Market Drivers
- 3.2.1. Shift From Volume- to Value-based Care; Increasing Aging Population and Prevalence of Chronic Diseases
- 3.3. Market Restrains
- 3.3.1. Unwillingness to Rely on Real-world Studies; Lack of Standards
- 3.4. Market Trends
- 3.4.1. Oncology is Anticipated to be the Dominant Segment During the Forecast Period
- 4. Market Factor Analysis
- 4.1. Porters Five Forces
- 4.2. Supply/Value Chain
- 4.3. PESTEL analysis
- 4.4. Market Entropy
- 4.5. Patent/Trademark Analysis
- 5. Global Real-World Evidence Solutions Market Analysis, Insights and Forecast, 2020-2032
- 5.1. Market Analysis, Insights and Forecast - by Component
- 5.1.1. Claims Data
- 5.1.2. Clinical Settings Data
- 5.1.3. Patient-Powered Data
- 5.1.4. Pharmacy Data
- 5.1.5. Other Components
- 5.2. Market Analysis, Insights and Forecast - by Therapeutic Area
- 5.2.1. Oncology
- 5.2.2. Immunology
- 5.2.3. Neurology
- 5.2.4. Cardiovascular Disease
- 5.2.5. Other Therapeutic Areas
- 5.3. Market Analysis, Insights and Forecast - by End User
- 5.3.1. Healthcare Payers
- 5.3.2. Healthcare Providers
- 5.3.3. Pharmaceutical & Medical Device Companies
- 5.3.4. Other End Users
- 5.4. Market Analysis, Insights and Forecast - by Region
- 5.4.1. North America
- 5.4.2. Europe
- 5.4.3. Asia Pacific
- 5.4.4. Middle East
- 5.4.5. GCC
- 5.4.6. South America
- 5.1. Market Analysis, Insights and Forecast - by Component
- 6. North America Global Real-World Evidence Solutions Market Analysis, Insights and Forecast, 2020-2032
- 6.1. Market Analysis, Insights and Forecast - by Component
- 6.1.1. Claims Data
- 6.1.2. Clinical Settings Data
- 6.1.3. Patient-Powered Data
- 6.1.4. Pharmacy Data
- 6.1.5. Other Components
- 6.2. Market Analysis, Insights and Forecast - by Therapeutic Area
- 6.2.1. Oncology
- 6.2.2. Immunology
- 6.2.3. Neurology
- 6.2.4. Cardiovascular Disease
- 6.2.5. Other Therapeutic Areas
- 6.3. Market Analysis, Insights and Forecast - by End User
- 6.3.1. Healthcare Payers
- 6.3.2. Healthcare Providers
- 6.3.3. Pharmaceutical & Medical Device Companies
- 6.3.4. Other End Users
- 6.1. Market Analysis, Insights and Forecast - by Component
- 7. Europe Global Real-World Evidence Solutions Market Analysis, Insights and Forecast, 2020-2032
- 7.1. Market Analysis, Insights and Forecast - by Component
- 7.1.1. Claims Data
- 7.1.2. Clinical Settings Data
- 7.1.3. Patient-Powered Data
- 7.1.4. Pharmacy Data
- 7.1.5. Other Components
- 7.2. Market Analysis, Insights and Forecast - by Therapeutic Area
- 7.2.1. Oncology
- 7.2.2. Immunology
- 7.2.3. Neurology
- 7.2.4. Cardiovascular Disease
- 7.2.5. Other Therapeutic Areas
- 7.3. Market Analysis, Insights and Forecast - by End User
- 7.3.1. Healthcare Payers
- 7.3.2. Healthcare Providers
- 7.3.3. Pharmaceutical & Medical Device Companies
- 7.3.4. Other End Users
- 7.1. Market Analysis, Insights and Forecast - by Component
- 8. Asia Pacific Global Real-World Evidence Solutions Market Analysis, Insights and Forecast, 2020-2032
- 8.1. Market Analysis, Insights and Forecast - by Component
- 8.1.1. Claims Data
- 8.1.2. Clinical Settings Data
- 8.1.3. Patient-Powered Data
- 8.1.4. Pharmacy Data
- 8.1.5. Other Components
- 8.2. Market Analysis, Insights and Forecast - by Therapeutic Area
- 8.2.1. Oncology
- 8.2.2. Immunology
- 8.2.3. Neurology
- 8.2.4. Cardiovascular Disease
- 8.2.5. Other Therapeutic Areas
- 8.3. Market Analysis, Insights and Forecast - by End User
- 8.3.1. Healthcare Payers
- 8.3.2. Healthcare Providers
- 8.3.3. Pharmaceutical & Medical Device Companies
- 8.3.4. Other End Users
- 8.1. Market Analysis, Insights and Forecast - by Component
- 9. Middle East Global Real-World Evidence Solutions Market Analysis, Insights and Forecast, 2020-2032
- 9.1. Market Analysis, Insights and Forecast - by Component
- 9.1.1. Claims Data
- 9.1.2. Clinical Settings Data
- 9.1.3. Patient-Powered Data
- 9.1.4. Pharmacy Data
- 9.1.5. Other Components
- 9.2. Market Analysis, Insights and Forecast - by Therapeutic Area
- 9.2.1. Oncology
- 9.2.2. Immunology
- 9.2.3. Neurology
- 9.2.4. Cardiovascular Disease
- 9.2.5. Other Therapeutic Areas
- 9.3. Market Analysis, Insights and Forecast - by End User
- 9.3.1. Healthcare Payers
- 9.3.2. Healthcare Providers
- 9.3.3. Pharmaceutical & Medical Device Companies
- 9.3.4. Other End Users
- 9.1. Market Analysis, Insights and Forecast - by Component
- 10. GCC Global Real-World Evidence Solutions Market Analysis, Insights and Forecast, 2020-2032
- 10.1. Market Analysis, Insights and Forecast - by Component
- 10.1.1. Claims Data
- 10.1.2. Clinical Settings Data
- 10.1.3. Patient-Powered Data
- 10.1.4. Pharmacy Data
- 10.1.5. Other Components
- 10.2. Market Analysis, Insights and Forecast - by Therapeutic Area
- 10.2.1. Oncology
- 10.2.2. Immunology
- 10.2.3. Neurology
- 10.2.4. Cardiovascular Disease
- 10.2.5. Other Therapeutic Areas
- 10.3. Market Analysis, Insights and Forecast - by End User
- 10.3.1. Healthcare Payers
- 10.3.2. Healthcare Providers
- 10.3.3. Pharmaceutical & Medical Device Companies
- 10.3.4. Other End Users
- 10.1. Market Analysis, Insights and Forecast - by Component
- 11. South America Global Real-World Evidence Solutions Market Analysis, Insights and Forecast, 2020-2032
- 11.1. Market Analysis, Insights and Forecast - by Component
- 11.1.1. Claims Data
- 11.1.2. Clinical Settings Data
- 11.1.3. Patient-Powered Data
- 11.1.4. Pharmacy Data
- 11.1.5. Other Components
- 11.2. Market Analysis, Insights and Forecast - by Therapeutic Area
- 11.2.1. Oncology
- 11.2.2. Immunology
- 11.2.3. Neurology
- 11.2.4. Cardiovascular Disease
- 11.2.5. Other Therapeutic Areas
- 11.3. Market Analysis, Insights and Forecast - by End User
- 11.3.1. Healthcare Payers
- 11.3.2. Healthcare Providers
- 11.3.3. Pharmaceutical & Medical Device Companies
- 11.3.4. Other End Users
- 11.1. Market Analysis, Insights and Forecast - by Component
- 12. Competitive Analysis
- 12.1. Market Share Analysis 2025
- 12.2. Company Profiles
- 12.2.1 Clinigen Group PLC
- 12.2.1.1. Overview
- 12.2.1.2. Products
- 12.2.1.3. SWOT Analysis
- 12.2.1.4. Recent Developments
- 12.2.1.5. Financials (Based on Availability)
- 12.2.2 Syneos Health
- 12.2.2.1. Overview
- 12.2.2.2. Products
- 12.2.2.3. SWOT Analysis
- 12.2.2.4. Recent Developments
- 12.2.2.5. Financials (Based on Availability)
- 12.2.3 Flatiron Health Inc
- 12.2.3.1. Overview
- 12.2.3.2. Products
- 12.2.3.3. SWOT Analysis
- 12.2.3.4. Recent Developments
- 12.2.3.5. Financials (Based on Availability)
- 12.2.4 Parexel International
- 12.2.4.1. Overview
- 12.2.4.2. Products
- 12.2.4.3. SWOT Analysis
- 12.2.4.4. Recent Developments
- 12.2.4.5. Financials (Based on Availability)
- 12.2.5 IQVIA
- 12.2.5.1. Overview
- 12.2.5.2. Products
- 12.2.5.3. SWOT Analysis
- 12.2.5.4. Recent Developments
- 12.2.5.5. Financials (Based on Availability)
- 12.2.6 SAS Institute
- 12.2.6.1. Overview
- 12.2.6.2. Products
- 12.2.6.3. SWOT Analysis
- 12.2.6.4. Recent Developments
- 12.2.6.5. Financials (Based on Availability)
- 12.2.7 Pharmaceutical Product Development (PPD Inc )
- 12.2.7.1. Overview
- 12.2.7.2. Products
- 12.2.7.3. SWOT Analysis
- 12.2.7.4. Recent Developments
- 12.2.7.5. Financials (Based on Availability)
- 12.2.8 Oracle Corporation
- 12.2.8.1. Overview
- 12.2.8.2. Products
- 12.2.8.3. SWOT Analysis
- 12.2.8.4. Recent Developments
- 12.2.8.5. Financials (Based on Availability)
- 12.2.9 PerkinElmer Inc
- 12.2.9.1. Overview
- 12.2.9.2. Products
- 12.2.9.3. SWOT Analysis
- 12.2.9.4. Recent Developments
- 12.2.9.5. Financials (Based on Availability)
- 12.2.10 IBM
- 12.2.10.1. Overview
- 12.2.10.2. Products
- 12.2.10.3. SWOT Analysis
- 12.2.10.4. Recent Developments
- 12.2.10.5. Financials (Based on Availability)
- 12.2.11 Icon PLC
- 12.2.11.1. Overview
- 12.2.11.2. Products
- 12.2.11.3. SWOT Analysis
- 12.2.11.4. Recent Developments
- 12.2.11.5. Financials (Based on Availability)
- 12.2.1 Clinigen Group PLC
List of Figures
- Figure 1: Global Global Real-World Evidence Solutions Market Revenue Breakdown (Million, %) by Region 2025 & 2033
- Figure 2: North America Global Real-World Evidence Solutions Market Revenue (Million), by Component 2025 & 2033
- Figure 3: North America Global Real-World Evidence Solutions Market Revenue Share (%), by Component 2025 & 2033
- Figure 4: North America Global Real-World Evidence Solutions Market Revenue (Million), by Therapeutic Area 2025 & 2033
- Figure 5: North America Global Real-World Evidence Solutions Market Revenue Share (%), by Therapeutic Area 2025 & 2033
- Figure 6: North America Global Real-World Evidence Solutions Market Revenue (Million), by End User 2025 & 2033
- Figure 7: North America Global Real-World Evidence Solutions Market Revenue Share (%), by End User 2025 & 2033
- Figure 8: North America Global Real-World Evidence Solutions Market Revenue (Million), by Country 2025 & 2033
- Figure 9: North America Global Real-World Evidence Solutions Market Revenue Share (%), by Country 2025 & 2033
- Figure 10: Europe Global Real-World Evidence Solutions Market Revenue (Million), by Component 2025 & 2033
- Figure 11: Europe Global Real-World Evidence Solutions Market Revenue Share (%), by Component 2025 & 2033
- Figure 12: Europe Global Real-World Evidence Solutions Market Revenue (Million), by Therapeutic Area 2025 & 2033
- Figure 13: Europe Global Real-World Evidence Solutions Market Revenue Share (%), by Therapeutic Area 2025 & 2033
- Figure 14: Europe Global Real-World Evidence Solutions Market Revenue (Million), by End User 2025 & 2033
- Figure 15: Europe Global Real-World Evidence Solutions Market Revenue Share (%), by End User 2025 & 2033
- Figure 16: Europe Global Real-World Evidence Solutions Market Revenue (Million), by Country 2025 & 2033
- Figure 17: Europe Global Real-World Evidence Solutions Market Revenue Share (%), by Country 2025 & 2033
- Figure 18: Asia Pacific Global Real-World Evidence Solutions Market Revenue (Million), by Component 2025 & 2033
- Figure 19: Asia Pacific Global Real-World Evidence Solutions Market Revenue Share (%), by Component 2025 & 2033
- Figure 20: Asia Pacific Global Real-World Evidence Solutions Market Revenue (Million), by Therapeutic Area 2025 & 2033
- Figure 21: Asia Pacific Global Real-World Evidence Solutions Market Revenue Share (%), by Therapeutic Area 2025 & 2033
- Figure 22: Asia Pacific Global Real-World Evidence Solutions Market Revenue (Million), by End User 2025 & 2033
- Figure 23: Asia Pacific Global Real-World Evidence Solutions Market Revenue Share (%), by End User 2025 & 2033
- Figure 24: Asia Pacific Global Real-World Evidence Solutions Market Revenue (Million), by Country 2025 & 2033
- Figure 25: Asia Pacific Global Real-World Evidence Solutions Market Revenue Share (%), by Country 2025 & 2033
- Figure 26: Middle East Global Real-World Evidence Solutions Market Revenue (Million), by Component 2025 & 2033
- Figure 27: Middle East Global Real-World Evidence Solutions Market Revenue Share (%), by Component 2025 & 2033
- Figure 28: Middle East Global Real-World Evidence Solutions Market Revenue (Million), by Therapeutic Area 2025 & 2033
- Figure 29: Middle East Global Real-World Evidence Solutions Market Revenue Share (%), by Therapeutic Area 2025 & 2033
- Figure 30: Middle East Global Real-World Evidence Solutions Market Revenue (Million), by End User 2025 & 2033
- Figure 31: Middle East Global Real-World Evidence Solutions Market Revenue Share (%), by End User 2025 & 2033
- Figure 32: Middle East Global Real-World Evidence Solutions Market Revenue (Million), by Country 2025 & 2033
- Figure 33: Middle East Global Real-World Evidence Solutions Market Revenue Share (%), by Country 2025 & 2033
- Figure 34: GCC Global Real-World Evidence Solutions Market Revenue (Million), by Component 2025 & 2033
- Figure 35: GCC Global Real-World Evidence Solutions Market Revenue Share (%), by Component 2025 & 2033
- Figure 36: GCC Global Real-World Evidence Solutions Market Revenue (Million), by Therapeutic Area 2025 & 2033
- Figure 37: GCC Global Real-World Evidence Solutions Market Revenue Share (%), by Therapeutic Area 2025 & 2033
- Figure 38: GCC Global Real-World Evidence Solutions Market Revenue (Million), by End User 2025 & 2033
- Figure 39: GCC Global Real-World Evidence Solutions Market Revenue Share (%), by End User 2025 & 2033
- Figure 40: GCC Global Real-World Evidence Solutions Market Revenue (Million), by Country 2025 & 2033
- Figure 41: GCC Global Real-World Evidence Solutions Market Revenue Share (%), by Country 2025 & 2033
- Figure 42: South America Global Real-World Evidence Solutions Market Revenue (Million), by Component 2025 & 2033
- Figure 43: South America Global Real-World Evidence Solutions Market Revenue Share (%), by Component 2025 & 2033
- Figure 44: South America Global Real-World Evidence Solutions Market Revenue (Million), by Therapeutic Area 2025 & 2033
- Figure 45: South America Global Real-World Evidence Solutions Market Revenue Share (%), by Therapeutic Area 2025 & 2033
- Figure 46: South America Global Real-World Evidence Solutions Market Revenue (Million), by End User 2025 & 2033
- Figure 47: South America Global Real-World Evidence Solutions Market Revenue Share (%), by End User 2025 & 2033
- Figure 48: South America Global Real-World Evidence Solutions Market Revenue (Million), by Country 2025 & 2033
- Figure 49: South America Global Real-World Evidence Solutions Market Revenue Share (%), by Country 2025 & 2033
List of Tables
- Table 1: Global Real-World Evidence Solutions Market Revenue Million Forecast, by Component 2020 & 2033
- Table 2: Global Real-World Evidence Solutions Market Revenue Million Forecast, by Therapeutic Area 2020 & 2033
- Table 3: Global Real-World Evidence Solutions Market Revenue Million Forecast, by End User 2020 & 2033
- Table 4: Global Real-World Evidence Solutions Market Revenue Million Forecast, by Region 2020 & 2033
- Table 5: Global Real-World Evidence Solutions Market Revenue Million Forecast, by Component 2020 & 2033
- Table 6: Global Real-World Evidence Solutions Market Revenue Million Forecast, by Therapeutic Area 2020 & 2033
- Table 7: Global Real-World Evidence Solutions Market Revenue Million Forecast, by End User 2020 & 2033
- Table 8: Global Real-World Evidence Solutions Market Revenue Million Forecast, by Country 2020 & 2033
- Table 9: United States Global Real-World Evidence Solutions Market Revenue (Million) Forecast, by Application 2020 & 2033
- Table 10: Canada Global Real-World Evidence Solutions Market Revenue (Million) Forecast, by Application 2020 & 2033
- Table 11: Mexico Global Real-World Evidence Solutions Market Revenue (Million) Forecast, by Application 2020 & 2033
- Table 12: Global Real-World Evidence Solutions Market Revenue Million Forecast, by Component 2020 & 2033
- Table 13: Global Real-World Evidence Solutions Market Revenue Million Forecast, by Therapeutic Area 2020 & 2033
- Table 14: Global Real-World Evidence Solutions Market Revenue Million Forecast, by End User 2020 & 2033
- Table 15: Global Real-World Evidence Solutions Market Revenue Million Forecast, by Country 2020 & 2033
- Table 16: Germany Global Real-World Evidence Solutions Market Revenue (Million) Forecast, by Application 2020 & 2033
- Table 17: United Kingdom Global Real-World Evidence Solutions Market Revenue (Million) Forecast, by Application 2020 & 2033
- Table 18: France Global Real-World Evidence Solutions Market Revenue (Million) Forecast, by Application 2020 & 2033
- Table 19: Italy Global Real-World Evidence Solutions Market Revenue (Million) Forecast, by Application 2020 & 2033
- Table 20: Spain Global Real-World Evidence Solutions Market Revenue (Million) Forecast, by Application 2020 & 2033
- Table 21: Rest of Europe Global Real-World Evidence Solutions Market Revenue (Million) Forecast, by Application 2020 & 2033
- Table 22: Global Real-World Evidence Solutions Market Revenue Million Forecast, by Component 2020 & 2033
- Table 23: Global Real-World Evidence Solutions Market Revenue Million Forecast, by Therapeutic Area 2020 & 2033
- Table 24: Global Real-World Evidence Solutions Market Revenue Million Forecast, by End User 2020 & 2033
- Table 25: Global Real-World Evidence Solutions Market Revenue Million Forecast, by Country 2020 & 2033
- Table 26: China Global Real-World Evidence Solutions Market Revenue (Million) Forecast, by Application 2020 & 2033
- Table 27: Japan Global Real-World Evidence Solutions Market Revenue (Million) Forecast, by Application 2020 & 2033
- Table 28: India Global Real-World Evidence Solutions Market Revenue (Million) Forecast, by Application 2020 & 2033
- Table 29: Australia Global Real-World Evidence Solutions Market Revenue (Million) Forecast, by Application 2020 & 2033
- Table 30: South Korea Global Real-World Evidence Solutions Market Revenue (Million) Forecast, by Application 2020 & 2033
- Table 31: Rest of Asia Pacific Global Real-World Evidence Solutions Market Revenue (Million) Forecast, by Application 2020 & 2033
- Table 32: Global Real-World Evidence Solutions Market Revenue Million Forecast, by Component 2020 & 2033
- Table 33: Global Real-World Evidence Solutions Market Revenue Million Forecast, by Therapeutic Area 2020 & 2033
- Table 34: Global Real-World Evidence Solutions Market Revenue Million Forecast, by End User 2020 & 2033
- Table 35: Global Real-World Evidence Solutions Market Revenue Million Forecast, by Country 2020 & 2033
- Table 36: Global Real-World Evidence Solutions Market Revenue Million Forecast, by Component 2020 & 2033
- Table 37: Global Real-World Evidence Solutions Market Revenue Million Forecast, by Therapeutic Area 2020 & 2033
- Table 38: Global Real-World Evidence Solutions Market Revenue Million Forecast, by End User 2020 & 2033
- Table 39: Global Real-World Evidence Solutions Market Revenue Million Forecast, by Country 2020 & 2033
- Table 40: South Africa Global Real-World Evidence Solutions Market Revenue (Million) Forecast, by Application 2020 & 2033
- Table 41: Rest of Middle East Global Real-World Evidence Solutions Market Revenue (Million) Forecast, by Application 2020 & 2033
- Table 42: Global Real-World Evidence Solutions Market Revenue Million Forecast, by Component 2020 & 2033
- Table 43: Global Real-World Evidence Solutions Market Revenue Million Forecast, by Therapeutic Area 2020 & 2033
- Table 44: Global Real-World Evidence Solutions Market Revenue Million Forecast, by End User 2020 & 2033
- Table 45: Global Real-World Evidence Solutions Market Revenue Million Forecast, by Country 2020 & 2033
- Table 46: Brazil Global Real-World Evidence Solutions Market Revenue (Million) Forecast, by Application 2020 & 2033
- Table 47: Argentina Global Real-World Evidence Solutions Market Revenue (Million) Forecast, by Application 2020 & 2033
- Table 48: Rest of South America Global Real-World Evidence Solutions Market Revenue (Million) Forecast, by Application 2020 & 2033
Frequently Asked Questions
1. What is the projected Compound Annual Growth Rate (CAGR) of the Global Real-World Evidence Solutions Market?
The projected CAGR is approximately 9.40%.
2. Which companies are prominent players in the Global Real-World Evidence Solutions Market?
Key companies in the market include Clinigen Group PLC, Syneos Health, Flatiron Health Inc, Parexel International, IQVIA, SAS Institute, Pharmaceutical Product Development (PPD Inc ), Oracle Corporation, PerkinElmer Inc, IBM, Icon PLC.
3. What are the main segments of the Global Real-World Evidence Solutions Market?
The market segments include Component, Therapeutic Area, End User.
4. Can you provide details about the market size?
The market size is estimated to be USD 1.47 Million as of 2022.
5. What are some drivers contributing to market growth?
Shift From Volume- to Value-based Care; Increasing Aging Population and Prevalence of Chronic Diseases.
6. What are the notable trends driving market growth?
Oncology is Anticipated to be the Dominant Segment During the Forecast Period.
7. Are there any restraints impacting market growth?
Unwillingness to Rely on Real-world Studies; Lack of Standards.
8. Can you provide examples of recent developments in the market?
In December 2021, EVERSANA signed an agreement with Janssen Research & Development LLC (Janssen) to drive evidence-based development of Janssen therapies, treatments, and patient support models.
9. What pricing options are available for accessing the report?
Pricing options include single-user, multi-user, and enterprise licenses priced at USD 4750, USD 5250, and USD 8750 respectively.
10. Is the market size provided in terms of value or volume?
The market size is provided in terms of value, measured in Million.
11. Are there any specific market keywords associated with the report?
Yes, the market keyword associated with the report is "Global Real-World Evidence Solutions Market," which aids in identifying and referencing the specific market segment covered.
12. How do I determine which pricing option suits my needs best?
The pricing options vary based on user requirements and access needs. Individual users may opt for single-user licenses, while businesses requiring broader access may choose multi-user or enterprise licenses for cost-effective access to the report.
13. Are there any additional resources or data provided in the Global Real-World Evidence Solutions Market report?
While the report offers comprehensive insights, it's advisable to review the specific contents or supplementary materials provided to ascertain if additional resources or data are available.
14. How can I stay updated on further developments or reports in the Global Real-World Evidence Solutions Market?
To stay informed about further developments, trends, and reports in the Global Real-World Evidence Solutions Market, consider subscribing to industry newsletters, following relevant companies and organizations, or regularly checking reputable industry news sources and publications.
Methodology
Step 1 - Identification of Relevant Samples Size from Population Database


Step 2 - Approaches for Defining Global Market Size (Value, Volume* & Price*)

Note*: In applicable scenarios
Step 3 - Data Sources
Primary Research
- Web Analytics
- Survey Reports
- Research Institute
- Latest Research Reports
- Opinion Leaders
Secondary Research
- Annual Reports
- White Paper
- Latest Press Release
- Industry Association
- Paid Database
- Investor Presentations

Step 4 - Data Triangulation
Involves using different sources of information in order to increase the validity of a study
These sources are likely to be stakeholders in a program - participants, other researchers, program staff, other community members, and so on.
Then we put all data in single framework & apply various statistical tools to find out the dynamic on the market.
During the analysis stage, feedback from the stakeholder groups would be compared to determine areas of agreement as well as areas of divergence