Global Valves Market in Chemical Industry Report 2025: Growth Driven by Government Incentives and Partnerships

Global Valves Market in Chemical Industry by Production Analysis, by Consumption Analysis, by Import Market Analysis (Value & Volume), by Export Market Analysis (Value & Volume), by Price Trend Analysis, by North America, by Europe, by Asia Pacific, by Latin America, by Middle East and Africa Forecast 2025-2033

Jun 30 2025
Base Year: 2024

234 Pages
Main Logo

Global Valves Market in Chemical Industry Report 2025: Growth Driven by Government Incentives and Partnerships


Home
Industries
Technology, Media and Telecom
sponsor image
sponsor image
sponsor image
sponsor image
sponsor image
sponsor image
sponsor image
sponsor image
sponsor image
sponsor image
sponsor image
sponsor image
sponsor image
sponsor image
sponsor image
sponsor image
sponsor image
sponsor image
sponsor image
sponsor image

Tailored for you

  • In-depth Analysis Tailored to Specified Regions or Segments
  • Company Profiles Customized to User Preferences
  • Comprehensive Insights Focused on Specific Segments or Regions
  • Customized Evaluation of Competitive Landscape to Meet Your Needs
  • Tailored Customization to Address Other Specific Requirements
Ask for customization


Key Insights

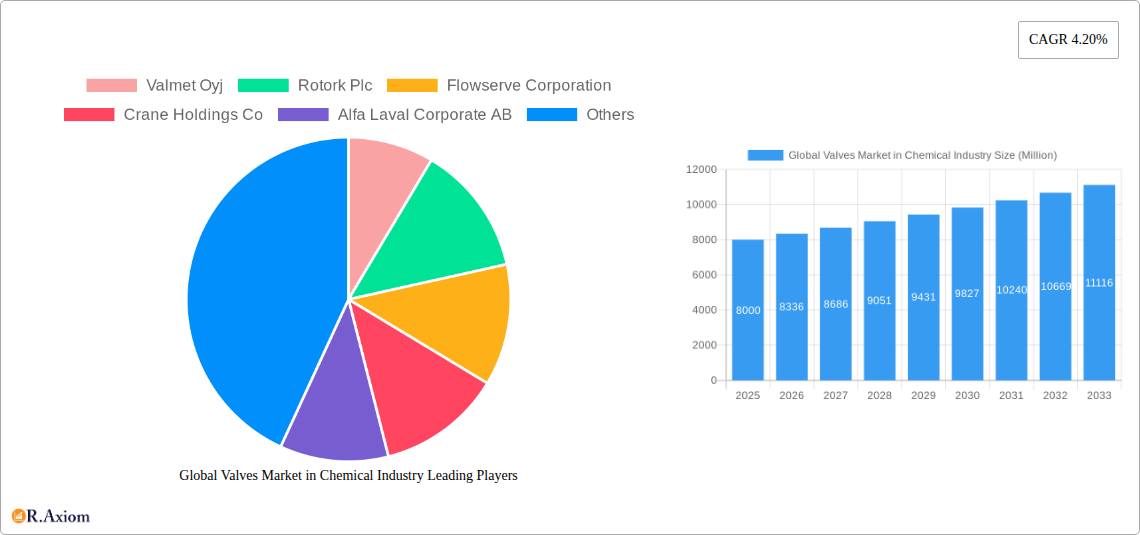
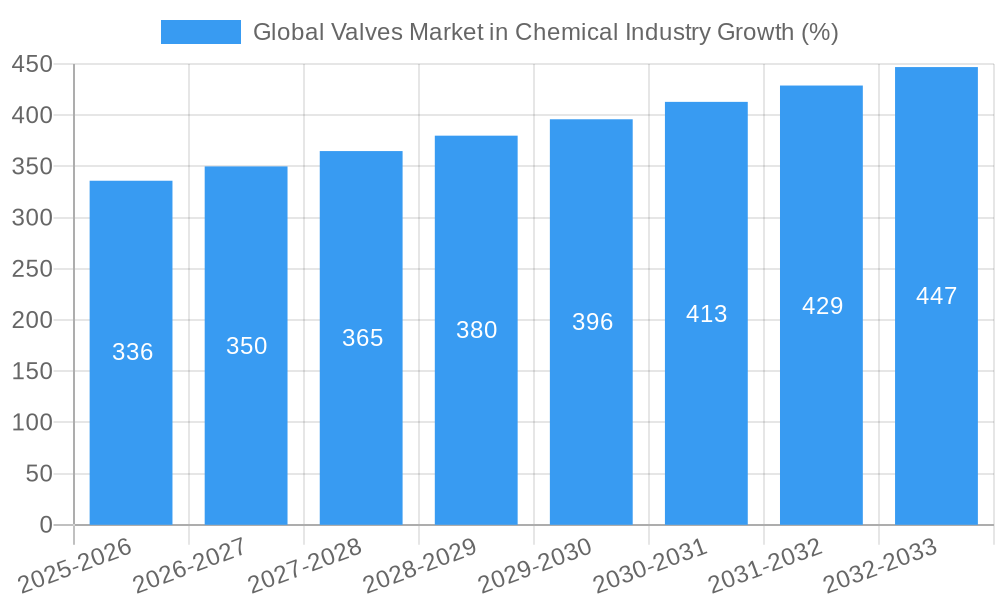
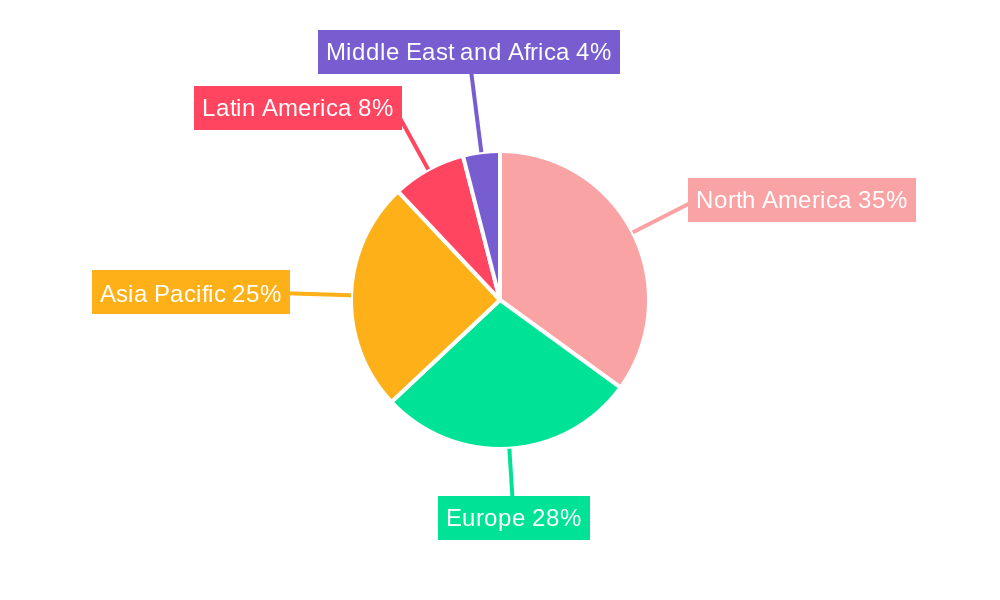
The global valves market in the chemical industry is experiencing robust growth, driven by increasing investments in chemical production facilities and infrastructure, particularly in developing economies. A compound annual growth rate (CAGR) of 4.20% from 2019 to 2024 suggests a significant expansion, and this momentum is expected to continue through 2033. Key growth drivers include rising demand for chemical products across various sectors (pharmaceuticals, plastics, fertilizers), stringent regulatory compliance necessitating advanced valve technologies for safety and emissions control, and automation trends increasing the adoption of sophisticated control valves. Market segmentation reveals a strong preference for ball valves due to their simplicity and cost-effectiveness, while the butterfly and gate/globe/check valve segments are also substantial, catering to specific process requirements. The control valve segment is experiencing rapid growth, fueled by the increasing emphasis on precise process control and optimization. Geographic analysis indicates a strong presence in North America and Europe, but the Asia-Pacific region is expected to show the most significant growth potential, given its expanding chemical production capacity and industrialization. Challenges include fluctuating raw material prices and potential supply chain disruptions, although technological advancements in materials and manufacturing processes are mitigating these concerns.

The competitive landscape is characterized by established players such as Valmet Oyj, Rotork Plc, and Flowserve Corporation, along with regional and specialized manufacturers. These companies are focusing on innovation, including developing smart valves with enhanced monitoring and control capabilities, to meet growing industry demands. Future market trends indicate a strong emphasis on sustainable practices, leading to the increased adoption of energy-efficient valve designs and materials with lower environmental impact. Furthermore, digitalization is playing a crucial role, with the integration of valves into industrial internet of things (IIoT) systems for enhanced process visibility and predictive maintenance. This evolution toward smarter, more sustainable, and digitally integrated valve technologies is expected to shape the market's trajectory in the coming years. Assuming a 2025 market size of $8 billion (a reasonable estimate given the CAGR and industry size), and applying the 4.2% CAGR, the market will continue to expand significantly over the forecast period.

Global Valves Market in Chemical Industry Research Report - Market Size, Growth & Forecast

Global Valves Market in Chemical Industry: A Comprehensive Market Report (2019-2033)

This comprehensive report provides a detailed analysis of the Global Valves Market in the Chemical Industry, offering invaluable insights for stakeholders, investors, and industry professionals. Covering the period 2019-2033, with a base year of 2025, this report unveils market dynamics, growth drivers, challenges, and opportunities within this critical sector. The report meticulously analyzes market concentration, innovation trends, key players, and emerging technologies, providing a robust foundation for strategic decision-making. The market size is estimated at xx Million in 2025 and is projected to reach xx Million by 2033, exhibiting a CAGR of xx%.

Global Valves Market in Chemical Industry Market Concentration & Innovation

This section analyzes the competitive landscape of the global valves market within the chemical industry. Market concentration is assessed through metrics such as market share held by leading players like Valmet Oyj, Rotork Plc, Flowserve Corporation, Crane Holdings Co, Alfa Laval Corporate AB, Emerson Electric Co, Samson Controls Inc, IMI Critical Engineering, Schlumberger Limited, and KITZ Corporation. The report examines the impact of mergers and acquisitions (M&A) activities, such as the January 2021 acquisition of Red Valve by DeZURIK, Inc., on market consolidation and competitive dynamics. Deal values for significant M&A transactions are included where available. xx Million is estimated as the total value of M&A activities within the period.

  • Market Share Analysis: Detailed breakdown of market share held by top 10 players.
  • Innovation Drivers: Examination of factors driving innovation, including advancements in materials science, automation, and smart technologies.
  • Regulatory Frameworks: Analysis of relevant regulations and their impact on market growth and product development.
  • Product Substitutes: Assessment of potential substitutes and their influence on market competition.
  • End-User Trends: Exploration of evolving end-user needs and preferences influencing demand for specific valve types.

Global Valves Market in Chemical Industry Industry Trends & Insights

This section delves into the key trends shaping the global valves market in the chemical industry. It examines market growth drivers, including increasing demand from expanding chemical production facilities, the adoption of advanced automation systems, and stringent environmental regulations pushing for improved valve efficiency. Technological disruptions, such as the integration of smart sensors and digitalization, are also thoroughly discussed, along with their impact on market penetration and consumer preferences. Competitive dynamics, including pricing strategies, product differentiation, and technological advancements, are analyzed to provide a comprehensive understanding of the market landscape. The report uses the data from 2019 to 2024 to support the analysis.

  • Growth Drivers: Increased chemical production, automation, stringent environmental regulations.
  • Technological Disruptions: Smart valves, digitalization, predictive maintenance.
  • Consumer Preferences: Demand for higher efficiency, reliability, and safety.
  • Competitive Dynamics: Market share analysis, pricing strategies, product differentiation.
Global Valves Market in Chemical Industry Growth

Dominant Markets & Segments in Global Valves Market in Chemical Industry

This section identifies the leading regions, countries, and segments within the global valves market for the chemical industry. A detailed analysis of the dominant segment (e.g., Ball Valves, or a specific region like North America) is presented, including key growth drivers.

  • By Type:

    • Ball Valves: High demand driven by xx.
    • Butterfly Valves: Growth driven by xx.
    • Gate/Globe/Check Valves: Market share and growth trajectory.
    • Plug Valves: Market size and growth potential.
    • Control Valves: Analysis of the market size and growth drivers.
    • Other Types: Overview of niche valve types and their market contribution.
  • Key Drivers (for Dominant Segment):

    • Economic policies that support the chemical industry in the region.
    • Robust infrastructure that facilitates chemical production and distribution.
    • Growing demand from specific end-use applications.

Global Valves Market in Chemical Industry Product Developments

Recent product innovations highlight advancements in materials, design, and functionality. For instance, Hitachi's launch of the Class150 Flanged double offset ball valve in May 2021 demonstrates a focus on handling challenging fluids and solids in wastewater and chemical plants. This "no-pocket" design minimizes flow stagnation and improves operational stability. These innovations enhance valve performance, reliability, and efficiency, leading to improved market fit and competitive advantages.

Report Scope & Segmentation Analysis

This report segments the global valves market in the chemical industry by valve type: Ball, Butterfly, Gate/Globe/Check, Plug, Control, and Other Types. Each segment is analyzed based on market size, growth projections, and competitive dynamics. The report covers the historical period (2019-2024), the base year (2025), and the forecast period (2025-2033). Each segment's individual growth trajectory is detailed, with insights into factors influencing its performance.

Key Drivers of Global Valves Market in Chemical Industry Growth

Several factors drive growth in this market. These include the expanding chemical production capacity globally, increasing demand for efficient and reliable valves in chemical processes, stricter environmental regulations promoting the adoption of eco-friendly valves, and ongoing technological advancements leading to improved valve performance and functionalities.

Challenges in the Global Valves Market in Chemical Industry Sector

The market faces challenges, including fluctuating raw material prices impacting production costs, supply chain disruptions due to geopolitical uncertainties, intense competition from established and emerging players, and stringent regulatory compliance requirements adding to operational complexity. These factors can significantly impact profitability and market expansion.

Emerging Opportunities in Global Valves Market in Chemical Industry

Emerging opportunities arise from the increasing adoption of smart valves and digital technologies, expanding applications in specialized chemical processes, and growth in developing economies. Demand for sustainable and energy-efficient valves also presents significant opportunities.

Leading Players in the Global Valves Market in Chemical Industry Market

  • Valmet Oyj
  • Rotork Plc
  • Flowserve Corporation
  • Crane Holdings Co
  • Alfa Laval Corporate AB
  • Emerson Electric Co
  • Samson Controls Inc
  • IMI Critical Engineering
  • Schlumberger Limited
  • KITZ Corporation

Key Developments in Global Valves Market in Chemical Industry Industry

  • May 2021: Hitachi launched its Class150 Flanged double offset ball valve, enhancing fluid handling capabilities.
  • January 2021: DeZURIK, Inc. acquired Red Valve, expanding its product portfolio and market presence.

Strategic Outlook for Global Valves Market in Chemical Industry Market

The global valves market in the chemical industry is poised for continued growth, driven by technological advancements, increasing chemical production, and stringent environmental regulations. Opportunities exist in developing sustainable, smart, and efficient valve solutions to meet evolving industry needs. The market's future trajectory is positive, with significant potential for innovation and expansion.

Global Valves Market in Chemical Industry Segmentation

  • 1. Production Analysis
  • 2. Consumption Analysis
  • 3. Import Market Analysis (Value & Volume)
  • 4. Export Market Analysis (Value & Volume)
  • 5. Price Trend Analysis

Global Valves Market in Chemical Industry Segmentation By Geography

  • 1. North America
  • 2. Europe
  • 3. Asia Pacific
  • 4. Latin America
  • 5. Middle East and Africa
Global Valves Market in Chemical Industry Regional Share


Global Valves Market in Chemical Industry REPORT HIGHLIGHTS

AspectsDetails
Study Period 2019-2033
Base Year 2024
Estimated Year 2025
Forecast Period2025-2033
Historical Period2019-2024
Growth RateCAGR of 4.20% from 2019-2033
Segmentation
    • By Production Analysis
    • By Consumption Analysis
    • By Import Market Analysis (Value & Volume)
    • By Export Market Analysis (Value & Volume)
    • By Price Trend Analysis
  • By Geography
    • North America
    • Europe
    • Asia Pacific
    • Latin America
    • Middle East and Africa


Table of Contents

  1. 1. Introduction
    • 1.1. Research Scope
    • 1.2. Market Segmentation
    • 1.3. Research Methodology
    • 1.4. Definitions and Assumptions
  2. 2. Executive Summary
    • 2.1. Introduction
  3. 3. Market Dynamics
    • 3.1. Introduction
      • 3.2. Market Drivers
        • 3.2.1. Growing Demand for Process Safety; Growing Adoption of Process Automation
      • 3.3. Market Restrains
        • 3.3.1. Lack of Standardized Policies and High Replacement Costs
      • 3.4. Market Trends
        • 3.4.1. Growing Expansion of Specialty Chemical Manufacturing Companies Owing to Increasing Demand
  4. 4. Market Factor Analysis
    • 4.1. Porters Five Forces
    • 4.2. Supply/Value Chain
    • 4.3. PESTEL analysis
    • 4.4. Market Entropy
    • 4.5. Patent/Trademark Analysis
  5. 5. Global Valves Market in Chemical Industry Analysis, Insights and Forecast, 2019-2031
    • 5.1. Market Analysis, Insights and Forecast - by Production Analysis
      • 5.2. Market Analysis, Insights and Forecast - by Consumption Analysis
        • 5.3. Market Analysis, Insights and Forecast - by Import Market Analysis (Value & Volume)
          • 5.4. Market Analysis, Insights and Forecast - by Export Market Analysis (Value & Volume)
            • 5.5. Market Analysis, Insights and Forecast - by Price Trend Analysis
              • 5.6. Market Analysis, Insights and Forecast - by Region
                • 5.6.1. North America
                • 5.6.2. Europe
                • 5.6.3. Asia Pacific
                • 5.6.4. Latin America
                • 5.6.5. Middle East and Africa
            • 6. North America Global Valves Market in Chemical Industry Analysis, Insights and Forecast, 2019-2031
              • 6.1. Market Analysis, Insights and Forecast - by Production Analysis
                • 6.2. Market Analysis, Insights and Forecast - by Consumption Analysis
                  • 6.3. Market Analysis, Insights and Forecast - by Import Market Analysis (Value & Volume)
                    • 6.4. Market Analysis, Insights and Forecast - by Export Market Analysis (Value & Volume)
                      • 6.5. Market Analysis, Insights and Forecast - by Price Trend Analysis
                      • 7. Europe Global Valves Market in Chemical Industry Analysis, Insights and Forecast, 2019-2031
                        • 7.1. Market Analysis, Insights and Forecast - by Production Analysis
                          • 7.2. Market Analysis, Insights and Forecast - by Consumption Analysis
                            • 7.3. Market Analysis, Insights and Forecast - by Import Market Analysis (Value & Volume)
                              • 7.4. Market Analysis, Insights and Forecast - by Export Market Analysis (Value & Volume)
                                • 7.5. Market Analysis, Insights and Forecast - by Price Trend Analysis
                                • 8. Asia Pacific Global Valves Market in Chemical Industry Analysis, Insights and Forecast, 2019-2031
                                  • 8.1. Market Analysis, Insights and Forecast - by Production Analysis
                                    • 8.2. Market Analysis, Insights and Forecast - by Consumption Analysis
                                      • 8.3. Market Analysis, Insights and Forecast - by Import Market Analysis (Value & Volume)
                                        • 8.4. Market Analysis, Insights and Forecast - by Export Market Analysis (Value & Volume)
                                          • 8.5. Market Analysis, Insights and Forecast - by Price Trend Analysis
                                          • 9. Latin America Global Valves Market in Chemical Industry Analysis, Insights and Forecast, 2019-2031
                                            • 9.1. Market Analysis, Insights and Forecast - by Production Analysis
                                              • 9.2. Market Analysis, Insights and Forecast - by Consumption Analysis
                                                • 9.3. Market Analysis, Insights and Forecast - by Import Market Analysis (Value & Volume)
                                                  • 9.4. Market Analysis, Insights and Forecast - by Export Market Analysis (Value & Volume)
                                                    • 9.5. Market Analysis, Insights and Forecast - by Price Trend Analysis
                                                    • 10. Middle East and Africa Global Valves Market in Chemical Industry Analysis, Insights and Forecast, 2019-2031
                                                      • 10.1. Market Analysis, Insights and Forecast - by Production Analysis
                                                        • 10.2. Market Analysis, Insights and Forecast - by Consumption Analysis
                                                          • 10.3. Market Analysis, Insights and Forecast - by Import Market Analysis (Value & Volume)
                                                            • 10.4. Market Analysis, Insights and Forecast - by Export Market Analysis (Value & Volume)
                                                              • 10.5. Market Analysis, Insights and Forecast - by Price Trend Analysis
                                                              • 11. North America Global Valves Market in Chemical Industry Analysis, Insights and Forecast, 2019-2031
                                                                  • 11.1. Market Analysis, Insights and Forecast - By Country/Sub-region
                                                                    • 11.1.1.
                                                              • 12. Europe Global Valves Market in Chemical Industry Analysis, Insights and Forecast, 2019-2031
                                                                  • 12.1. Market Analysis, Insights and Forecast - By Country/Sub-region
                                                                    • 12.1.1.
                                                              • 13. Asia Pacific Global Valves Market in Chemical Industry Analysis, Insights and Forecast, 2019-2031
                                                                  • 13.1. Market Analysis, Insights and Forecast - By Country/Sub-region
                                                                    • 13.1.1.
                                                              • 14. Latin America Global Valves Market in Chemical Industry Analysis, Insights and Forecast, 2019-2031
                                                                  • 14.1. Market Analysis, Insights and Forecast - By Country/Sub-region
                                                                    • 14.1.1.
                                                              • 15. Middle East and Africa Global Valves Market in Chemical Industry Analysis, Insights and Forecast, 2019-2031
                                                                  • 15.1. Market Analysis, Insights and Forecast - By Country/Sub-region
                                                                    • 15.1.1.
                                                              • 16. Competitive Analysis
                                                                • 16.1. Market Share Analysis 2024
                                                                  • 16.2. Company Profiles
                                                                    • 16.2.1 Valmet Oyj
                                                                      • 16.2.1.1. Overview
                                                                      • 16.2.1.2. Products
                                                                      • 16.2.1.3. SWOT Analysis
                                                                      • 16.2.1.4. Recent Developments
                                                                      • 16.2.1.5. Financials (Based on Availability)
                                                                    • 16.2.2 Rotork Plc
                                                                      • 16.2.2.1. Overview
                                                                      • 16.2.2.2. Products
                                                                      • 16.2.2.3. SWOT Analysis
                                                                      • 16.2.2.4. Recent Developments
                                                                      • 16.2.2.5. Financials (Based on Availability)
                                                                    • 16.2.3 Flowserve Corporation
                                                                      • 16.2.3.1. Overview
                                                                      • 16.2.3.2. Products
                                                                      • 16.2.3.3. SWOT Analysis
                                                                      • 16.2.3.4. Recent Developments
                                                                      • 16.2.3.5. Financials (Based on Availability)
                                                                    • 16.2.4 Crane Holdings Co
                                                                      • 16.2.4.1. Overview
                                                                      • 16.2.4.2. Products
                                                                      • 16.2.4.3. SWOT Analysis
                                                                      • 16.2.4.4. Recent Developments
                                                                      • 16.2.4.5. Financials (Based on Availability)
                                                                    • 16.2.5 Alfa Laval Corporate AB
                                                                      • 16.2.5.1. Overview
                                                                      • 16.2.5.2. Products
                                                                      • 16.2.5.3. SWOT Analysis
                                                                      • 16.2.5.4. Recent Developments
                                                                      • 16.2.5.5. Financials (Based on Availability)
                                                                    • 16.2.6 Emerson Electric Co
                                                                      • 16.2.6.1. Overview
                                                                      • 16.2.6.2. Products
                                                                      • 16.2.6.3. SWOT Analysis
                                                                      • 16.2.6.4. Recent Developments
                                                                      • 16.2.6.5. Financials (Based on Availability)
                                                                    • 16.2.7 Samson Controls Inc
                                                                      • 16.2.7.1. Overview
                                                                      • 16.2.7.2. Products
                                                                      • 16.2.7.3. SWOT Analysis
                                                                      • 16.2.7.4. Recent Developments
                                                                      • 16.2.7.5. Financials (Based on Availability)
                                                                    • 16.2.8 IMI Critical Engineering
                                                                      • 16.2.8.1. Overview
                                                                      • 16.2.8.2. Products
                                                                      • 16.2.8.3. SWOT Analysis
                                                                      • 16.2.8.4. Recent Developments
                                                                      • 16.2.8.5. Financials (Based on Availability)
                                                                    • 16.2.9 Schlumberger Limited
                                                                      • 16.2.9.1. Overview
                                                                      • 16.2.9.2. Products
                                                                      • 16.2.9.3. SWOT Analysis
                                                                      • 16.2.9.4. Recent Developments
                                                                      • 16.2.9.5. Financials (Based on Availability)
                                                                    • 16.2.10 KITZ Corporation
                                                                      • 16.2.10.1. Overview
                                                                      • 16.2.10.2. Products
                                                                      • 16.2.10.3. SWOT Analysis
                                                                      • 16.2.10.4. Recent Developments
                                                                      • 16.2.10.5. Financials (Based on Availability)

                                                              List of Figures

                                                              1. Figure 1: Global Global Valves Market in Chemical Industry Revenue Breakdown (Million, %) by Region 2024 & 2032
                                                              2. Figure 2: North America Global Valves Market in Chemical Industry Revenue (Million), by Country 2024 & 2032
                                                              3. Figure 3: North America Global Valves Market in Chemical Industry Revenue Share (%), by Country 2024 & 2032
                                                              4. Figure 4: Europe Global Valves Market in Chemical Industry Revenue (Million), by Country 2024 & 2032
                                                              5. Figure 5: Europe Global Valves Market in Chemical Industry Revenue Share (%), by Country 2024 & 2032
                                                              6. Figure 6: Asia Pacific Global Valves Market in Chemical Industry Revenue (Million), by Country 2024 & 2032
                                                              7. Figure 7: Asia Pacific Global Valves Market in Chemical Industry Revenue Share (%), by Country 2024 & 2032
                                                              8. Figure 8: Latin America Global Valves Market in Chemical Industry Revenue (Million), by Country 2024 & 2032
                                                              9. Figure 9: Latin America Global Valves Market in Chemical Industry Revenue Share (%), by Country 2024 & 2032
                                                              10. Figure 10: Middle East and Africa Global Valves Market in Chemical Industry Revenue (Million), by Country 2024 & 2032
                                                              11. Figure 11: Middle East and Africa Global Valves Market in Chemical Industry Revenue Share (%), by Country 2024 & 2032
                                                              12. Figure 12: North America Global Valves Market in Chemical Industry Revenue (Million), by Production Analysis 2024 & 2032
                                                              13. Figure 13: North America Global Valves Market in Chemical Industry Revenue Share (%), by Production Analysis 2024 & 2032
                                                              14. Figure 14: North America Global Valves Market in Chemical Industry Revenue (Million), by Consumption Analysis 2024 & 2032
                                                              15. Figure 15: North America Global Valves Market in Chemical Industry Revenue Share (%), by Consumption Analysis 2024 & 2032
                                                              16. Figure 16: North America Global Valves Market in Chemical Industry Revenue (Million), by Import Market Analysis (Value & Volume) 2024 & 2032
                                                              17. Figure 17: North America Global Valves Market in Chemical Industry Revenue Share (%), by Import Market Analysis (Value & Volume) 2024 & 2032
                                                              18. Figure 18: North America Global Valves Market in Chemical Industry Revenue (Million), by Export Market Analysis (Value & Volume) 2024 & 2032
                                                              19. Figure 19: North America Global Valves Market in Chemical Industry Revenue Share (%), by Export Market Analysis (Value & Volume) 2024 & 2032
                                                              20. Figure 20: North America Global Valves Market in Chemical Industry Revenue (Million), by Price Trend Analysis 2024 & 2032
                                                              21. Figure 21: North America Global Valves Market in Chemical Industry Revenue Share (%), by Price Trend Analysis 2024 & 2032
                                                              22. Figure 22: North America Global Valves Market in Chemical Industry Revenue (Million), by Country 2024 & 2032
                                                              23. Figure 23: North America Global Valves Market in Chemical Industry Revenue Share (%), by Country 2024 & 2032
                                                              24. Figure 24: Europe Global Valves Market in Chemical Industry Revenue (Million), by Production Analysis 2024 & 2032
                                                              25. Figure 25: Europe Global Valves Market in Chemical Industry Revenue Share (%), by Production Analysis 2024 & 2032
                                                              26. Figure 26: Europe Global Valves Market in Chemical Industry Revenue (Million), by Consumption Analysis 2024 & 2032
                                                              27. Figure 27: Europe Global Valves Market in Chemical Industry Revenue Share (%), by Consumption Analysis 2024 & 2032
                                                              28. Figure 28: Europe Global Valves Market in Chemical Industry Revenue (Million), by Import Market Analysis (Value & Volume) 2024 & 2032
                                                              29. Figure 29: Europe Global Valves Market in Chemical Industry Revenue Share (%), by Import Market Analysis (Value & Volume) 2024 & 2032
                                                              30. Figure 30: Europe Global Valves Market in Chemical Industry Revenue (Million), by Export Market Analysis (Value & Volume) 2024 & 2032
                                                              31. Figure 31: Europe Global Valves Market in Chemical Industry Revenue Share (%), by Export Market Analysis (Value & Volume) 2024 & 2032
                                                              32. Figure 32: Europe Global Valves Market in Chemical Industry Revenue (Million), by Price Trend Analysis 2024 & 2032
                                                              33. Figure 33: Europe Global Valves Market in Chemical Industry Revenue Share (%), by Price Trend Analysis 2024 & 2032
                                                              34. Figure 34: Europe Global Valves Market in Chemical Industry Revenue (Million), by Country 2024 & 2032
                                                              35. Figure 35: Europe Global Valves Market in Chemical Industry Revenue Share (%), by Country 2024 & 2032
                                                              36. Figure 36: Asia Pacific Global Valves Market in Chemical Industry Revenue (Million), by Production Analysis 2024 & 2032
                                                              37. Figure 37: Asia Pacific Global Valves Market in Chemical Industry Revenue Share (%), by Production Analysis 2024 & 2032
                                                              38. Figure 38: Asia Pacific Global Valves Market in Chemical Industry Revenue (Million), by Consumption Analysis 2024 & 2032
                                                              39. Figure 39: Asia Pacific Global Valves Market in Chemical Industry Revenue Share (%), by Consumption Analysis 2024 & 2032
                                                              40. Figure 40: Asia Pacific Global Valves Market in Chemical Industry Revenue (Million), by Import Market Analysis (Value & Volume) 2024 & 2032
                                                              41. Figure 41: Asia Pacific Global Valves Market in Chemical Industry Revenue Share (%), by Import Market Analysis (Value & Volume) 2024 & 2032
                                                              42. Figure 42: Asia Pacific Global Valves Market in Chemical Industry Revenue (Million), by Export Market Analysis (Value & Volume) 2024 & 2032
                                                              43. Figure 43: Asia Pacific Global Valves Market in Chemical Industry Revenue Share (%), by Export Market Analysis (Value & Volume) 2024 & 2032
                                                              44. Figure 44: Asia Pacific Global Valves Market in Chemical Industry Revenue (Million), by Price Trend Analysis 2024 & 2032
                                                              45. Figure 45: Asia Pacific Global Valves Market in Chemical Industry Revenue Share (%), by Price Trend Analysis 2024 & 2032
                                                              46. Figure 46: Asia Pacific Global Valves Market in Chemical Industry Revenue (Million), by Country 2024 & 2032
                                                              47. Figure 47: Asia Pacific Global Valves Market in Chemical Industry Revenue Share (%), by Country 2024 & 2032
                                                              48. Figure 48: Latin America Global Valves Market in Chemical Industry Revenue (Million), by Production Analysis 2024 & 2032
                                                              49. Figure 49: Latin America Global Valves Market in Chemical Industry Revenue Share (%), by Production Analysis 2024 & 2032
                                                              50. Figure 50: Latin America Global Valves Market in Chemical Industry Revenue (Million), by Consumption Analysis 2024 & 2032
                                                              51. Figure 51: Latin America Global Valves Market in Chemical Industry Revenue Share (%), by Consumption Analysis 2024 & 2032
                                                              52. Figure 52: Latin America Global Valves Market in Chemical Industry Revenue (Million), by Import Market Analysis (Value & Volume) 2024 & 2032
                                                              53. Figure 53: Latin America Global Valves Market in Chemical Industry Revenue Share (%), by Import Market Analysis (Value & Volume) 2024 & 2032
                                                              54. Figure 54: Latin America Global Valves Market in Chemical Industry Revenue (Million), by Export Market Analysis (Value & Volume) 2024 & 2032
                                                              55. Figure 55: Latin America Global Valves Market in Chemical Industry Revenue Share (%), by Export Market Analysis (Value & Volume) 2024 & 2032
                                                              56. Figure 56: Latin America Global Valves Market in Chemical Industry Revenue (Million), by Price Trend Analysis 2024 & 2032
                                                              57. Figure 57: Latin America Global Valves Market in Chemical Industry Revenue Share (%), by Price Trend Analysis 2024 & 2032
                                                              58. Figure 58: Latin America Global Valves Market in Chemical Industry Revenue (Million), by Country 2024 & 2032
                                                              59. Figure 59: Latin America Global Valves Market in Chemical Industry Revenue Share (%), by Country 2024 & 2032
                                                              60. Figure 60: Middle East and Africa Global Valves Market in Chemical Industry Revenue (Million), by Production Analysis 2024 & 2032
                                                              61. Figure 61: Middle East and Africa Global Valves Market in Chemical Industry Revenue Share (%), by Production Analysis 2024 & 2032
                                                              62. Figure 62: Middle East and Africa Global Valves Market in Chemical Industry Revenue (Million), by Consumption Analysis 2024 & 2032
                                                              63. Figure 63: Middle East and Africa Global Valves Market in Chemical Industry Revenue Share (%), by Consumption Analysis 2024 & 2032
                                                              64. Figure 64: Middle East and Africa Global Valves Market in Chemical Industry Revenue (Million), by Import Market Analysis (Value & Volume) 2024 & 2032
                                                              65. Figure 65: Middle East and Africa Global Valves Market in Chemical Industry Revenue Share (%), by Import Market Analysis (Value & Volume) 2024 & 2032
                                                              66. Figure 66: Middle East and Africa Global Valves Market in Chemical Industry Revenue (Million), by Export Market Analysis (Value & Volume) 2024 & 2032
                                                              67. Figure 67: Middle East and Africa Global Valves Market in Chemical Industry Revenue Share (%), by Export Market Analysis (Value & Volume) 2024 & 2032
                                                              68. Figure 68: Middle East and Africa Global Valves Market in Chemical Industry Revenue (Million), by Price Trend Analysis 2024 & 2032
                                                              69. Figure 69: Middle East and Africa Global Valves Market in Chemical Industry Revenue Share (%), by Price Trend Analysis 2024 & 2032
                                                              70. Figure 70: Middle East and Africa Global Valves Market in Chemical Industry Revenue (Million), by Country 2024 & 2032
                                                              71. Figure 71: Middle East and Africa Global Valves Market in Chemical Industry Revenue Share (%), by Country 2024 & 2032

                                                              List of Tables

                                                              1. Table 1: Global Valves Market in Chemical Industry Revenue Million Forecast, by Region 2019 & 2032
                                                              2. Table 2: Global Valves Market in Chemical Industry Revenue Million Forecast, by Production Analysis 2019 & 2032
                                                              3. Table 3: Global Valves Market in Chemical Industry Revenue Million Forecast, by Consumption Analysis 2019 & 2032
                                                              4. Table 4: Global Valves Market in Chemical Industry Revenue Million Forecast, by Import Market Analysis (Value & Volume) 2019 & 2032
                                                              5. Table 5: Global Valves Market in Chemical Industry Revenue Million Forecast, by Export Market Analysis (Value & Volume) 2019 & 2032
                                                              6. Table 6: Global Valves Market in Chemical Industry Revenue Million Forecast, by Price Trend Analysis 2019 & 2032
                                                              7. Table 7: Global Valves Market in Chemical Industry Revenue Million Forecast, by Region 2019 & 2032
                                                              8. Table 8: Global Valves Market in Chemical Industry Revenue Million Forecast, by Country 2019 & 2032
                                                              9. Table 9: Global Valves Market in Chemical Industry Revenue (Million) Forecast, by Application 2019 & 2032
                                                              10. Table 10: Global Valves Market in Chemical Industry Revenue Million Forecast, by Country 2019 & 2032
                                                              11. Table 11: Global Valves Market in Chemical Industry Revenue (Million) Forecast, by Application 2019 & 2032
                                                              12. Table 12: Global Valves Market in Chemical Industry Revenue Million Forecast, by Country 2019 & 2032
                                                              13. Table 13: Global Valves Market in Chemical Industry Revenue (Million) Forecast, by Application 2019 & 2032
                                                              14. Table 14: Global Valves Market in Chemical Industry Revenue Million Forecast, by Country 2019 & 2032
                                                              15. Table 15: Global Valves Market in Chemical Industry Revenue (Million) Forecast, by Application 2019 & 2032
                                                              16. Table 16: Global Valves Market in Chemical Industry Revenue Million Forecast, by Country 2019 & 2032
                                                              17. Table 17: Global Valves Market in Chemical Industry Revenue (Million) Forecast, by Application 2019 & 2032
                                                              18. Table 18: Global Valves Market in Chemical Industry Revenue Million Forecast, by Production Analysis 2019 & 2032
                                                              19. Table 19: Global Valves Market in Chemical Industry Revenue Million Forecast, by Consumption Analysis 2019 & 2032
                                                              20. Table 20: Global Valves Market in Chemical Industry Revenue Million Forecast, by Import Market Analysis (Value & Volume) 2019 & 2032
                                                              21. Table 21: Global Valves Market in Chemical Industry Revenue Million Forecast, by Export Market Analysis (Value & Volume) 2019 & 2032
                                                              22. Table 22: Global Valves Market in Chemical Industry Revenue Million Forecast, by Price Trend Analysis 2019 & 2032
                                                              23. Table 23: Global Valves Market in Chemical Industry Revenue Million Forecast, by Country 2019 & 2032
                                                              24. Table 24: Global Valves Market in Chemical Industry Revenue Million Forecast, by Production Analysis 2019 & 2032
                                                              25. Table 25: Global Valves Market in Chemical Industry Revenue Million Forecast, by Consumption Analysis 2019 & 2032
                                                              26. Table 26: Global Valves Market in Chemical Industry Revenue Million Forecast, by Import Market Analysis (Value & Volume) 2019 & 2032
                                                              27. Table 27: Global Valves Market in Chemical Industry Revenue Million Forecast, by Export Market Analysis (Value & Volume) 2019 & 2032
                                                              28. Table 28: Global Valves Market in Chemical Industry Revenue Million Forecast, by Price Trend Analysis 2019 & 2032
                                                              29. Table 29: Global Valves Market in Chemical Industry Revenue Million Forecast, by Country 2019 & 2032
                                                              30. Table 30: Global Valves Market in Chemical Industry Revenue Million Forecast, by Production Analysis 2019 & 2032
                                                              31. Table 31: Global Valves Market in Chemical Industry Revenue Million Forecast, by Consumption Analysis 2019 & 2032
                                                              32. Table 32: Global Valves Market in Chemical Industry Revenue Million Forecast, by Import Market Analysis (Value & Volume) 2019 & 2032
                                                              33. Table 33: Global Valves Market in Chemical Industry Revenue Million Forecast, by Export Market Analysis (Value & Volume) 2019 & 2032
                                                              34. Table 34: Global Valves Market in Chemical Industry Revenue Million Forecast, by Price Trend Analysis 2019 & 2032
                                                              35. Table 35: Global Valves Market in Chemical Industry Revenue Million Forecast, by Country 2019 & 2032
                                                              36. Table 36: Global Valves Market in Chemical Industry Revenue Million Forecast, by Production Analysis 2019 & 2032
                                                              37. Table 37: Global Valves Market in Chemical Industry Revenue Million Forecast, by Consumption Analysis 2019 & 2032
                                                              38. Table 38: Global Valves Market in Chemical Industry Revenue Million Forecast, by Import Market Analysis (Value & Volume) 2019 & 2032
                                                              39. Table 39: Global Valves Market in Chemical Industry Revenue Million Forecast, by Export Market Analysis (Value & Volume) 2019 & 2032
                                                              40. Table 40: Global Valves Market in Chemical Industry Revenue Million Forecast, by Price Trend Analysis 2019 & 2032
                                                              41. Table 41: Global Valves Market in Chemical Industry Revenue Million Forecast, by Country 2019 & 2032
                                                              42. Table 42: Global Valves Market in Chemical Industry Revenue Million Forecast, by Production Analysis 2019 & 2032
                                                              43. Table 43: Global Valves Market in Chemical Industry Revenue Million Forecast, by Consumption Analysis 2019 & 2032
                                                              44. Table 44: Global Valves Market in Chemical Industry Revenue Million Forecast, by Import Market Analysis (Value & Volume) 2019 & 2032
                                                              45. Table 45: Global Valves Market in Chemical Industry Revenue Million Forecast, by Export Market Analysis (Value & Volume) 2019 & 2032
                                                              46. Table 46: Global Valves Market in Chemical Industry Revenue Million Forecast, by Price Trend Analysis 2019 & 2032
                                                              47. Table 47: Global Valves Market in Chemical Industry Revenue Million Forecast, by Country 2019 & 2032


                                                              Frequently Asked Questions

                                                              1. What is the projected Compound Annual Growth Rate (CAGR) of the Global Valves Market in Chemical Industry?

                                                              The projected CAGR is approximately 4.20%.

                                                              2. Which companies are prominent players in the Global Valves Market in Chemical Industry?

                                                              Key companies in the market include Valmet Oyj, Rotork Plc, Flowserve Corporation, Crane Holdings Co, Alfa Laval Corporate AB, Emerson Electric Co, Samson Controls Inc, IMI Critical Engineering, Schlumberger Limited, KITZ Corporation.

                                                              3. What are the main segments of the Global Valves Market in Chemical Industry?

                                                              The market segments include Production Analysis, Consumption Analysis, Import Market Analysis (Value & Volume), Export Market Analysis (Value & Volume), Price Trend Analysis.

                                                              4. Can you provide details about the market size?

                                                              The market size is estimated to be USD XX Million as of 2022.

                                                              5. What are some drivers contributing to market growth?

                                                              Growing Demand for Process Safety; Growing Adoption of Process Automation.

                                                              6. What are the notable trends driving market growth?

                                                              Growing Expansion of Specialty Chemical Manufacturing Companies Owing to Increasing Demand.

                                                              7. Are there any restraints impacting market growth?

                                                              Lack of Standardized Policies and High Replacement Costs.

                                                              8. Can you provide examples of recent developments in the market?

                                                              May 2021- Hitachi launched its Class150 Flanged double offset ball valve for fluid handling including solids, such as wastewater, slurry, powders, ashes, etc. The company has supplied the JIS10K and 20K type valves with successful installation in many wastewaters treatment and chemical plants. The Class 150 valve's double offset structure provides a no pocket design, resulting in no stagnated flow and light torque movements to achieve stable valve operation.

                                                              9. What pricing options are available for accessing the report?

                                                              Pricing options include single-user, multi-user, and enterprise licenses priced at USD 4750, USD 5250, and USD 8750 respectively.

                                                              10. Is the market size provided in terms of value or volume?

                                                              The market size is provided in terms of value, measured in Million.

                                                              11. Are there any specific market keywords associated with the report?

                                                              Yes, the market keyword associated with the report is "Global Valves Market in Chemical Industry," which aids in identifying and referencing the specific market segment covered.

                                                              12. How do I determine which pricing option suits my needs best?

                                                              The pricing options vary based on user requirements and access needs. Individual users may opt for single-user licenses, while businesses requiring broader access may choose multi-user or enterprise licenses for cost-effective access to the report.

                                                              13. Are there any additional resources or data provided in the Global Valves Market in Chemical Industry report?

                                                              While the report offers comprehensive insights, it's advisable to review the specific contents or supplementary materials provided to ascertain if additional resources or data are available.

                                                              14. How can I stay updated on further developments or reports in the Global Valves Market in Chemical Industry?

                                                              To stay informed about further developments, trends, and reports in the Global Valves Market in Chemical Industry, consider subscribing to industry newsletters, following relevant companies and organizations, or regularly checking reputable industry news sources and publications.


                                                              Methodology

                                                              Step 1 - Identification of Relevant Samples Size from Population Database

                                                              Step Chart
                                                              Bar Chart
                                                              Method Chart

                                                              Step 2 - Approaches for Defining Global Market Size (Value, Volume* & Price*)

                                                              Approach Chart
                                                              Top-down and bottom-up approaches are used to validate the global market size and estimate the market size for manufactures, regional segments, product, and application.

                                                              Note*: In applicable scenarios

                                                              Step 3 - Data Sources

                                                              Primary Research

                                                              • Web Analytics
                                                              • Survey Reports
                                                              • Research Institute
                                                              • Latest Research Reports
                                                              • Opinion Leaders

                                                              Secondary Research

                                                              • Annual Reports
                                                              • White Paper
                                                              • Latest Press Release
                                                              • Industry Association
                                                              • Paid Database
                                                              • Investor Presentations
                                                              Analyst Chart

                                                              Step 4 - Data Triangulation

                                                              Involves using different sources of information in order to increase the validity of a study

                                                              These sources are likely to be stakeholders in a program - participants, other researchers, program staff, other community members, and so on.

                                                              Then we put all data in single framework & apply various statistical tools to find out the dynamic on the market.

                                                              During the analysis stage, feedback from the stakeholder groups would be compared to determine areas of agreement as well as areas of divergence

                                                              Additionally, after gathering mixed and scattered data from a wide range of sources, data is triangulated and correlated to come up with estimated figures which are further validated through primary mediums or industry experts, opinion leaders.

                                                              About Research Axiom

                                                              Research Axiom delivers in-depth market research, industry analysis, and consulting for pharmaceuticals, automotive, IT, and consumer goods. Our reports provide the clarity you need to make informed decisions and drive innovation.

                                                              Our team combines primary research, advanced analytics, and sector expertise to deliver actionable intelligence. We offer syndicated reports, custom research, and consulting services tailored to your business needs.

                                                              At Research Axiom, we are committed to quality, transparency, and client satisfaction. Every report is rigorously validated to ensure accuracy and relevance. Our global perspective and local expertise help you understand both the big picture and the finer details of your market.

                                                              Stay informed with Research Axiom. Subscribe to our newsletter for the latest updates and research highlights, and follow us on social media for real-time insights. Research Axiom – Turning Data into Business Advantage.

                                                              artwork spiralartwork spiralRelated Reports
                                                              artwork underline

                                                              MEA Telecom Market In Middle East and Africa Market Expansion: Growth Outlook 2025-2033

                                                              The MEA Telecom Market is booming, projected to reach $XX million by 2033 with a 5.28% CAGR. Discover key drivers, trends, and restraints shaping this dynamic sector, including mobile, fixed line, and broadband segments across Africa and the Middle East. Analyze market leaders like Mobily, STC, and Ooredoo.

                                                              July 2025
                                                              Base Year: 2024
                                                              No Of Pages: 234
                                                              Price: $4750

                                                              Used Smartphone Market Market Disruption Trends and Insights

                                                              Discover the booming used smartphone market! Explore key trends, growth drivers (sustainability, affordability), regional insights, and top players in this $XX million (2025) industry projected to grow at a 7.61% CAGR until 2033. Learn how certified pre-owned phones are shaping the future of mobile.

                                                              July 2025
                                                              Base Year: 2024
                                                              No Of Pages: 234
                                                              Price: $4750

                                                              Decoding Argentina Telecoms Market Consumer Preferences 2025-2033

                                                              Discover the booming Argentina Telecoms market! This in-depth analysis reveals a CAGR of 8.5%, driven by surging data consumption and 5G rollout. Explore market size, segmentation, key players (Movistar, Telecom Argentina), and future trends impacting this dynamic sector.

                                                              July 2025
                                                              Base Year: 2024
                                                              No Of Pages: 197
                                                              Price: $3800

                                                              Strategic Insights for Datafication Market Market Expansion

                                                              Discover the booming datafication market! Our in-depth analysis reveals a CAGR of 12.42%, driven by AI, blockchain, and edge computing. Explore market segmentation, key players (SAS, IBM, Matillion), and regional trends to capitalize on this explosive growth opportunity. Learn more about datafication solutions and their impact across industries.

                                                              July 2025
                                                              Base Year: 2024
                                                              No Of Pages: 234
                                                              Price: $4750

                                                              United Kingdom Public Relation Services Market: Disruptive Technologies Driving Market Growth 2025-2033

                                                              The UK Public Relations Services market is booming, with a projected £5.87 billion valuation in 2025 and a 6.67% CAGR through 2033. Discover key drivers, trends, and leading companies shaping this dynamic sector. Explore market segmentation and regional breakdowns for insightful analysis.

                                                              July 2025
                                                              Base Year: 2024
                                                              No Of Pages: 197
                                                              Price: $3800

                                                              Medical Devices MLCC Market Market Report: Strategic Insights

                                                              The Medical Devices MLCC Market is booming, with a projected CAGR of 5.91% from 2025-2033. This report analyzes market size, trends, drivers, restraints, and key players like Vishay & Murata, covering segments by voltage, capacitance, and dielectric type. Discover growth opportunities in this vital sector.

                                                              July 2025
                                                              Base Year: 2024
                                                              No Of Pages: 197
                                                              Price: $3800

                                                              Exploring Consumer Shifts in Wireless Microphone System Market Market 2025-2033

                                                              The booming wireless microphone system market is projected to reach \$XX million by 2033, growing at a CAGR of 7.21%. This in-depth analysis explores market drivers, trends, restraints, and regional breakdowns, highlighting key players like Shure and Sennheiser. Discover insights into wireless microphone types, communication methods, and end-user verticals.

                                                              July 2025
                                                              Base Year: 2024
                                                              No Of Pages: 234
                                                              Price: $4750

                                                              Deep Dive into Near Field Communication Market: Comprehensive Growth Analysis 2025-2033

                                                              The booming Near Field Communication (NFC) market is projected to reach \$50 billion by 2033, with a 17% CAGR. Driven by contactless payments, IoT growth, and expanding applications across diverse sectors, this comprehensive market analysis explores key trends, drivers, and major players shaping the future of NFC technology.

                                                              July 2025
                                                              Base Year: 2024
                                                              No Of Pages: 234
                                                              Price: $4750

                                                              Regional Analysis of Philippines Telecom Market Growth Trajectories

                                                              The Philippines telecom market is booming, projected to reach \$7.27 billion by 2033, driven by rising smartphone usage and data consumption. This in-depth analysis reveals key trends, market segments (voice, data, OTT), and leading players like Globe, Smart, and DITO. Discover growth opportunities and challenges in this dynamic sector.

                                                              July 2025
                                                              Base Year: 2024
                                                              No Of Pages: 197
                                                              Price: $3800

                                                              Ad Tech Market Market Drivers and Challenges: Trends 2025-2033

                                                              Discover the explosive growth of the Ad Tech market, projected to reach [estimated 2033 value] by 2033 with a CAGR of 11.54%. This comprehensive analysis explores key drivers, trends, and restraints impacting SSPs, DSPs, ad exchanges, and more. Learn about leading companies and regional market share.

                                                              July 2025
                                                              Base Year: 2024
                                                              No Of Pages: 234
                                                              Price: $4750

                                                              Exploring Consumer Shifts in High Performance Data Analytics Industry Market 2025-2033

                                                              The High-Performance Data Analytics market is booming, projected to reach \$97.19M in 2025 with a 23.63% CAGR. Discover key trends, drivers, and regional insights in this comprehensive market analysis, including leading companies like AWS, SAS, and Microsoft. Learn about lucrative opportunities in BFSI, Government, and other sectors.

                                                              July 2025
                                                              Base Year: 2024
                                                              No Of Pages: 234
                                                              Price: $4750

                                                              Peru Telecom Market Competitive Strategies: Trends and Forecasts 2025-2033

                                                              Discover the booming Peruvian Telecom Market! This in-depth analysis reveals a CAGR of 3.12%, key players like AT&T and Telefónica, and projected growth to 2033. Explore market trends, segments, and challenges in this dynamic sector.

                                                              July 2025
                                                              Base Year: 2024
                                                              No Of Pages: 197
                                                              Price: $3800

                                                              Trade Management Software Market Market Analysis and Forecasts

                                                              The global Trade Management Software market is booming, projected to reach $3 billion by 2033 with a 9.90% CAGR. Learn about key drivers, trends, restraints, and leading companies shaping this dynamic sector. Discover market size, segmentation, and regional analysis.

                                                              July 2025
                                                              Base Year: 2024
                                                              No Of Pages: 234
                                                              Price: $4750

                                                              Decoding Middle East and Africa Soft Facility Management Market Consumer Preferences 2025-2033

                                                              Discover the booming Middle East & Africa Soft Facility Management market! Explore its $XX million valuation, 7.70% CAGR growth, key drivers, trends, and leading companies like EFS Facilities Services Group and Farnek Services LLC. This comprehensive analysis covers key segments and regional breakdowns for 2025-2033.

                                                              July 2025
                                                              Base Year: 2024
                                                              No Of Pages: 210
                                                              Price: $4750

                                                              Strategizing Growth: Industrial AI Software Market Market’s Decade Ahead 2025-2033

                                                              The Industrial AI Software market is booming, projected to reach $114.68 million in 2025 with a 35.97% CAGR. Discover key trends, drivers, and regional insights for this rapidly expanding sector, including leading companies like Nvidia, IBM, and Microsoft. Explore market segmentation by end-user industry and deployment type.

                                                              July 2025
                                                              Base Year: 2024
                                                              No Of Pages: 234
                                                              Price: $4750

                                                              Market Deep Dive: Exploring Simulation Software Industry Trends 2025-2033

                                                              The simulation software market is booming, projected to reach $30 billion by 2033 with a 12.06% CAGR. This in-depth analysis explores key drivers, trends, and regional market shares, highlighting leading companies and the transformative impact of cloud-based solutions and AI on product design and development. Discover market insights and growth projections for automotive, aerospace, and other key sectors.

                                                              July 2025
                                                              Base Year: 2024
                                                              No Of Pages: 234
                                                              Price: $4750

                                                              Consumer Technical Support Services Market Market Strategies: Trends and Outlook 2025-2033

                                                              The global Consumer Technical Support Services market is booming, projected to reach [estimated market size in 2033] by 2033 with a CAGR of 7.30%. Learn about key drivers, trends, restraints, and major players shaping this rapidly growing sector. Explore regional market shares and future growth potential.

                                                              July 2025
                                                              Base Year: 2024
                                                              No Of Pages: 234
                                                              Price: $4750

                                                              Emerging Trends in North America Speech Analytics Market: A Technology Perspective 2025-2033

                                                              The North America Speech Analytics Market is booming, projected to reach [estimated 2033 value] million by 2033, with a CAGR of 13.20%. Discover key drivers, trends, and challenges impacting this rapidly growing sector, along with leading vendors and market segmentation analysis.

                                                              July 2025
                                                              Base Year: 2024
                                                              No Of Pages: 210
                                                              Price: $4750

                                                              Comprehensive Review of Rugged Display Industry Growth Potential

                                                              The rugged display market is booming, projected to reach \$14.85B by 2033 with a 4.43% CAGR. This in-depth analysis explores market drivers, trends, restraints, and key players in industries like oil & gas, defense, and automotive. Discover insights into regional market share and key product segments.

                                                              July 2025
                                                              Base Year: 2024
                                                              No Of Pages: 234
                                                              Price: $4750

                                                              Commercial Lighting Market Future-Proofing Growth: Strategic Insights and Analysis 2025-2033

                                                              The commercial lighting market is booming, projected to reach \$69.21 billion by 2033 with a CAGR of 20.93%! Driven by LED adoption and smart lighting solutions, this in-depth analysis explores market size, key trends, leading companies (Signify, Cree, Acuity Brands), and regional growth across North America, Europe, and Asia Pacific. Discover the future of commercial lighting.

                                                              July 2025
                                                              Base Year: 2024
                                                              No Of Pages: 234
                                                              Price: $4750

                                                              Business Address

                                                              Head Office

                                                              Office no. A 5010, fifth floor, Solitaire Business Hub, Near Phoenix mall, Pune, Maharashtra 411014

                                                              Contact Information

                                                              Craig Francis

                                                              Business Development Head

                                                              +17162654855

                                                              [email protected]

                                                              Connect With Us

                                                              Secure Payment Partners

                                                              payment image
                                                              RetailLogisticsPackagingAutomotiveHealthcareAgricultureEnergy & PowerFood & BeverageAerospace & DefenseChemicals & MaterialsHospitality and TourismAnimal Nutrition & WellnessConsumer Goods and ServicesReal Estate and ConstructionHome and Property ImprovementTechnology, Media and TelecomManufacturing Products and ServicesFinancial Services and Investment Intelligence

                                                              © 2025 All rights reserved


                                                              Privacy Policy
                                                              Terms and Conditions
                                                              FAQ
                                                              • Home
                                                              • About Us
                                                              • Industries
                                                                • Aerospace & Defense
                                                                • Agriculture
                                                                • Animal Nutrition & Wellness
                                                                • Automotive
                                                                • Chemicals & Materials
                                                                • Consumer Goods and Services
                                                                • Energy & Power
                                                                • Financial Services and Investment Intelligence
                                                                • Food & Beverage
                                                                • Home and Property Improvement
                                                                • Hospitality and Tourism
                                                                • Logistics
                                                                • Manufacturing Products and Services
                                                                • Packaging
                                                                • Professional and Commercial Services
                                                                • Real Estate and Construction
                                                                • Retail
                                                                • Technology, Media and Telecom
                                                                • Healthcare
                                                              • Services
                                                              • Contact
                                                              Main Logo
                                                              • Home
                                                              • About Us
                                                              • Industries
                                                                • Aerospace & Defense
                                                                • Agriculture
                                                                • Animal Nutrition & Wellness
                                                                • Automotive
                                                                • Chemicals & Materials
                                                                • Consumer Goods and Services
                                                                • Energy & Power
                                                                • Financial Services and Investment Intelligence
                                                                • Food & Beverage
                                                                • Home and Property Improvement
                                                                • Hospitality and Tourism
                                                                • Logistics
                                                                • Manufacturing Products and Services
                                                                • Packaging
                                                                • Professional and Commercial Services
                                                                • Real Estate and Construction
                                                                • Retail
                                                                • Technology, Media and Telecom
                                                                • Healthcare
                                                              • Services
                                                              • Contact
                                                              +17162654855
                                                              [email protected]

                                                              +17162654855

                                                              [email protected]