
Key Insights
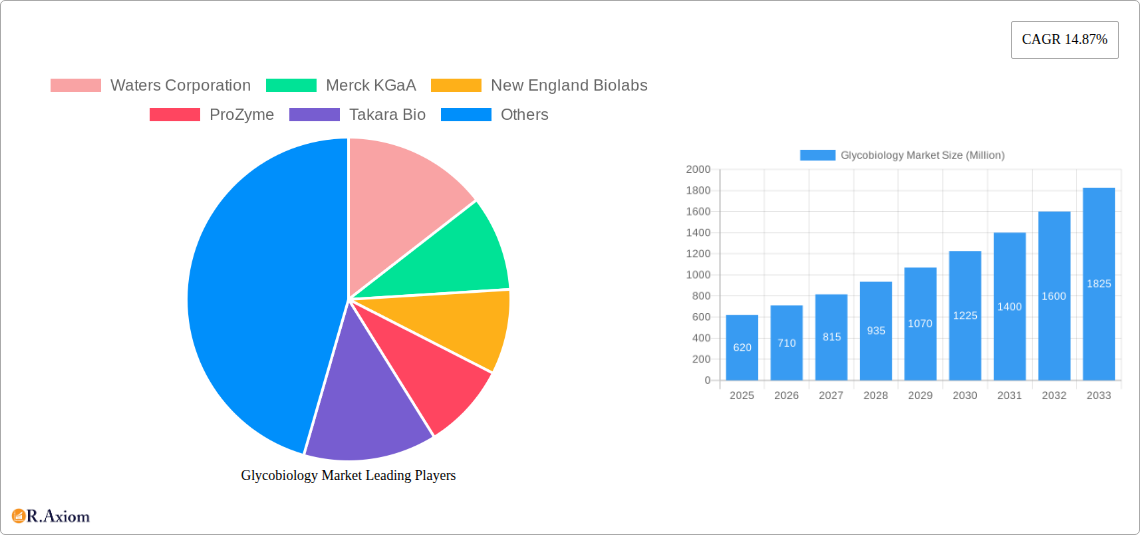
The glycobiology market, valued at $0.62 billion in 2025, is poised for robust growth, exhibiting a Compound Annual Growth Rate (CAGR) of 14.87% from 2025 to 2033. This expansion is fueled by several key factors. The increasing prevalence of chronic diseases like cancer and autoimmune disorders, coupled with advancements in glyco-analytical technologies, is driving demand for glycobiology-related products and services. The development of novel therapeutics targeting glycosylation pathways presents significant opportunities for market growth. Furthermore, the burgeoning field of personalized medicine, which relies on understanding individual glycosylation profiles, is further contributing to market expansion. The pharmaceutical and biotechnology sectors, along with contract research organizations (CROs), represent the primary end-users, driving substantial demand for enzymes, instruments, kits, and reagents. Significant regional growth is anticipated across North America and Europe, driven by robust research infrastructure and substantial investments in drug discovery and development. However, the high cost of advanced glycobiology technologies and the complexity of glycobiology research may present challenges to market penetration.
The market segmentation reveals strong demand across various applications, including diagnostics, drug discovery and development, oncology, and immunology. Within the product segment, enzymes and kits/reagents are expected to witness higher growth due to their widespread use in research and development activities. The competitive landscape is characterized by the presence of established players like Waters Corporation, Merck KGaA, and Thermo Fisher Scientific, along with specialized companies focusing on specific glycobiology tools and services. The market is expected to experience consolidation through strategic partnerships and mergers and acquisitions, further accelerating innovation and market penetration. The continued focus on understanding the role of glycosylation in various biological processes ensures the long-term growth potential of this dynamic market. Future growth will likely be influenced by the ongoing development of more efficient and high-throughput glyco-analytical techniques, coupled with increasing collaborations between academia and industry.
Glycobiology Market: A Comprehensive Report (2019-2033)
This detailed report provides a comprehensive analysis of the Glycobiology Market, offering invaluable insights for stakeholders, investors, and industry professionals. Spanning the period from 2019 to 2033, with a base year of 2025 and a forecast period of 2025-2033, this report meticulously examines market dynamics, competitive landscapes, and future growth potential. The global Glycobiology market is estimated to reach xx Million by 2033, exhibiting a robust CAGR of xx% during the forecast period.
Glycobiology Market Concentration & Innovation
The Glycobiology market is characterized by a moderately concentrated landscape, with key players holding significant market share. Waters Corporation, Merck KGaA, and Thermo Fisher Scientific are among the dominant players, collectively accounting for an estimated xx% of the market in 2025. However, the presence of several smaller, specialized companies indicates a dynamic competitive environment. Innovation is a key driver, fueled by advancements in mass spectrometry, high-throughput screening technologies, and novel glycan analysis techniques. Stringent regulatory frameworks, particularly concerning the approval of new diagnostics and therapeutics, significantly impact market growth. Product substitutes, such as alternative analytical methods, pose a moderate competitive threat. End-user trends, particularly increasing demand from the pharmaceutical and biotechnology sectors, are driving market expansion. The M&A activity in the glycobiology sector has been steadily increasing, with notable deals valuing over xx Million in the last five years. These mergers and acquisitions primarily focus on expanding product portfolios, enhancing technological capabilities, and strengthening market presence.
- Market Concentration: High concentration among leading players.
- Innovation Drivers: Advancements in mass spectrometry, high-throughput screening, and glycan analysis.
- Regulatory Landscape: Stringent regulations impacting drug and diagnostic approvals.
- Product Substitutes: Limited, but alternative analytical methods pose some threat.
- End-User Trends: Increasing demand from pharmaceutical and biotechnology companies.
- M&A Activity: Significant deals driving consolidation, estimated at xx Million in total value over the last five years.
Glycobiology Market Industry Trends & Insights
The Glycobiology market is experiencing robust growth, driven primarily by the increasing prevalence of chronic diseases, particularly cancer and autoimmune disorders. The rising demand for personalized medicine and advancements in glycobiology research are further fueling market expansion. Technological disruptions, such as the introduction of novel mass spectrometry platforms and automated glycan analysis systems, are enhancing efficiency and driving down costs. Consumer preferences are shifting toward more effective and personalized diagnostic tools and therapeutics, creating lucrative opportunities for the industry. The competitive dynamics are characterized by intense innovation, strategic partnerships, and a focus on developing high-value products. The market is projected to witness a Compound Annual Growth Rate (CAGR) of xx% during the forecast period, indicating strong future growth potential and significant market penetration. The global market size is projected to reach xx Million by 2033, demonstrating substantial growth from its xx Million value in 2025.
Dominant Markets & Segments in Glycobiology Market
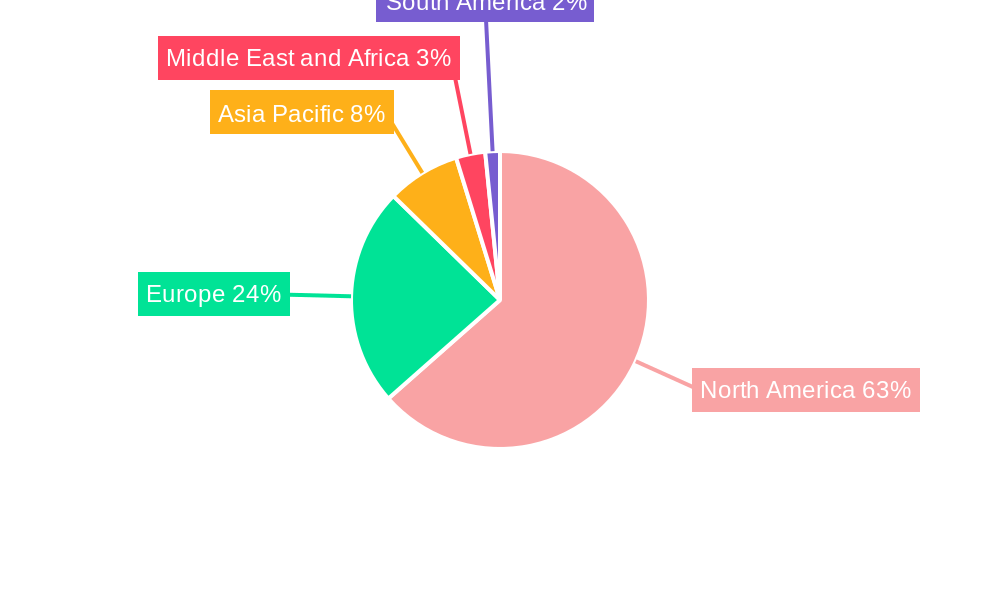
The North American region holds a dominant position in the global Glycobiology market, driven by strong investment in R&D, a high prevalence of chronic diseases, and the presence of major pharmaceutical and biotechnology companies. Within the product segment, Instruments (mass spectrometers, chromatography systems) hold the largest market share due to their crucial role in glycan analysis. In terms of applications, Drug Discovery and Development is the leading segment, accounting for a significant proportion of market revenue due to the increasing focus on developing glycobiology-based therapeutics. Pharmaceutical and Biotechnology Companies represent the largest end-user group, fueled by substantial internal R&D activities and outsourcing initiatives.
Leading Region: North America
- Key Drivers: High R&D investment, high prevalence of chronic diseases, presence of major pharmaceutical companies, favorable regulatory environment.
Dominant Product Segment: Instruments
- Key Drivers: Critical role in glycan analysis, high demand from research institutions and pharmaceutical companies.
Leading Application Segment: Drug Discovery and Development
- Key Drivers: Growing focus on glycobiology-based therapeutics, rising investment in R&D.
Largest End-User Group: Pharmaceutical and Biotechnology Companies
- Key Drivers: High internal R&D activities, significant outsourcing of glycobiology services.
Glycobiology Market Product Developments
Recent product innovations have focused on enhancing the sensitivity, throughput, and automation of glycobiology research tools. This includes the development of advanced mass spectrometry platforms, improved glycan labeling techniques, and automated high-throughput screening assays. These advancements offer significant competitive advantages by enabling faster and more efficient analysis, driving down costs, and expanding the applications of glycobiology research in various fields. The market fit is strong due to increasing demand for higher performance and cost-effective solutions from both academic and industrial sectors.
Report Scope & Segmentation Analysis
This report segments the Glycobiology market across various parameters:
Product: Enzymes, Instruments, Kits and Reagents. The instrument segment is expected to register significant growth during the forecast period owing to the introduction of high-end instruments offering better precision and speed of analysis.
Application: Diagnostics, Drug Discovery and Development, Oncology, Immunology, Other Applications. The drug discovery and development application segment holds the largest market share owing to the growing demand for glycobiology-based drugs.
End User: Pharmaceutical and Biotechnology Companies, Contract Research Organizations, Other End Users. Pharmaceutical and Biotechnology Companies will continue to dominate the market owing to the significant investment they make in R&D. Growth projections vary across segments, with Instruments and Drug Discovery & Development expected to show the most significant expansion during the forecast period.
Key Drivers of Glycobiology Market Growth
Several factors drive the growth of the Glycobiology market:
- Technological Advancements: Improved mass spectrometry techniques, novel glycan analysis methods.
- Rising Prevalence of Chronic Diseases: Increased incidence of cancer, autoimmune disorders, and infectious diseases boosts demand for diagnostics and therapeutics.
- Growing Investment in R&D: Increased funding for glycobiology research from both government and private sectors.
- Personalized Medicine: Growing focus on personalized therapies necessitates sophisticated glycan analysis tools.
Challenges in the Glycobiology Market Sector
Challenges include:
- High Cost of Technology: Advanced mass spectrometry and other technologies can be expensive, limiting accessibility.
- Complexity of Glycan Analysis: Glycans are structurally diverse, requiring sophisticated analysis methods.
- Regulatory Hurdles: Stringent regulations governing the development and approval of glycobiology-based products can create delays and increase costs. These hurdles collectively represent a significant challenge to market growth, potentially impacting the market size by xx Million within the next five years.
Emerging Opportunities in Glycobiology Market
Emerging opportunities include:
- Expansion into New Therapeutic Areas: Application of glycobiology in areas such as vaccine development and regenerative medicine.
- Development of Novel Diagnostic Tools: Creation of sensitive and specific diagnostic tests for glycobiology-related diseases.
- Integration of Artificial Intelligence: AI-driven tools can assist in interpreting complex glycan data.
Leading Players in the Glycobiology Market
- Waters Corporation
- Merck KGaA
- New England Biolabs
- ProZyme
- Takara Bio
- Danaher Corporation
- Thermo Fisher Scientific
- Bruker Corporation
- Agilent Technologies
- Shimadzu Corporation
Key Developments in Glycobiology Market Industry
June 2022: Thermo Fisher Scientific announced a co-marketing agreement with TransMIT GmbH to promote the use of a mass spectrometry imaging (MSI) platform for spatial multi-omics applications. This development strengthens Thermo Fisher's market position in the spatial multi-omics market and highlights the growing importance of MSI in glycobiology research.
April 2022: Bruker launched a novel MALDI HiPLEX-IHC tissue imaging solution, enhancing its capabilities in tissue imaging and expanding the applications of its timsTOF flex platform for glycomics research. This launch significantly boosts Bruker’s competitive edge in the field of tissue-based glycomics.
Strategic Outlook for Glycobiology Market
The Glycobiology market is poised for continued strong growth, driven by technological advancements, increasing demand for personalized medicine, and the rising prevalence of chronic diseases. Opportunities exist in developing novel diagnostic tools, expanding into new therapeutic areas, and leveraging AI to enhance data analysis. The market is expected to see continued consolidation through mergers and acquisitions, as larger companies seek to strengthen their market positions and expand their product portfolios. The strategic focus should be on innovation, strategic partnerships, and meeting the ever-evolving needs of the pharmaceutical and biotechnology industries.
Glycobiology Market Segmentation
-
1. Product
- 1.1. Enzymes
- 1.2. Instruments
- 1.3. Kits and Reagents
-
2. Application
- 2.1. Diagnostics
- 2.2. Drug Discovery and Development
- 2.3. Oncology
- 2.4. Immunology
- 2.5. Other Applications
-
3. End User
- 3.1. Pharmaceutical and Biotechnology Companies
- 3.2. Contract Research Organizations
- 3.3. Other End Users
Glycobiology Market Segmentation By Geography
-
1. North America
- 1.1. United States
- 1.2. Canada
- 1.3. Mexico
-
2. Europe
- 2.1. Germany
- 2.2. United Kingdom
- 2.3. France
- 2.4. Italy
- 2.5. Spain
- 2.6. Rest of Europe
-
3. Asia Pacific
- 3.1. China
- 3.2. Japan
- 3.3. India
- 3.4. Australia
- 3.5. South Korea
- 3.6. Rest of Asia Pacific
-
4. Middle East and Africa
- 4.1. GCC
- 4.2. South Africa
- 4.3. Rest of Middle East and Africa
-
5. South America
- 5.1. Brazil
- 5.2. Argentina
- 5.3. Rest of South America
Glycobiology Market REPORT HIGHLIGHTS
| Aspects | Details |
|---|---|
| Study Period | 2019-2033 |
| Base Year | 2024 |
| Estimated Year | 2025 |
| Forecast Period | 2025-2033 |
| Historical Period | 2019-2024 |
| Growth Rate | CAGR of 14.87% from 2019-2033 |
| Segmentation |
|
Table of Contents
- 1. Introduction
- 1.1. Research Scope
- 1.2. Market Segmentation
- 1.3. Research Methodology
- 1.4. Definitions and Assumptions
- 2. Executive Summary
- 2.1. Introduction
- 3. Market Dynamics
- 3.1. Introduction
- 3.2. Market Drivers
- 3.2.1. Increasing Government and Private Funding for Glycomics and Proteomics Research; Growing R&D Expenditures by Pharmaceutical and Biotechnology Companies
- 3.3. Market Restrains
- 3.3.1. High Product Cost; Low Availability of Skilled Professionals
- 3.4. Market Trends
- 3.4.1. Drug Discovery and Development is Expected to be the Largest Growing Segment
- 4. Market Factor Analysis
- 4.1. Porters Five Forces
- 4.2. Supply/Value Chain
- 4.3. PESTEL analysis
- 4.4. Market Entropy
- 4.5. Patent/Trademark Analysis
- 5. Global Glycobiology Market Analysis, Insights and Forecast, 2019-2031
- 5.1. Market Analysis, Insights and Forecast - by Product
- 5.1.1. Enzymes
- 5.1.2. Instruments
- 5.1.3. Kits and Reagents
- 5.2. Market Analysis, Insights and Forecast - by Application
- 5.2.1. Diagnostics
- 5.2.2. Drug Discovery and Development
- 5.2.3. Oncology
- 5.2.4. Immunology
- 5.2.5. Other Applications
- 5.3. Market Analysis, Insights and Forecast - by End User
- 5.3.1. Pharmaceutical and Biotechnology Companies
- 5.3.2. Contract Research Organizations
- 5.3.3. Other End Users
- 5.4. Market Analysis, Insights and Forecast - by Region
- 5.4.1. North America
- 5.4.2. Europe
- 5.4.3. Asia Pacific
- 5.4.4. Middle East and Africa
- 5.4.5. South America
- 5.1. Market Analysis, Insights and Forecast - by Product
- 6. North America Glycobiology Market Analysis, Insights and Forecast, 2019-2031
- 6.1. Market Analysis, Insights and Forecast - by Product
- 6.1.1. Enzymes
- 6.1.2. Instruments
- 6.1.3. Kits and Reagents
- 6.2. Market Analysis, Insights and Forecast - by Application
- 6.2.1. Diagnostics
- 6.2.2. Drug Discovery and Development
- 6.2.3. Oncology
- 6.2.4. Immunology
- 6.2.5. Other Applications
- 6.3. Market Analysis, Insights and Forecast - by End User
- 6.3.1. Pharmaceutical and Biotechnology Companies
- 6.3.2. Contract Research Organizations
- 6.3.3. Other End Users
- 6.1. Market Analysis, Insights and Forecast - by Product
- 7. Europe Glycobiology Market Analysis, Insights and Forecast, 2019-2031
- 7.1. Market Analysis, Insights and Forecast - by Product
- 7.1.1. Enzymes
- 7.1.2. Instruments
- 7.1.3. Kits and Reagents
- 7.2. Market Analysis, Insights and Forecast - by Application
- 7.2.1. Diagnostics
- 7.2.2. Drug Discovery and Development
- 7.2.3. Oncology
- 7.2.4. Immunology
- 7.2.5. Other Applications
- 7.3. Market Analysis, Insights and Forecast - by End User
- 7.3.1. Pharmaceutical and Biotechnology Companies
- 7.3.2. Contract Research Organizations
- 7.3.3. Other End Users
- 7.1. Market Analysis, Insights and Forecast - by Product
- 8. Asia Pacific Glycobiology Market Analysis, Insights and Forecast, 2019-2031
- 8.1. Market Analysis, Insights and Forecast - by Product
- 8.1.1. Enzymes
- 8.1.2. Instruments
- 8.1.3. Kits and Reagents
- 8.2. Market Analysis, Insights and Forecast - by Application
- 8.2.1. Diagnostics
- 8.2.2. Drug Discovery and Development
- 8.2.3. Oncology
- 8.2.4. Immunology
- 8.2.5. Other Applications
- 8.3. Market Analysis, Insights and Forecast - by End User
- 8.3.1. Pharmaceutical and Biotechnology Companies
- 8.3.2. Contract Research Organizations
- 8.3.3. Other End Users
- 8.1. Market Analysis, Insights and Forecast - by Product
- 9. Middle East and Africa Glycobiology Market Analysis, Insights and Forecast, 2019-2031
- 9.1. Market Analysis, Insights and Forecast - by Product
- 9.1.1. Enzymes
- 9.1.2. Instruments
- 9.1.3. Kits and Reagents
- 9.2. Market Analysis, Insights and Forecast - by Application
- 9.2.1. Diagnostics
- 9.2.2. Drug Discovery and Development
- 9.2.3. Oncology
- 9.2.4. Immunology
- 9.2.5. Other Applications
- 9.3. Market Analysis, Insights and Forecast - by End User
- 9.3.1. Pharmaceutical and Biotechnology Companies
- 9.3.2. Contract Research Organizations
- 9.3.3. Other End Users
- 9.1. Market Analysis, Insights and Forecast - by Product
- 10. South America Glycobiology Market Analysis, Insights and Forecast, 2019-2031
- 10.1. Market Analysis, Insights and Forecast - by Product
- 10.1.1. Enzymes
- 10.1.2. Instruments
- 10.1.3. Kits and Reagents
- 10.2. Market Analysis, Insights and Forecast - by Application
- 10.2.1. Diagnostics
- 10.2.2. Drug Discovery and Development
- 10.2.3. Oncology
- 10.2.4. Immunology
- 10.2.5. Other Applications
- 10.3. Market Analysis, Insights and Forecast - by End User
- 10.3.1. Pharmaceutical and Biotechnology Companies
- 10.3.2. Contract Research Organizations
- 10.3.3. Other End Users
- 10.1. Market Analysis, Insights and Forecast - by Product
- 11. North America Glycobiology Market Analysis, Insights and Forecast, 2019-2031
- 11.1. Market Analysis, Insights and Forecast - By Country/Sub-region
- 11.1.1 United States
- 11.1.2 Canada
- 11.1.3 Mexico
- 12. Europe Glycobiology Market Analysis, Insights and Forecast, 2019-2031
- 12.1. Market Analysis, Insights and Forecast - By Country/Sub-region
- 12.1.1 Germany
- 12.1.2 United Kingdom
- 12.1.3 France
- 12.1.4 Italy
- 12.1.5 Spain
- 12.1.6 Rest of Europe
- 13. Asia Pacific Glycobiology Market Analysis, Insights and Forecast, 2019-2031
- 13.1. Market Analysis, Insights and Forecast - By Country/Sub-region
- 13.1.1 China
- 13.1.2 Japan
- 13.1.3 India
- 13.1.4 Australia
- 13.1.5 South Korea
- 13.1.6 Rest of Asia Pacific
- 14. Middle East and Africa Glycobiology Market Analysis, Insights and Forecast, 2019-2031
- 14.1. Market Analysis, Insights and Forecast - By Country/Sub-region
- 14.1.1 GCC
- 14.1.2 South Africa
- 14.1.3 Rest of Middle East and Africa
- 15. South America Glycobiology Market Analysis, Insights and Forecast, 2019-2031
- 15.1. Market Analysis, Insights and Forecast - By Country/Sub-region
- 15.1.1 Brazil
- 15.1.2 Argentina
- 15.1.3 Rest of South America
- 16. Competitive Analysis
- 16.1. Global Market Share Analysis 2024
- 16.2. Company Profiles
- 16.2.1 Waters Corporation
- 16.2.1.1. Overview
- 16.2.1.2. Products
- 16.2.1.3. SWOT Analysis
- 16.2.1.4. Recent Developments
- 16.2.1.5. Financials (Based on Availability)
- 16.2.2 Merck KGaA
- 16.2.2.1. Overview
- 16.2.2.2. Products
- 16.2.2.3. SWOT Analysis
- 16.2.2.4. Recent Developments
- 16.2.2.5. Financials (Based on Availability)
- 16.2.3 New England Biolabs
- 16.2.3.1. Overview
- 16.2.3.2. Products
- 16.2.3.3. SWOT Analysis
- 16.2.3.4. Recent Developments
- 16.2.3.5. Financials (Based on Availability)
- 16.2.4 ProZyme
- 16.2.4.1. Overview
- 16.2.4.2. Products
- 16.2.4.3. SWOT Analysis
- 16.2.4.4. Recent Developments
- 16.2.4.5. Financials (Based on Availability)
- 16.2.5 Takara Bio
- 16.2.5.1. Overview
- 16.2.5.2. Products
- 16.2.5.3. SWOT Analysis
- 16.2.5.4. Recent Developments
- 16.2.5.5. Financials (Based on Availability)
- 16.2.6 Danaher Corporation
- 16.2.6.1. Overview
- 16.2.6.2. Products
- 16.2.6.3. SWOT Analysis
- 16.2.6.4. Recent Developments
- 16.2.6.5. Financials (Based on Availability)
- 16.2.7 Thermo Fisher Scientific
- 16.2.7.1. Overview
- 16.2.7.2. Products
- 16.2.7.3. SWOT Analysis
- 16.2.7.4. Recent Developments
- 16.2.7.5. Financials (Based on Availability)
- 16.2.8 Bruker Corporation
- 16.2.8.1. Overview
- 16.2.8.2. Products
- 16.2.8.3. SWOT Analysis
- 16.2.8.4. Recent Developments
- 16.2.8.5. Financials (Based on Availability)
- 16.2.9 Agilent Technologies
- 16.2.9.1. Overview
- 16.2.9.2. Products
- 16.2.9.3. SWOT Analysis
- 16.2.9.4. Recent Developments
- 16.2.9.5. Financials (Based on Availability)
- 16.2.10 Shimadzu Corporation
- 16.2.10.1. Overview
- 16.2.10.2. Products
- 16.2.10.3. SWOT Analysis
- 16.2.10.4. Recent Developments
- 16.2.10.5. Financials (Based on Availability)
- 16.2.1 Waters Corporation
List of Figures
- Figure 1: Global Glycobiology Market Revenue Breakdown (Million, %) by Region 2024 & 2032
- Figure 2: Global Glycobiology Market Volume Breakdown (K Unit, %) by Region 2024 & 2032
- Figure 3: North America Glycobiology Market Revenue (Million), by Country 2024 & 2032
- Figure 4: North America Glycobiology Market Volume (K Unit), by Country 2024 & 2032
- Figure 5: North America Glycobiology Market Revenue Share (%), by Country 2024 & 2032
- Figure 6: North America Glycobiology Market Volume Share (%), by Country 2024 & 2032
- Figure 7: Europe Glycobiology Market Revenue (Million), by Country 2024 & 2032
- Figure 8: Europe Glycobiology Market Volume (K Unit), by Country 2024 & 2032
- Figure 9: Europe Glycobiology Market Revenue Share (%), by Country 2024 & 2032
- Figure 10: Europe Glycobiology Market Volume Share (%), by Country 2024 & 2032
- Figure 11: Asia Pacific Glycobiology Market Revenue (Million), by Country 2024 & 2032
- Figure 12: Asia Pacific Glycobiology Market Volume (K Unit), by Country 2024 & 2032
- Figure 13: Asia Pacific Glycobiology Market Revenue Share (%), by Country 2024 & 2032
- Figure 14: Asia Pacific Glycobiology Market Volume Share (%), by Country 2024 & 2032
- Figure 15: Middle East and Africa Glycobiology Market Revenue (Million), by Country 2024 & 2032
- Figure 16: Middle East and Africa Glycobiology Market Volume (K Unit), by Country 2024 & 2032
- Figure 17: Middle East and Africa Glycobiology Market Revenue Share (%), by Country 2024 & 2032
- Figure 18: Middle East and Africa Glycobiology Market Volume Share (%), by Country 2024 & 2032
- Figure 19: South America Glycobiology Market Revenue (Million), by Country 2024 & 2032
- Figure 20: South America Glycobiology Market Volume (K Unit), by Country 2024 & 2032
- Figure 21: South America Glycobiology Market Revenue Share (%), by Country 2024 & 2032
- Figure 22: South America Glycobiology Market Volume Share (%), by Country 2024 & 2032
- Figure 23: North America Glycobiology Market Revenue (Million), by Product 2024 & 2032
- Figure 24: North America Glycobiology Market Volume (K Unit), by Product 2024 & 2032
- Figure 25: North America Glycobiology Market Revenue Share (%), by Product 2024 & 2032
- Figure 26: North America Glycobiology Market Volume Share (%), by Product 2024 & 2032
- Figure 27: North America Glycobiology Market Revenue (Million), by Application 2024 & 2032
- Figure 28: North America Glycobiology Market Volume (K Unit), by Application 2024 & 2032
- Figure 29: North America Glycobiology Market Revenue Share (%), by Application 2024 & 2032
- Figure 30: North America Glycobiology Market Volume Share (%), by Application 2024 & 2032
- Figure 31: North America Glycobiology Market Revenue (Million), by End User 2024 & 2032
- Figure 32: North America Glycobiology Market Volume (K Unit), by End User 2024 & 2032
- Figure 33: North America Glycobiology Market Revenue Share (%), by End User 2024 & 2032
- Figure 34: North America Glycobiology Market Volume Share (%), by End User 2024 & 2032
- Figure 35: North America Glycobiology Market Revenue (Million), by Country 2024 & 2032
- Figure 36: North America Glycobiology Market Volume (K Unit), by Country 2024 & 2032
- Figure 37: North America Glycobiology Market Revenue Share (%), by Country 2024 & 2032
- Figure 38: North America Glycobiology Market Volume Share (%), by Country 2024 & 2032
- Figure 39: Europe Glycobiology Market Revenue (Million), by Product 2024 & 2032
- Figure 40: Europe Glycobiology Market Volume (K Unit), by Product 2024 & 2032
- Figure 41: Europe Glycobiology Market Revenue Share (%), by Product 2024 & 2032
- Figure 42: Europe Glycobiology Market Volume Share (%), by Product 2024 & 2032
- Figure 43: Europe Glycobiology Market Revenue (Million), by Application 2024 & 2032
- Figure 44: Europe Glycobiology Market Volume (K Unit), by Application 2024 & 2032
- Figure 45: Europe Glycobiology Market Revenue Share (%), by Application 2024 & 2032
- Figure 46: Europe Glycobiology Market Volume Share (%), by Application 2024 & 2032
- Figure 47: Europe Glycobiology Market Revenue (Million), by End User 2024 & 2032
- Figure 48: Europe Glycobiology Market Volume (K Unit), by End User 2024 & 2032
- Figure 49: Europe Glycobiology Market Revenue Share (%), by End User 2024 & 2032
- Figure 50: Europe Glycobiology Market Volume Share (%), by End User 2024 & 2032
- Figure 51: Europe Glycobiology Market Revenue (Million), by Country 2024 & 2032
- Figure 52: Europe Glycobiology Market Volume (K Unit), by Country 2024 & 2032
- Figure 53: Europe Glycobiology Market Revenue Share (%), by Country 2024 & 2032
- Figure 54: Europe Glycobiology Market Volume Share (%), by Country 2024 & 2032
- Figure 55: Asia Pacific Glycobiology Market Revenue (Million), by Product 2024 & 2032
- Figure 56: Asia Pacific Glycobiology Market Volume (K Unit), by Product 2024 & 2032
- Figure 57: Asia Pacific Glycobiology Market Revenue Share (%), by Product 2024 & 2032
- Figure 58: Asia Pacific Glycobiology Market Volume Share (%), by Product 2024 & 2032
- Figure 59: Asia Pacific Glycobiology Market Revenue (Million), by Application 2024 & 2032
- Figure 60: Asia Pacific Glycobiology Market Volume (K Unit), by Application 2024 & 2032
- Figure 61: Asia Pacific Glycobiology Market Revenue Share (%), by Application 2024 & 2032
- Figure 62: Asia Pacific Glycobiology Market Volume Share (%), by Application 2024 & 2032
- Figure 63: Asia Pacific Glycobiology Market Revenue (Million), by End User 2024 & 2032
- Figure 64: Asia Pacific Glycobiology Market Volume (K Unit), by End User 2024 & 2032
- Figure 65: Asia Pacific Glycobiology Market Revenue Share (%), by End User 2024 & 2032
- Figure 66: Asia Pacific Glycobiology Market Volume Share (%), by End User 2024 & 2032
- Figure 67: Asia Pacific Glycobiology Market Revenue (Million), by Country 2024 & 2032
- Figure 68: Asia Pacific Glycobiology Market Volume (K Unit), by Country 2024 & 2032
- Figure 69: Asia Pacific Glycobiology Market Revenue Share (%), by Country 2024 & 2032
- Figure 70: Asia Pacific Glycobiology Market Volume Share (%), by Country 2024 & 2032
- Figure 71: Middle East and Africa Glycobiology Market Revenue (Million), by Product 2024 & 2032
- Figure 72: Middle East and Africa Glycobiology Market Volume (K Unit), by Product 2024 & 2032
- Figure 73: Middle East and Africa Glycobiology Market Revenue Share (%), by Product 2024 & 2032
- Figure 74: Middle East and Africa Glycobiology Market Volume Share (%), by Product 2024 & 2032
- Figure 75: Middle East and Africa Glycobiology Market Revenue (Million), by Application 2024 & 2032
- Figure 76: Middle East and Africa Glycobiology Market Volume (K Unit), by Application 2024 & 2032
- Figure 77: Middle East and Africa Glycobiology Market Revenue Share (%), by Application 2024 & 2032
- Figure 78: Middle East and Africa Glycobiology Market Volume Share (%), by Application 2024 & 2032
- Figure 79: Middle East and Africa Glycobiology Market Revenue (Million), by End User 2024 & 2032
- Figure 80: Middle East and Africa Glycobiology Market Volume (K Unit), by End User 2024 & 2032
- Figure 81: Middle East and Africa Glycobiology Market Revenue Share (%), by End User 2024 & 2032
- Figure 82: Middle East and Africa Glycobiology Market Volume Share (%), by End User 2024 & 2032
- Figure 83: Middle East and Africa Glycobiology Market Revenue (Million), by Country 2024 & 2032
- Figure 84: Middle East and Africa Glycobiology Market Volume (K Unit), by Country 2024 & 2032
- Figure 85: Middle East and Africa Glycobiology Market Revenue Share (%), by Country 2024 & 2032
- Figure 86: Middle East and Africa Glycobiology Market Volume Share (%), by Country 2024 & 2032
- Figure 87: South America Glycobiology Market Revenue (Million), by Product 2024 & 2032
- Figure 88: South America Glycobiology Market Volume (K Unit), by Product 2024 & 2032
- Figure 89: South America Glycobiology Market Revenue Share (%), by Product 2024 & 2032
- Figure 90: South America Glycobiology Market Volume Share (%), by Product 2024 & 2032
- Figure 91: South America Glycobiology Market Revenue (Million), by Application 2024 & 2032
- Figure 92: South America Glycobiology Market Volume (K Unit), by Application 2024 & 2032
- Figure 93: South America Glycobiology Market Revenue Share (%), by Application 2024 & 2032
- Figure 94: South America Glycobiology Market Volume Share (%), by Application 2024 & 2032
- Figure 95: South America Glycobiology Market Revenue (Million), by End User 2024 & 2032
- Figure 96: South America Glycobiology Market Volume (K Unit), by End User 2024 & 2032
- Figure 97: South America Glycobiology Market Revenue Share (%), by End User 2024 & 2032
- Figure 98: South America Glycobiology Market Volume Share (%), by End User 2024 & 2032
- Figure 99: South America Glycobiology Market Revenue (Million), by Country 2024 & 2032
- Figure 100: South America Glycobiology Market Volume (K Unit), by Country 2024 & 2032
- Figure 101: South America Glycobiology Market Revenue Share (%), by Country 2024 & 2032
- Figure 102: South America Glycobiology Market Volume Share (%), by Country 2024 & 2032
List of Tables
- Table 1: Global Glycobiology Market Revenue Million Forecast, by Region 2019 & 2032
- Table 2: Global Glycobiology Market Volume K Unit Forecast, by Region 2019 & 2032
- Table 3: Global Glycobiology Market Revenue Million Forecast, by Product 2019 & 2032
- Table 4: Global Glycobiology Market Volume K Unit Forecast, by Product 2019 & 2032
- Table 5: Global Glycobiology Market Revenue Million Forecast, by Application 2019 & 2032
- Table 6: Global Glycobiology Market Volume K Unit Forecast, by Application 2019 & 2032
- Table 7: Global Glycobiology Market Revenue Million Forecast, by End User 2019 & 2032
- Table 8: Global Glycobiology Market Volume K Unit Forecast, by End User 2019 & 2032
- Table 9: Global Glycobiology Market Revenue Million Forecast, by Region 2019 & 2032
- Table 10: Global Glycobiology Market Volume K Unit Forecast, by Region 2019 & 2032
- Table 11: Global Glycobiology Market Revenue Million Forecast, by Country 2019 & 2032
- Table 12: Global Glycobiology Market Volume K Unit Forecast, by Country 2019 & 2032
- Table 13: United States Glycobiology Market Revenue (Million) Forecast, by Application 2019 & 2032
- Table 14: United States Glycobiology Market Volume (K Unit) Forecast, by Application 2019 & 2032
- Table 15: Canada Glycobiology Market Revenue (Million) Forecast, by Application 2019 & 2032
- Table 16: Canada Glycobiology Market Volume (K Unit) Forecast, by Application 2019 & 2032
- Table 17: Mexico Glycobiology Market Revenue (Million) Forecast, by Application 2019 & 2032
- Table 18: Mexico Glycobiology Market Volume (K Unit) Forecast, by Application 2019 & 2032
- Table 19: Global Glycobiology Market Revenue Million Forecast, by Country 2019 & 2032
- Table 20: Global Glycobiology Market Volume K Unit Forecast, by Country 2019 & 2032
- Table 21: Germany Glycobiology Market Revenue (Million) Forecast, by Application 2019 & 2032
- Table 22: Germany Glycobiology Market Volume (K Unit) Forecast, by Application 2019 & 2032
- Table 23: United Kingdom Glycobiology Market Revenue (Million) Forecast, by Application 2019 & 2032
- Table 24: United Kingdom Glycobiology Market Volume (K Unit) Forecast, by Application 2019 & 2032
- Table 25: France Glycobiology Market Revenue (Million) Forecast, by Application 2019 & 2032
- Table 26: France Glycobiology Market Volume (K Unit) Forecast, by Application 2019 & 2032
- Table 27: Italy Glycobiology Market Revenue (Million) Forecast, by Application 2019 & 2032
- Table 28: Italy Glycobiology Market Volume (K Unit) Forecast, by Application 2019 & 2032
- Table 29: Spain Glycobiology Market Revenue (Million) Forecast, by Application 2019 & 2032
- Table 30: Spain Glycobiology Market Volume (K Unit) Forecast, by Application 2019 & 2032
- Table 31: Rest of Europe Glycobiology Market Revenue (Million) Forecast, by Application 2019 & 2032
- Table 32: Rest of Europe Glycobiology Market Volume (K Unit) Forecast, by Application 2019 & 2032
- Table 33: Global Glycobiology Market Revenue Million Forecast, by Country 2019 & 2032
- Table 34: Global Glycobiology Market Volume K Unit Forecast, by Country 2019 & 2032
- Table 35: China Glycobiology Market Revenue (Million) Forecast, by Application 2019 & 2032
- Table 36: China Glycobiology Market Volume (K Unit) Forecast, by Application 2019 & 2032
- Table 37: Japan Glycobiology Market Revenue (Million) Forecast, by Application 2019 & 2032
- Table 38: Japan Glycobiology Market Volume (K Unit) Forecast, by Application 2019 & 2032
- Table 39: India Glycobiology Market Revenue (Million) Forecast, by Application 2019 & 2032
- Table 40: India Glycobiology Market Volume (K Unit) Forecast, by Application 2019 & 2032
- Table 41: Australia Glycobiology Market Revenue (Million) Forecast, by Application 2019 & 2032
- Table 42: Australia Glycobiology Market Volume (K Unit) Forecast, by Application 2019 & 2032
- Table 43: South Korea Glycobiology Market Revenue (Million) Forecast, by Application 2019 & 2032
- Table 44: South Korea Glycobiology Market Volume (K Unit) Forecast, by Application 2019 & 2032
- Table 45: Rest of Asia Pacific Glycobiology Market Revenue (Million) Forecast, by Application 2019 & 2032
- Table 46: Rest of Asia Pacific Glycobiology Market Volume (K Unit) Forecast, by Application 2019 & 2032
- Table 47: Global Glycobiology Market Revenue Million Forecast, by Country 2019 & 2032
- Table 48: Global Glycobiology Market Volume K Unit Forecast, by Country 2019 & 2032
- Table 49: GCC Glycobiology Market Revenue (Million) Forecast, by Application 2019 & 2032
- Table 50: GCC Glycobiology Market Volume (K Unit) Forecast, by Application 2019 & 2032
- Table 51: South Africa Glycobiology Market Revenue (Million) Forecast, by Application 2019 & 2032
- Table 52: South Africa Glycobiology Market Volume (K Unit) Forecast, by Application 2019 & 2032
- Table 53: Rest of Middle East and Africa Glycobiology Market Revenue (Million) Forecast, by Application 2019 & 2032
- Table 54: Rest of Middle East and Africa Glycobiology Market Volume (K Unit) Forecast, by Application 2019 & 2032
- Table 55: Global Glycobiology Market Revenue Million Forecast, by Country 2019 & 2032
- Table 56: Global Glycobiology Market Volume K Unit Forecast, by Country 2019 & 2032
- Table 57: Brazil Glycobiology Market Revenue (Million) Forecast, by Application 2019 & 2032
- Table 58: Brazil Glycobiology Market Volume (K Unit) Forecast, by Application 2019 & 2032
- Table 59: Argentina Glycobiology Market Revenue (Million) Forecast, by Application 2019 & 2032
- Table 60: Argentina Glycobiology Market Volume (K Unit) Forecast, by Application 2019 & 2032
- Table 61: Rest of South America Glycobiology Market Revenue (Million) Forecast, by Application 2019 & 2032
- Table 62: Rest of South America Glycobiology Market Volume (K Unit) Forecast, by Application 2019 & 2032
- Table 63: Global Glycobiology Market Revenue Million Forecast, by Product 2019 & 2032
- Table 64: Global Glycobiology Market Volume K Unit Forecast, by Product 2019 & 2032
- Table 65: Global Glycobiology Market Revenue Million Forecast, by Application 2019 & 2032
- Table 66: Global Glycobiology Market Volume K Unit Forecast, by Application 2019 & 2032
- Table 67: Global Glycobiology Market Revenue Million Forecast, by End User 2019 & 2032
- Table 68: Global Glycobiology Market Volume K Unit Forecast, by End User 2019 & 2032
- Table 69: Global Glycobiology Market Revenue Million Forecast, by Country 2019 & 2032
- Table 70: Global Glycobiology Market Volume K Unit Forecast, by Country 2019 & 2032
- Table 71: United States Glycobiology Market Revenue (Million) Forecast, by Application 2019 & 2032
- Table 72: United States Glycobiology Market Volume (K Unit) Forecast, by Application 2019 & 2032
- Table 73: Canada Glycobiology Market Revenue (Million) Forecast, by Application 2019 & 2032
- Table 74: Canada Glycobiology Market Volume (K Unit) Forecast, by Application 2019 & 2032
- Table 75: Mexico Glycobiology Market Revenue (Million) Forecast, by Application 2019 & 2032
- Table 76: Mexico Glycobiology Market Volume (K Unit) Forecast, by Application 2019 & 2032
- Table 77: Global Glycobiology Market Revenue Million Forecast, by Product 2019 & 2032
- Table 78: Global Glycobiology Market Volume K Unit Forecast, by Product 2019 & 2032
- Table 79: Global Glycobiology Market Revenue Million Forecast, by Application 2019 & 2032
- Table 80: Global Glycobiology Market Volume K Unit Forecast, by Application 2019 & 2032
- Table 81: Global Glycobiology Market Revenue Million Forecast, by End User 2019 & 2032
- Table 82: Global Glycobiology Market Volume K Unit Forecast, by End User 2019 & 2032
- Table 83: Global Glycobiology Market Revenue Million Forecast, by Country 2019 & 2032
- Table 84: Global Glycobiology Market Volume K Unit Forecast, by Country 2019 & 2032
- Table 85: Germany Glycobiology Market Revenue (Million) Forecast, by Application 2019 & 2032
- Table 86: Germany Glycobiology Market Volume (K Unit) Forecast, by Application 2019 & 2032
- Table 87: United Kingdom Glycobiology Market Revenue (Million) Forecast, by Application 2019 & 2032
- Table 88: United Kingdom Glycobiology Market Volume (K Unit) Forecast, by Application 2019 & 2032
- Table 89: France Glycobiology Market Revenue (Million) Forecast, by Application 2019 & 2032
- Table 90: France Glycobiology Market Volume (K Unit) Forecast, by Application 2019 & 2032
- Table 91: Italy Glycobiology Market Revenue (Million) Forecast, by Application 2019 & 2032
- Table 92: Italy Glycobiology Market Volume (K Unit) Forecast, by Application 2019 & 2032
- Table 93: Spain Glycobiology Market Revenue (Million) Forecast, by Application 2019 & 2032
- Table 94: Spain Glycobiology Market Volume (K Unit) Forecast, by Application 2019 & 2032
- Table 95: Rest of Europe Glycobiology Market Revenue (Million) Forecast, by Application 2019 & 2032
- Table 96: Rest of Europe Glycobiology Market Volume (K Unit) Forecast, by Application 2019 & 2032
- Table 97: Global Glycobiology Market Revenue Million Forecast, by Product 2019 & 2032
- Table 98: Global Glycobiology Market Volume K Unit Forecast, by Product 2019 & 2032
- Table 99: Global Glycobiology Market Revenue Million Forecast, by Application 2019 & 2032
- Table 100: Global Glycobiology Market Volume K Unit Forecast, by Application 2019 & 2032
- Table 101: Global Glycobiology Market Revenue Million Forecast, by End User 2019 & 2032
- Table 102: Global Glycobiology Market Volume K Unit Forecast, by End User 2019 & 2032
- Table 103: Global Glycobiology Market Revenue Million Forecast, by Country 2019 & 2032
- Table 104: Global Glycobiology Market Volume K Unit Forecast, by Country 2019 & 2032
- Table 105: China Glycobiology Market Revenue (Million) Forecast, by Application 2019 & 2032
- Table 106: China Glycobiology Market Volume (K Unit) Forecast, by Application 2019 & 2032
- Table 107: Japan Glycobiology Market Revenue (Million) Forecast, by Application 2019 & 2032
- Table 108: Japan Glycobiology Market Volume (K Unit) Forecast, by Application 2019 & 2032
- Table 109: India Glycobiology Market Revenue (Million) Forecast, by Application 2019 & 2032
- Table 110: India Glycobiology Market Volume (K Unit) Forecast, by Application 2019 & 2032
- Table 111: Australia Glycobiology Market Revenue (Million) Forecast, by Application 2019 & 2032
- Table 112: Australia Glycobiology Market Volume (K Unit) Forecast, by Application 2019 & 2032
- Table 113: South Korea Glycobiology Market Revenue (Million) Forecast, by Application 2019 & 2032
- Table 114: South Korea Glycobiology Market Volume (K Unit) Forecast, by Application 2019 & 2032
- Table 115: Rest of Asia Pacific Glycobiology Market Revenue (Million) Forecast, by Application 2019 & 2032
- Table 116: Rest of Asia Pacific Glycobiology Market Volume (K Unit) Forecast, by Application 2019 & 2032
- Table 117: Global Glycobiology Market Revenue Million Forecast, by Product 2019 & 2032
- Table 118: Global Glycobiology Market Volume K Unit Forecast, by Product 2019 & 2032
- Table 119: Global Glycobiology Market Revenue Million Forecast, by Application 2019 & 2032
- Table 120: Global Glycobiology Market Volume K Unit Forecast, by Application 2019 & 2032
- Table 121: Global Glycobiology Market Revenue Million Forecast, by End User 2019 & 2032
- Table 122: Global Glycobiology Market Volume K Unit Forecast, by End User 2019 & 2032
- Table 123: Global Glycobiology Market Revenue Million Forecast, by Country 2019 & 2032
- Table 124: Global Glycobiology Market Volume K Unit Forecast, by Country 2019 & 2032
- Table 125: GCC Glycobiology Market Revenue (Million) Forecast, by Application 2019 & 2032
- Table 126: GCC Glycobiology Market Volume (K Unit) Forecast, by Application 2019 & 2032
- Table 127: South Africa Glycobiology Market Revenue (Million) Forecast, by Application 2019 & 2032
- Table 128: South Africa Glycobiology Market Volume (K Unit) Forecast, by Application 2019 & 2032
- Table 129: Rest of Middle East and Africa Glycobiology Market Revenue (Million) Forecast, by Application 2019 & 2032
- Table 130: Rest of Middle East and Africa Glycobiology Market Volume (K Unit) Forecast, by Application 2019 & 2032
- Table 131: Global Glycobiology Market Revenue Million Forecast, by Product 2019 & 2032
- Table 132: Global Glycobiology Market Volume K Unit Forecast, by Product 2019 & 2032
- Table 133: Global Glycobiology Market Revenue Million Forecast, by Application 2019 & 2032
- Table 134: Global Glycobiology Market Volume K Unit Forecast, by Application 2019 & 2032
- Table 135: Global Glycobiology Market Revenue Million Forecast, by End User 2019 & 2032
- Table 136: Global Glycobiology Market Volume K Unit Forecast, by End User 2019 & 2032
- Table 137: Global Glycobiology Market Revenue Million Forecast, by Country 2019 & 2032
- Table 138: Global Glycobiology Market Volume K Unit Forecast, by Country 2019 & 2032
- Table 139: Brazil Glycobiology Market Revenue (Million) Forecast, by Application 2019 & 2032
- Table 140: Brazil Glycobiology Market Volume (K Unit) Forecast, by Application 2019 & 2032
- Table 141: Argentina Glycobiology Market Revenue (Million) Forecast, by Application 2019 & 2032
- Table 142: Argentina Glycobiology Market Volume (K Unit) Forecast, by Application 2019 & 2032
- Table 143: Rest of South America Glycobiology Market Revenue (Million) Forecast, by Application 2019 & 2032
- Table 144: Rest of South America Glycobiology Market Volume (K Unit) Forecast, by Application 2019 & 2032
Frequently Asked Questions
1. What is the projected Compound Annual Growth Rate (CAGR) of the Glycobiology Market?
The projected CAGR is approximately 14.87%.
2. Which companies are prominent players in the Glycobiology Market?
Key companies in the market include Waters Corporation, Merck KGaA, New England Biolabs, ProZyme, Takara Bio, Danaher Corporation, Thermo Fisher Scientific, Bruker Corporation, Agilent Technologies, Shimadzu Corporation.
3. What are the main segments of the Glycobiology Market?
The market segments include Product, Application, End User.
4. Can you provide details about the market size?
The market size is estimated to be USD 0.62 Million as of 2022.
5. What are some drivers contributing to market growth?
Increasing Government and Private Funding for Glycomics and Proteomics Research; Growing R&D Expenditures by Pharmaceutical and Biotechnology Companies.
6. What are the notable trends driving market growth?
Drug Discovery and Development is Expected to be the Largest Growing Segment.
7. Are there any restraints impacting market growth?
High Product Cost; Low Availability of Skilled Professionals.
8. Can you provide examples of recent developments in the market?
In June 2022, Thermo Fisher Scientific announced a co-marketing agreement with TransMIT GmbH Center for Mass Spectrometric Developments to promote the use of a mass spectrometry imaging (MSI) platform for spatial multi-omics applications in pharma and clinical labs.
9. What pricing options are available for accessing the report?
Pricing options include single-user, multi-user, and enterprise licenses priced at USD 4750, USD 5250, and USD 8750 respectively.
10. Is the market size provided in terms of value or volume?
The market size is provided in terms of value, measured in Million and volume, measured in K Unit.
11. Are there any specific market keywords associated with the report?
Yes, the market keyword associated with the report is "Glycobiology Market," which aids in identifying and referencing the specific market segment covered.
12. How do I determine which pricing option suits my needs best?
The pricing options vary based on user requirements and access needs. Individual users may opt for single-user licenses, while businesses requiring broader access may choose multi-user or enterprise licenses for cost-effective access to the report.
13. Are there any additional resources or data provided in the Glycobiology Market report?
While the report offers comprehensive insights, it's advisable to review the specific contents or supplementary materials provided to ascertain if additional resources or data are available.
14. How can I stay updated on further developments or reports in the Glycobiology Market?
To stay informed about further developments, trends, and reports in the Glycobiology Market, consider subscribing to industry newsletters, following relevant companies and organizations, or regularly checking reputable industry news sources and publications.
Methodology
Step 1 - Identification of Relevant Samples Size from Population Database


Step 2 - Approaches for Defining Global Market Size (Value, Volume* & Price*)

Note*: In applicable scenarios
Step 3 - Data Sources
Primary Research
- Web Analytics
- Survey Reports
- Research Institute
- Latest Research Reports
- Opinion Leaders
Secondary Research
- Annual Reports
- White Paper
- Latest Press Release
- Industry Association
- Paid Database
- Investor Presentations

Step 4 - Data Triangulation
Involves using different sources of information in order to increase the validity of a study
These sources are likely to be stakeholders in a program - participants, other researchers, program staff, other community members, and so on.
Then we put all data in single framework & apply various statistical tools to find out the dynamic on the market.
During the analysis stage, feedback from the stakeholder groups would be compared to determine areas of agreement as well as areas of divergence


