Key Insights
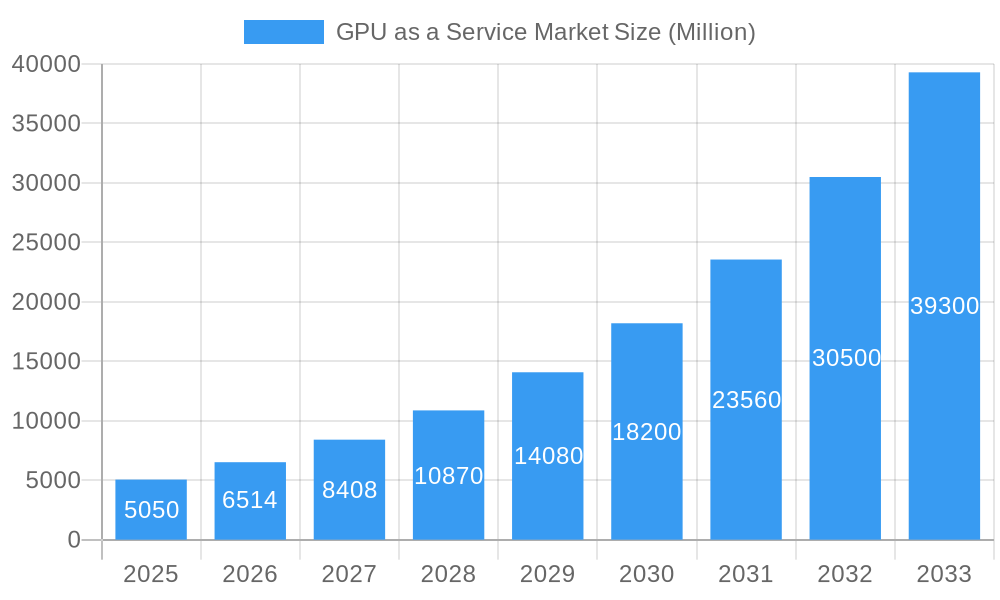
The GPU-as-a-Service (GPUaaS) market is experiencing explosive growth, projected to reach $5.05 billion in 2025 and maintain a robust Compound Annual Growth Rate (CAGR) of 29.20% from 2025 to 2033. This surge is driven by the increasing demand for high-performance computing (HPC) resources across diverse sectors, including artificial intelligence (AI), machine learning (ML), deep learning, data analytics, and scientific research. Organizations are increasingly opting for GPUaaS to avoid the substantial upfront investment and ongoing maintenance associated with owning and managing on-premises GPU infrastructure. The scalability and pay-as-you-go model of GPUaaS are particularly attractive, allowing businesses to easily adjust their computing power according to fluctuating demands. Major cloud providers like Amazon Web Services (AWS), Microsoft Azure, and Google Cloud Platform (GCP) are leading the market, offering a wide range of GPU instances and services catering to various needs and budgets. The market's growth is further fueled by advancements in GPU technology, resulting in enhanced processing power and efficiency, making GPUaaS more accessible and cost-effective for a broader range of users.
GPU as a Service Market Market Size (In Billion)
The competitive landscape is characterized by a mix of established tech giants and emerging specialized providers. While the major cloud players dominate market share, smaller companies are innovating with specialized offerings, targeting niche markets and fostering competition. The market segmentation likely includes various GPU types (e.g., NVIDIA, AMD), service models (e.g., dedicated instances, spot instances), and industry verticals. Geographic expansion, particularly in developing economies with burgeoning technological adoption, presents a significant growth opportunity. However, challenges remain, including concerns about data security and latency, particularly for applications demanding low-latency processing. Addressing these concerns through enhanced security protocols and geographically distributed data centers will be crucial for continued market expansion. Ultimately, the future of GPUaaS appears bright, with sustained growth anticipated as reliance on cloud-based computing resources for intensive computational tasks continues to rise.
GPU as a Service Market Company Market Share
GPU as a Service Market: A Comprehensive Report (2019-2033)
This comprehensive report provides an in-depth analysis of the GPU as a Service market, covering market size, growth drivers, challenges, opportunities, and key players. The study period spans from 2019 to 2033, with 2025 as the base year and estimated year. The forecast period is 2025-2033, and the historical period is 2019-2024. The report is essential for industry stakeholders, investors, and businesses seeking to understand and capitalize on the rapidly evolving GPU as a Service landscape. The market is valued at xx Million in 2025 and is projected to reach xx Million by 2033, exhibiting a CAGR of xx% during the forecast period.
GPU as a Service Market Concentration & Innovation
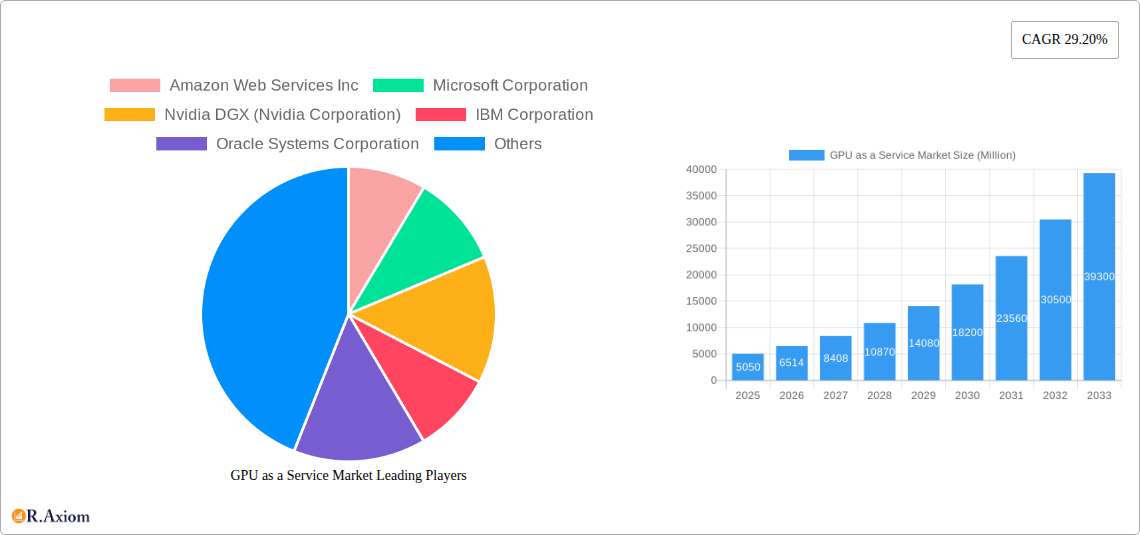
The GPU as a Service market exhibits a moderately concentrated landscape, with a few dominant players commanding significant market share. However, the market is also characterized by considerable innovation, driven by the increasing demand for high-performance computing across various industries. Major players like Amazon Web Services Inc, Microsoft Corporation, and Nvidia DGX (Nvidia Corporation) hold substantial market share, but smaller companies are emerging with innovative offerings.
- Market Share: Amazon Web Services and Microsoft account for approximately xx% of the market share collectively in 2025. Nvidia holds around xx%, while others share the remaining percentage.
- Innovation Drivers: The rapid advancements in AI, machine learning, and deep learning are key drivers for innovation. The need for faster and more cost-effective processing power fuels the development of new GPU architectures and service models.
- Regulatory Frameworks: Regulations related to data privacy and security significantly impact the market. Compliance with regulations like GDPR and CCPA is crucial for service providers.
- Product Substitutes: While cloud-based GPU services are dominant, on-premise solutions and specialized hardware remain viable alternatives, depending on specific needs.
- End-User Trends: Increased adoption of cloud computing and AI across diverse sectors like finance, healthcare, and research significantly influences market growth. The rise of edge computing also creates opportunities for niche players.
- M&A Activities: The market has witnessed significant M&A activity in recent years, with larger companies acquiring smaller firms to expand their offerings and expertise. The total value of M&A deals in the sector reached approximately xx Million in 2024.
GPU as a Service Market Industry Trends & Insights
The GPU as a Service market is experiencing robust growth, fueled by several factors. The increasing adoption of AI and machine learning across industries is a primary driver. The need for scalable and cost-effective computing resources for training and deploying AI models is pushing businesses towards cloud-based GPU services. Technological advancements, such as the development of more powerful GPUs and improved cloud infrastructure, are accelerating market expansion. Consumer preference for on-demand access to computing resources is also contributing to the growth. Competitive dynamics are intense, with leading players continually innovating to offer advanced features and competitive pricing. The market penetration rate for GPU as a Service is estimated to be xx% in 2025 and is projected to grow significantly over the forecast period. The global market CAGR is estimated to be around xx%.
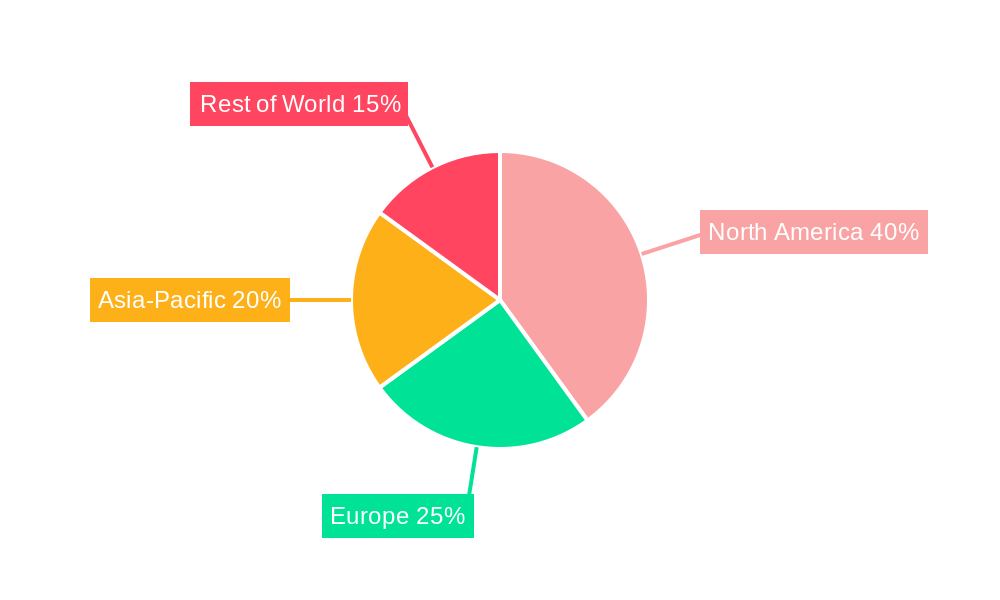
Dominant Markets & Segments in GPU as a Service Market
The North American region currently holds a prominent position in the GPU as a Service market. This leadership is underpinned by its sophisticated technological infrastructure, widespread adoption of cloud computing paradigms, and substantial investments directed towards cutting-edge AI and machine learning research. The strategic presence of leading cloud service providers and influential technology giants within North America significantly bolsters its market dominance.
- Key Drivers in North America:
- Advanced and robust technological infrastructure.
- High and accelerating adoption rate of cloud computing services.
- Significant ongoing investments in Artificial Intelligence research and development initiatives.
- Concentrated presence of major global cloud service providers and technology innovators.
- Dominance Analysis: North America's pioneering embrace of cloud technologies, coupled with a strong ecosystem of major technology firms and well-established data center facilities, has cemented its advantage in the GPU as a Service market. Nevertheless, other dynamic regions, notably Asia-Pacific and Europe, are experiencing rapid growth, propelled by escalating investments in AI and comprehensive digital transformation strategies.
GPU as a Service Market Product Developments
Recent advancements in GPU as a Service offerings are heavily focused on delivering enhanced performance, superior scalability, and optimized cost-effectiveness. The integration of sophisticated technologies such as NVIDIA's Tensor Cores, alongside continuous improvements in virtualization techniques, significantly boosts efficiency in managing complex and demanding AI workloads. These innovations directly address the escalating requirements for AI model training and deployment, providing crucial competitive advantages in terms of processing speed, cost efficiency, and scalability. The market is increasingly witnessing a trend towards specialized GPUs meticulously engineered for specific AI tasks, thereby further elevating performance benchmarks.
Report Scope & Segmentation Analysis
The report segments the GPU as a Service market by deployment mode (cloud-based, on-premise), organization size (small & medium-sized enterprises (SMEs), large enterprises), vertical (healthcare, finance, retail, others), and region (North America, Europe, Asia-Pacific, Middle East & Africa, South America). Each segment offers unique growth opportunities and faces specific competitive dynamics. For instance, the cloud-based deployment mode holds the largest market share, while the healthcare vertical shows rapid growth potential.
Key Drivers of GPU as a Service Market Growth
- Technological Advancements: The ongoing development of more potent and energy-efficient GPUs, complemented by the continuous evolution of cloud computing infrastructure, stands as a primary catalyst for market expansion.
- Increased Adoption of AI/ML: The pervasive integration of Artificial Intelligence and Machine Learning across a multitude of industries is creating a substantial and growing demand for high-performance computing resources.
- Cost Optimization: GPU as a Service presents compelling economic advantages compared to traditional on-premise solutions. It effectively eliminates the necessity for substantial upfront capital expenditures on hardware acquisition and ongoing infrastructure maintenance.
- Scalability and Flexibility: The ability to dynamically scale GPU resources up or down based on project needs offers unparalleled flexibility, allowing businesses to manage fluctuating workloads without over-provisioning.
- Democratization of High-Performance Computing: By abstracting the complexities of hardware management, GPU as a Service makes powerful computational capabilities accessible to a broader range of organizations, including startups and smaller research institutions.
Challenges in the GPU as a Service Market Sector
- High Costs: Despite cost-effectiveness compared to on-premise solutions, the cost of GPU services can still be substantial for some users.
- Security Concerns: Data security and privacy are significant concerns, especially with sensitive data being processed in the cloud.
- Vendor Lock-in: Choosing a specific GPU as a service provider might lead to vendor lock-in, making it difficult to switch providers later.
Emerging Opportunities in GPU as a Service Market
- Edge Computing: The integration of GPU as a Service with edge computing platforms offers opportunities for real-time processing and reduced latency.
- Specialized GPUs: The development of specialized GPUs tailored for specific AI tasks presents new opportunities for efficiency and performance optimization.
- Hybrid Cloud Models: Hybrid cloud models, combining on-premise and cloud-based solutions, offer increased flexibility and control.
Leading Players in the GPU as a Service Market Market
- Amazon Web Services Inc
- Microsoft Corporation
- Nvidia DGX (Nvidia Corporation)
- IBM Corporation
- Oracle Systems Corporation
- Alphabet Inc (Google)
- Latitude sh
- Seeweb
- Alibaba cloud
- Linode LLC
- CoreWeave
- List Not Exhaustive
Key Developments in GPU as a Service Market Industry
- November 2023: Microsoft Corporation significantly enhanced its Azure offerings by announcing the integration of the new NVIDIA H200 Tensor Core GPU. This move aims to empower the handling of larger AI models for inferencing with imperceptible latency increases, thereby accelerating critical AI workloads like Large Language Models (LLMs) and generative AI applications.
- May 2024: Krutrim, an AI startup founded by Ola, launched its own GPU as a Service platform. This initiative is designed to provide developers and enterprises with a cost-effective and accessible solution for training and fine-tuning their AI models, democratizing access to powerful GPU resources.
- January 2024: Amazon Web Services (AWS) expanded its EC2 instances to include more powerful GPU options, such as the new P5 instances featuring NVIDIA H100 Tensor Core GPUs, further bolstering its AI and HPC capabilities for customers.
- February 2024: Google Cloud announced further optimizations and expanded availability of its AI Platform, including enhanced GPU options and tools to streamline the development and deployment of AI models, catering to growing enterprise demand.
Strategic Outlook for GPU as a Service Market Market
The GPU as a Service market is poised for continued strong growth, driven by the increasing adoption of AI, advancements in GPU technology, and the growing need for scalable and cost-effective computing resources. The market will see further consolidation, with major players investing in innovation and expanding their offerings to meet the diverse needs of a rapidly expanding customer base. New opportunities will emerge in specialized AI applications and edge computing, creating further growth potential.
GPU as a Service Market Segmentation
-
1. Application
- 1.1. Artificial Intelligence
- 1.2. High Performance Computing
- 1.3. Other Applications
-
2. Enterprise Type
- 2.1. Small and Medium Enterprise
- 2.2. Large Enterprise
-
3. End User
- 3.1. BFSI
- 3.2. Automotive
- 3.3. Healthcare
- 3.4. IT and Communication
- 3.5. Other End Users
GPU as a Service Market Segmentation By Geography
- 1. North America
- 2. Europe
- 3. Asia
- 4. Australia and New Zealand
- 5. Middle East and Africa
- 6. Latin America
GPU as a Service Market Regional Market Share
Geographic Coverage of GPU as a Service Market
GPU as a Service Market REPORT HIGHLIGHTS
| Aspects | Details |
|---|---|
| Study Period | 2020-2034 |
| Base Year | 2025 |
| Estimated Year | 2026 |
| Forecast Period | 2026-2034 |
| Historical Period | 2020-2025 |
| Growth Rate | CAGR of 29.20% from 2020-2034 |
| Segmentation |
|
Table of Contents
- 1. Introduction
- 1.1. Research Scope
- 1.2. Market Segmentation
- 1.3. Research Objective
- 1.4. Definitions and Assumptions
- 2. Executive Summary
- 2.1. Market Snapshot
- 3. Market Dynamics
- 3.1. Market Drivers
- 3.2. Market Restrains
- 3.3. Market Trends
- 3.4. Market Opportunities
- 4. Market Factor Analysis
- 4.1. Porters Five Forces
- 4.1.1. Bargaining Power of Suppliers
- 4.1.2. Bargaining Power of Buyers
- 4.1.3. Threat of New Entrants
- 4.1.4. Threat of Substitutes
- 4.1.5. Competitive Rivalry
- 4.2. PESTEL analysis
- 4.3. BCG Analysis
- 4.3.1. Stars (High Growth, High Market Share)
- 4.3.2. Cash Cows (Low Growth, High Market Share)
- 4.3.3. Question Mark (High Growth, Low Market Share)
- 4.3.4. Dogs (Low Growth, Low Market Share)
- 4.4. Ansoff Matrix Analysis
- 4.5. Supply Chain Analysis
- 4.6. Regulatory Landscape
- 4.7. Current Market Potential and Opportunity Assessment (TAM–SAM–SOM Framework)
- 4.8. RAX Analyst Note
- 4.1. Porters Five Forces
- 5. Market Analysis, Insights and Forecast 2021-2033
- 5.1. Market Analysis, Insights and Forecast - by Application
- 5.1.1. Artificial Intelligence
- 5.1.2. High Performance Computing
- 5.1.3. Other Applications
- 5.2. Market Analysis, Insights and Forecast - by Enterprise Type
- 5.2.1. Small and Medium Enterprise
- 5.2.2. Large Enterprise
- 5.3. Market Analysis, Insights and Forecast - by End User
- 5.3.1. BFSI
- 5.3.2. Automotive
- 5.3.3. Healthcare
- 5.3.4. IT and Communication
- 5.3.5. Other End Users
- 5.4. Market Analysis, Insights and Forecast - by Region
- 5.4.1. North America
- 5.4.2. Europe
- 5.4.3. Asia
- 5.4.4. Australia and New Zealand
- 5.4.5. Middle East and Africa
- 5.4.6. Latin America
- 5.1. Market Analysis, Insights and Forecast - by Application
- 6. Global GPU as a Service Market Analysis, Insights and Forecast, 2021-2033
- 6.1. Market Analysis, Insights and Forecast - by Application
- 6.1.1. Artificial Intelligence
- 6.1.2. High Performance Computing
- 6.1.3. Other Applications
- 6.2. Market Analysis, Insights and Forecast - by Enterprise Type
- 6.2.1. Small and Medium Enterprise
- 6.2.2. Large Enterprise
- 6.3. Market Analysis, Insights and Forecast - by End User
- 6.3.1. BFSI
- 6.3.2. Automotive
- 6.3.3. Healthcare
- 6.3.4. IT and Communication
- 6.3.5. Other End Users
- 6.1. Market Analysis, Insights and Forecast - by Application
- 7. North America GPU as a Service Market Analysis, Insights and Forecast, 2020-2032
- 7.1. Market Analysis, Insights and Forecast - by Application
- 7.1.1. Artificial Intelligence
- 7.1.2. High Performance Computing
- 7.1.3. Other Applications
- 7.2. Market Analysis, Insights and Forecast - by Enterprise Type
- 7.2.1. Small and Medium Enterprise
- 7.2.2. Large Enterprise
- 7.3. Market Analysis, Insights and Forecast - by End User
- 7.3.1. BFSI
- 7.3.2. Automotive
- 7.3.3. Healthcare
- 7.3.4. IT and Communication
- 7.3.5. Other End Users
- 7.1. Market Analysis, Insights and Forecast - by Application
- 8. Europe GPU as a Service Market Analysis, Insights and Forecast, 2020-2032
- 8.1. Market Analysis, Insights and Forecast - by Application
- 8.1.1. Artificial Intelligence
- 8.1.2. High Performance Computing
- 8.1.3. Other Applications
- 8.2. Market Analysis, Insights and Forecast - by Enterprise Type
- 8.2.1. Small and Medium Enterprise
- 8.2.2. Large Enterprise
- 8.3. Market Analysis, Insights and Forecast - by End User
- 8.3.1. BFSI
- 8.3.2. Automotive
- 8.3.3. Healthcare
- 8.3.4. IT and Communication
- 8.3.5. Other End Users
- 8.1. Market Analysis, Insights and Forecast - by Application
- 9. Asia GPU as a Service Market Analysis, Insights and Forecast, 2020-2032
- 9.1. Market Analysis, Insights and Forecast - by Application
- 9.1.1. Artificial Intelligence
- 9.1.2. High Performance Computing
- 9.1.3. Other Applications
- 9.2. Market Analysis, Insights and Forecast - by Enterprise Type
- 9.2.1. Small and Medium Enterprise
- 9.2.2. Large Enterprise
- 9.3. Market Analysis, Insights and Forecast - by End User
- 9.3.1. BFSI
- 9.3.2. Automotive
- 9.3.3. Healthcare
- 9.3.4. IT and Communication
- 9.3.5. Other End Users
- 9.1. Market Analysis, Insights and Forecast - by Application
- 10. Australia and New Zealand GPU as a Service Market Analysis, Insights and Forecast, 2020-2032
- 10.1. Market Analysis, Insights and Forecast - by Application
- 10.1.1. Artificial Intelligence
- 10.1.2. High Performance Computing
- 10.1.3. Other Applications
- 10.2. Market Analysis, Insights and Forecast - by Enterprise Type
- 10.2.1. Small and Medium Enterprise
- 10.2.2. Large Enterprise
- 10.3. Market Analysis, Insights and Forecast - by End User
- 10.3.1. BFSI
- 10.3.2. Automotive
- 10.3.3. Healthcare
- 10.3.4. IT and Communication
- 10.3.5. Other End Users
- 10.1. Market Analysis, Insights and Forecast - by Application
- 11. Middle East and Africa GPU as a Service Market Analysis, Insights and Forecast, 2020-2032
- 11.1. Market Analysis, Insights and Forecast - by Application
- 11.1.1. Artificial Intelligence
- 11.1.2. High Performance Computing
- 11.1.3. Other Applications
- 11.2. Market Analysis, Insights and Forecast - by Enterprise Type
- 11.2.1. Small and Medium Enterprise
- 11.2.2. Large Enterprise
- 11.3. Market Analysis, Insights and Forecast - by End User
- 11.3.1. BFSI
- 11.3.2. Automotive
- 11.3.3. Healthcare
- 11.3.4. IT and Communication
- 11.3.5. Other End Users
- 11.1. Market Analysis, Insights and Forecast - by Application
- 12. Latin America GPU as a Service Market Analysis, Insights and Forecast, 2020-2032
- 12.1. Market Analysis, Insights and Forecast - by Application
- 12.1.1. Artificial Intelligence
- 12.1.2. High Performance Computing
- 12.1.3. Other Applications
- 12.2. Market Analysis, Insights and Forecast - by Enterprise Type
- 12.2.1. Small and Medium Enterprise
- 12.2.2. Large Enterprise
- 12.3. Market Analysis, Insights and Forecast - by End User
- 12.3.1. BFSI
- 12.3.2. Automotive
- 12.3.3. Healthcare
- 12.3.4. IT and Communication
- 12.3.5. Other End Users
- 12.1. Market Analysis, Insights and Forecast - by Application
- 13. Competitive Analysis
- 13.1. Company Profiles
- 13.1.1 Amazon Web Services Inc
- 13.1.1.1. Company Overview
- 13.1.1.2. Products
- 13.1.1.3. Company Financials
- 13.1.1.4. SWOT Analysis
- 13.1.2 Microsoft Corporation
- 13.1.2.1. Company Overview
- 13.1.2.2. Products
- 13.1.2.3. Company Financials
- 13.1.2.4. SWOT Analysis
- 13.1.3 Nvidia DGX (Nvidia Corporation)
- 13.1.3.1. Company Overview
- 13.1.3.2. Products
- 13.1.3.3. Company Financials
- 13.1.3.4. SWOT Analysis
- 13.1.4 IBM Corporation
- 13.1.4.1. Company Overview
- 13.1.4.2. Products
- 13.1.4.3. Company Financials
- 13.1.4.4. SWOT Analysis
- 13.1.5 Oracle Systems Corporation
- 13.1.5.1. Company Overview
- 13.1.5.2. Products
- 13.1.5.3. Company Financials
- 13.1.5.4. SWOT Analysis
- 13.1.6 Alphabet Inc (Google)
- 13.1.6.1. Company Overview
- 13.1.6.2. Products
- 13.1.6.3. Company Financials
- 13.1.6.4. SWOT Analysis
- 13.1.7 Latitude sh
- 13.1.7.1. Company Overview
- 13.1.7.2. Products
- 13.1.7.3. Company Financials
- 13.1.7.4. SWOT Analysis
- 13.1.8 Seeweb
- 13.1.8.1. Company Overview
- 13.1.8.2. Products
- 13.1.8.3. Company Financials
- 13.1.8.4. SWOT Analysis
- 13.1.9 Alibaba cloud
- 13.1.9.1. Company Overview
- 13.1.9.2. Products
- 13.1.9.3. Company Financials
- 13.1.9.4. SWOT Analysis
- 13.1.10 Linode LLC
- 13.1.10.1. Company Overview
- 13.1.10.2. Products
- 13.1.10.3. Company Financials
- 13.1.10.4. SWOT Analysis
- 13.1.11 CoreWeave*List Not Exhaustive
- 13.1.11.1. Company Overview
- 13.1.11.2. Products
- 13.1.11.3. Company Financials
- 13.1.11.4. SWOT Analysis
- 13.1.1 Amazon Web Services Inc
- 13.2. Market Entropy
- 13.2.1 Company's Key Areas Served
- 13.2.2 Recent Developments
- 13.3. Company Market Share Analysis 2025
- 13.3.1 Top 5 Companies Market Share Analysis
- 13.3.2 Top 3 Companies Market Share Analysis
- 13.4. List of Potential Customers
- 14. Research Methodology
List of Figures
- Figure 1: Global GPU as a Service Market Revenue Breakdown (Million, %) by Region 2025 & 2033
- Figure 2: Global GPU as a Service Market Volume Breakdown (Billion, %) by Region 2025 & 2033
- Figure 3: North America GPU as a Service Market Revenue (Million), by Application 2025 & 2033
- Figure 4: North America GPU as a Service Market Volume (Billion), by Application 2025 & 2033
- Figure 5: North America GPU as a Service Market Revenue Share (%), by Application 2025 & 2033
- Figure 6: North America GPU as a Service Market Volume Share (%), by Application 2025 & 2033
- Figure 7: North America GPU as a Service Market Revenue (Million), by Enterprise Type 2025 & 2033
- Figure 8: North America GPU as a Service Market Volume (Billion), by Enterprise Type 2025 & 2033
- Figure 9: North America GPU as a Service Market Revenue Share (%), by Enterprise Type 2025 & 2033
- Figure 10: North America GPU as a Service Market Volume Share (%), by Enterprise Type 2025 & 2033
- Figure 11: North America GPU as a Service Market Revenue (Million), by End User 2025 & 2033
- Figure 12: North America GPU as a Service Market Volume (Billion), by End User 2025 & 2033
- Figure 13: North America GPU as a Service Market Revenue Share (%), by End User 2025 & 2033
- Figure 14: North America GPU as a Service Market Volume Share (%), by End User 2025 & 2033
- Figure 15: North America GPU as a Service Market Revenue (Million), by Country 2025 & 2033
- Figure 16: North America GPU as a Service Market Volume (Billion), by Country 2025 & 2033
- Figure 17: North America GPU as a Service Market Revenue Share (%), by Country 2025 & 2033
- Figure 18: North America GPU as a Service Market Volume Share (%), by Country 2025 & 2033
- Figure 19: Europe GPU as a Service Market Revenue (Million), by Application 2025 & 2033
- Figure 20: Europe GPU as a Service Market Volume (Billion), by Application 2025 & 2033
- Figure 21: Europe GPU as a Service Market Revenue Share (%), by Application 2025 & 2033
- Figure 22: Europe GPU as a Service Market Volume Share (%), by Application 2025 & 2033
- Figure 23: Europe GPU as a Service Market Revenue (Million), by Enterprise Type 2025 & 2033
- Figure 24: Europe GPU as a Service Market Volume (Billion), by Enterprise Type 2025 & 2033
- Figure 25: Europe GPU as a Service Market Revenue Share (%), by Enterprise Type 2025 & 2033
- Figure 26: Europe GPU as a Service Market Volume Share (%), by Enterprise Type 2025 & 2033
- Figure 27: Europe GPU as a Service Market Revenue (Million), by End User 2025 & 2033
- Figure 28: Europe GPU as a Service Market Volume (Billion), by End User 2025 & 2033
- Figure 29: Europe GPU as a Service Market Revenue Share (%), by End User 2025 & 2033
- Figure 30: Europe GPU as a Service Market Volume Share (%), by End User 2025 & 2033
- Figure 31: Europe GPU as a Service Market Revenue (Million), by Country 2025 & 2033
- Figure 32: Europe GPU as a Service Market Volume (Billion), by Country 2025 & 2033
- Figure 33: Europe GPU as a Service Market Revenue Share (%), by Country 2025 & 2033
- Figure 34: Europe GPU as a Service Market Volume Share (%), by Country 2025 & 2033
- Figure 35: Asia GPU as a Service Market Revenue (Million), by Application 2025 & 2033
- Figure 36: Asia GPU as a Service Market Volume (Billion), by Application 2025 & 2033
- Figure 37: Asia GPU as a Service Market Revenue Share (%), by Application 2025 & 2033
- Figure 38: Asia GPU as a Service Market Volume Share (%), by Application 2025 & 2033
- Figure 39: Asia GPU as a Service Market Revenue (Million), by Enterprise Type 2025 & 2033
- Figure 40: Asia GPU as a Service Market Volume (Billion), by Enterprise Type 2025 & 2033
- Figure 41: Asia GPU as a Service Market Revenue Share (%), by Enterprise Type 2025 & 2033
- Figure 42: Asia GPU as a Service Market Volume Share (%), by Enterprise Type 2025 & 2033
- Figure 43: Asia GPU as a Service Market Revenue (Million), by End User 2025 & 2033
- Figure 44: Asia GPU as a Service Market Volume (Billion), by End User 2025 & 2033
- Figure 45: Asia GPU as a Service Market Revenue Share (%), by End User 2025 & 2033
- Figure 46: Asia GPU as a Service Market Volume Share (%), by End User 2025 & 2033
- Figure 47: Asia GPU as a Service Market Revenue (Million), by Country 2025 & 2033
- Figure 48: Asia GPU as a Service Market Volume (Billion), by Country 2025 & 2033
- Figure 49: Asia GPU as a Service Market Revenue Share (%), by Country 2025 & 2033
- Figure 50: Asia GPU as a Service Market Volume Share (%), by Country 2025 & 2033
- Figure 51: Australia and New Zealand GPU as a Service Market Revenue (Million), by Application 2025 & 2033
- Figure 52: Australia and New Zealand GPU as a Service Market Volume (Billion), by Application 2025 & 2033
- Figure 53: Australia and New Zealand GPU as a Service Market Revenue Share (%), by Application 2025 & 2033
- Figure 54: Australia and New Zealand GPU as a Service Market Volume Share (%), by Application 2025 & 2033
- Figure 55: Australia and New Zealand GPU as a Service Market Revenue (Million), by Enterprise Type 2025 & 2033
- Figure 56: Australia and New Zealand GPU as a Service Market Volume (Billion), by Enterprise Type 2025 & 2033
- Figure 57: Australia and New Zealand GPU as a Service Market Revenue Share (%), by Enterprise Type 2025 & 2033
- Figure 58: Australia and New Zealand GPU as a Service Market Volume Share (%), by Enterprise Type 2025 & 2033
- Figure 59: Australia and New Zealand GPU as a Service Market Revenue (Million), by End User 2025 & 2033
- Figure 60: Australia and New Zealand GPU as a Service Market Volume (Billion), by End User 2025 & 2033
- Figure 61: Australia and New Zealand GPU as a Service Market Revenue Share (%), by End User 2025 & 2033
- Figure 62: Australia and New Zealand GPU as a Service Market Volume Share (%), by End User 2025 & 2033
- Figure 63: Australia and New Zealand GPU as a Service Market Revenue (Million), by Country 2025 & 2033
- Figure 64: Australia and New Zealand GPU as a Service Market Volume (Billion), by Country 2025 & 2033
- Figure 65: Australia and New Zealand GPU as a Service Market Revenue Share (%), by Country 2025 & 2033
- Figure 66: Australia and New Zealand GPU as a Service Market Volume Share (%), by Country 2025 & 2033
- Figure 67: Middle East and Africa GPU as a Service Market Revenue (Million), by Application 2025 & 2033
- Figure 68: Middle East and Africa GPU as a Service Market Volume (Billion), by Application 2025 & 2033
- Figure 69: Middle East and Africa GPU as a Service Market Revenue Share (%), by Application 2025 & 2033
- Figure 70: Middle East and Africa GPU as a Service Market Volume Share (%), by Application 2025 & 2033
- Figure 71: Middle East and Africa GPU as a Service Market Revenue (Million), by Enterprise Type 2025 & 2033
- Figure 72: Middle East and Africa GPU as a Service Market Volume (Billion), by Enterprise Type 2025 & 2033
- Figure 73: Middle East and Africa GPU as a Service Market Revenue Share (%), by Enterprise Type 2025 & 2033
- Figure 74: Middle East and Africa GPU as a Service Market Volume Share (%), by Enterprise Type 2025 & 2033
- Figure 75: Middle East and Africa GPU as a Service Market Revenue (Million), by End User 2025 & 2033
- Figure 76: Middle East and Africa GPU as a Service Market Volume (Billion), by End User 2025 & 2033
- Figure 77: Middle East and Africa GPU as a Service Market Revenue Share (%), by End User 2025 & 2033
- Figure 78: Middle East and Africa GPU as a Service Market Volume Share (%), by End User 2025 & 2033
- Figure 79: Middle East and Africa GPU as a Service Market Revenue (Million), by Country 2025 & 2033
- Figure 80: Middle East and Africa GPU as a Service Market Volume (Billion), by Country 2025 & 2033
- Figure 81: Middle East and Africa GPU as a Service Market Revenue Share (%), by Country 2025 & 2033
- Figure 82: Middle East and Africa GPU as a Service Market Volume Share (%), by Country 2025 & 2033
- Figure 83: Latin America GPU as a Service Market Revenue (Million), by Application 2025 & 2033
- Figure 84: Latin America GPU as a Service Market Volume (Billion), by Application 2025 & 2033
- Figure 85: Latin America GPU as a Service Market Revenue Share (%), by Application 2025 & 2033
- Figure 86: Latin America GPU as a Service Market Volume Share (%), by Application 2025 & 2033
- Figure 87: Latin America GPU as a Service Market Revenue (Million), by Enterprise Type 2025 & 2033
- Figure 88: Latin America GPU as a Service Market Volume (Billion), by Enterprise Type 2025 & 2033
- Figure 89: Latin America GPU as a Service Market Revenue Share (%), by Enterprise Type 2025 & 2033
- Figure 90: Latin America GPU as a Service Market Volume Share (%), by Enterprise Type 2025 & 2033
- Figure 91: Latin America GPU as a Service Market Revenue (Million), by End User 2025 & 2033
- Figure 92: Latin America GPU as a Service Market Volume (Billion), by End User 2025 & 2033
- Figure 93: Latin America GPU as a Service Market Revenue Share (%), by End User 2025 & 2033
- Figure 94: Latin America GPU as a Service Market Volume Share (%), by End User 2025 & 2033
- Figure 95: Latin America GPU as a Service Market Revenue (Million), by Country 2025 & 2033
- Figure 96: Latin America GPU as a Service Market Volume (Billion), by Country 2025 & 2033
- Figure 97: Latin America GPU as a Service Market Revenue Share (%), by Country 2025 & 2033
- Figure 98: Latin America GPU as a Service Market Volume Share (%), by Country 2025 & 2033
List of Tables
- Table 1: Global GPU as a Service Market Revenue Million Forecast, by Application 2020 & 2033
- Table 2: Global GPU as a Service Market Volume Billion Forecast, by Application 2020 & 2033
- Table 3: Global GPU as a Service Market Revenue Million Forecast, by Enterprise Type 2020 & 2033
- Table 4: Global GPU as a Service Market Volume Billion Forecast, by Enterprise Type 2020 & 2033
- Table 5: Global GPU as a Service Market Revenue Million Forecast, by End User 2020 & 2033
- Table 6: Global GPU as a Service Market Volume Billion Forecast, by End User 2020 & 2033
- Table 7: Global GPU as a Service Market Revenue Million Forecast, by Region 2020 & 2033
- Table 8: Global GPU as a Service Market Volume Billion Forecast, by Region 2020 & 2033
- Table 9: Global GPU as a Service Market Revenue Million Forecast, by Application 2020 & 2033
- Table 10: Global GPU as a Service Market Volume Billion Forecast, by Application 2020 & 2033
- Table 11: Global GPU as a Service Market Revenue Million Forecast, by Enterprise Type 2020 & 2033
- Table 12: Global GPU as a Service Market Volume Billion Forecast, by Enterprise Type 2020 & 2033
- Table 13: Global GPU as a Service Market Revenue Million Forecast, by End User 2020 & 2033
- Table 14: Global GPU as a Service Market Volume Billion Forecast, by End User 2020 & 2033
- Table 15: Global GPU as a Service Market Revenue Million Forecast, by Country 2020 & 2033
- Table 16: Global GPU as a Service Market Volume Billion Forecast, by Country 2020 & 2033
- Table 17: Global GPU as a Service Market Revenue Million Forecast, by Application 2020 & 2033
- Table 18: Global GPU as a Service Market Volume Billion Forecast, by Application 2020 & 2033
- Table 19: Global GPU as a Service Market Revenue Million Forecast, by Enterprise Type 2020 & 2033
- Table 20: Global GPU as a Service Market Volume Billion Forecast, by Enterprise Type 2020 & 2033
- Table 21: Global GPU as a Service Market Revenue Million Forecast, by End User 2020 & 2033
- Table 22: Global GPU as a Service Market Volume Billion Forecast, by End User 2020 & 2033
- Table 23: Global GPU as a Service Market Revenue Million Forecast, by Country 2020 & 2033
- Table 24: Global GPU as a Service Market Volume Billion Forecast, by Country 2020 & 2033
- Table 25: Global GPU as a Service Market Revenue Million Forecast, by Application 2020 & 2033
- Table 26: Global GPU as a Service Market Volume Billion Forecast, by Application 2020 & 2033
- Table 27: Global GPU as a Service Market Revenue Million Forecast, by Enterprise Type 2020 & 2033
- Table 28: Global GPU as a Service Market Volume Billion Forecast, by Enterprise Type 2020 & 2033
- Table 29: Global GPU as a Service Market Revenue Million Forecast, by End User 2020 & 2033
- Table 30: Global GPU as a Service Market Volume Billion Forecast, by End User 2020 & 2033
- Table 31: Global GPU as a Service Market Revenue Million Forecast, by Country 2020 & 2033
- Table 32: Global GPU as a Service Market Volume Billion Forecast, by Country 2020 & 2033
- Table 33: Global GPU as a Service Market Revenue Million Forecast, by Application 2020 & 2033
- Table 34: Global GPU as a Service Market Volume Billion Forecast, by Application 2020 & 2033
- Table 35: Global GPU as a Service Market Revenue Million Forecast, by Enterprise Type 2020 & 2033
- Table 36: Global GPU as a Service Market Volume Billion Forecast, by Enterprise Type 2020 & 2033
- Table 37: Global GPU as a Service Market Revenue Million Forecast, by End User 2020 & 2033
- Table 38: Global GPU as a Service Market Volume Billion Forecast, by End User 2020 & 2033
- Table 39: Global GPU as a Service Market Revenue Million Forecast, by Country 2020 & 2033
- Table 40: Global GPU as a Service Market Volume Billion Forecast, by Country 2020 & 2033
- Table 41: Global GPU as a Service Market Revenue Million Forecast, by Application 2020 & 2033
- Table 42: Global GPU as a Service Market Volume Billion Forecast, by Application 2020 & 2033
- Table 43: Global GPU as a Service Market Revenue Million Forecast, by Enterprise Type 2020 & 2033
- Table 44: Global GPU as a Service Market Volume Billion Forecast, by Enterprise Type 2020 & 2033
- Table 45: Global GPU as a Service Market Revenue Million Forecast, by End User 2020 & 2033
- Table 46: Global GPU as a Service Market Volume Billion Forecast, by End User 2020 & 2033
- Table 47: Global GPU as a Service Market Revenue Million Forecast, by Country 2020 & 2033
- Table 48: Global GPU as a Service Market Volume Billion Forecast, by Country 2020 & 2033
- Table 49: Global GPU as a Service Market Revenue Million Forecast, by Application 2020 & 2033
- Table 50: Global GPU as a Service Market Volume Billion Forecast, by Application 2020 & 2033
- Table 51: Global GPU as a Service Market Revenue Million Forecast, by Enterprise Type 2020 & 2033
- Table 52: Global GPU as a Service Market Volume Billion Forecast, by Enterprise Type 2020 & 2033
- Table 53: Global GPU as a Service Market Revenue Million Forecast, by End User 2020 & 2033
- Table 54: Global GPU as a Service Market Volume Billion Forecast, by End User 2020 & 2033
- Table 55: Global GPU as a Service Market Revenue Million Forecast, by Country 2020 & 2033
- Table 56: Global GPU as a Service Market Volume Billion Forecast, by Country 2020 & 2033
Frequently Asked Questions
1. What is the projected Compound Annual Growth Rate (CAGR) of the GPU as a Service Market?
The projected CAGR is approximately 29.20%.
2. Which companies are prominent players in the GPU as a Service Market?
Key companies in the market include Amazon Web Services Inc, Microsoft Corporation, Nvidia DGX (Nvidia Corporation), IBM Corporation, Oracle Systems Corporation, Alphabet Inc (Google), Latitude sh, Seeweb, Alibaba cloud, Linode LLC, CoreWeave*List Not Exhaustive.
3. What are the main segments of the GPU as a Service Market?
The market segments include Application, Enterprise Type, End User.
4. Can you provide details about the market size?
The market size is estimated to be USD 5.05 Million as of 2022.
5. What are some drivers contributing to market growth?
Rising Usage of Generative AI and LLM Models Across Enterprises; Growing Applications of AR. VR. and AI.
6. What are the notable trends driving market growth?
Automotive is Expected to Witness Remarkable Growth During Forecast Period.
7. Are there any restraints impacting market growth?
Rising Usage of Generative AI and LLM Models Across Enterprises; Growing Applications of AR. VR. and AI.
8. Can you provide examples of recent developments in the market?
May 2024: Krutrim, an AI startup by Ola, launched a GPU as a Service, which enables developers and enterprises to train and tune their AI models at competitive prices.November 2023: Microsoft Corporation announced the addition of a new NVIDIA H200 Tensor core GPU as a Service on Azure, which will be available in Q2 2024. The new service aims to support larger model inferencing with no growth in latency. This new service is expected to boost AI workloads such as LLMs and generative AI models.
9. What pricing options are available for accessing the report?
Pricing options include single-user, multi-user, and enterprise licenses priced at USD 4750, USD 5250, and USD 8750 respectively.
10. Is the market size provided in terms of value or volume?
The market size is provided in terms of value, measured in Million and volume, measured in Billion.
11. Are there any specific market keywords associated with the report?
Yes, the market keyword associated with the report is "GPU as a Service Market," which aids in identifying and referencing the specific market segment covered.
12. How do I determine which pricing option suits my needs best?
The pricing options vary based on user requirements and access needs. Individual users may opt for single-user licenses, while businesses requiring broader access may choose multi-user or enterprise licenses for cost-effective access to the report.
13. Are there any additional resources or data provided in the GPU as a Service Market report?
While the report offers comprehensive insights, it's advisable to review the specific contents or supplementary materials provided to ascertain if additional resources or data are available.
14. How can I stay updated on further developments or reports in the GPU as a Service Market?
To stay informed about further developments, trends, and reports in the GPU as a Service Market, consider subscribing to industry newsletters, following relevant companies and organizations, or regularly checking reputable industry news sources and publications.
Methodology
Step 1 - Identification of Relevant Samples Size from Population Database


Step 2 - Approaches for Defining Global Market Size (Value, Volume* & Price*)

Note*: In applicable scenarios
Step 3 - Data Sources
Primary Research
- Web Analytics
- Survey Reports
- Research Institute
- Latest Research Reports
- Opinion Leaders
Secondary Research
- Annual Reports
- White Paper
- Latest Press Release
- Industry Association
- Paid Database
- Investor Presentations

Step 4 - Data Triangulation
Involves using different sources of information in order to increase the validity of a study
These sources are likely to be stakeholders in a program - participants, other researchers, program staff, other community members, and so on.
Then we put all data in single framework & apply various statistical tools to find out the dynamic on the market.
During the analysis stage, feedback from the stakeholder groups would be compared to determine areas of agreement as well as areas of divergence

