
Key Insights
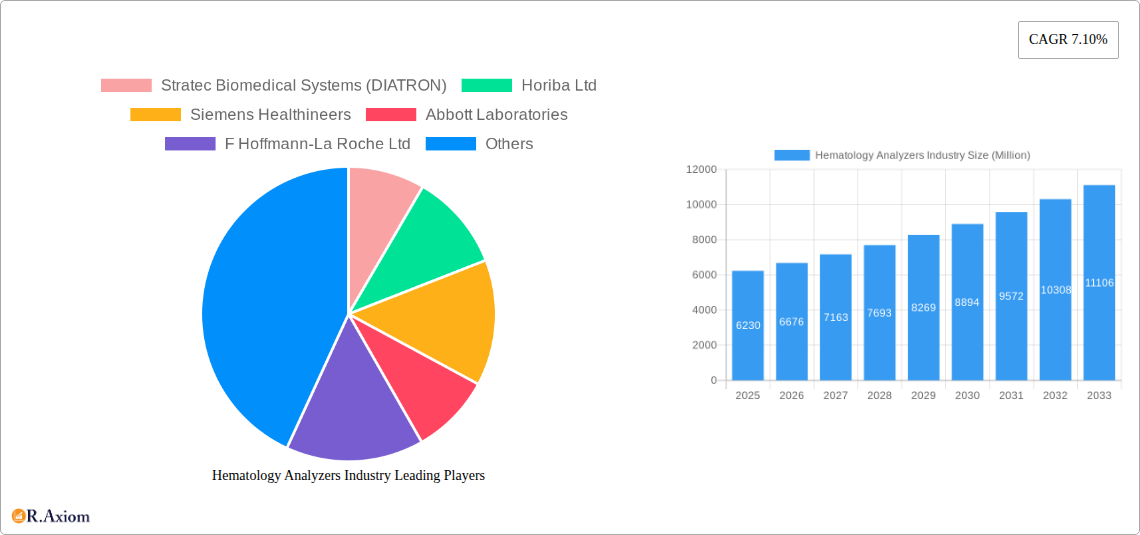
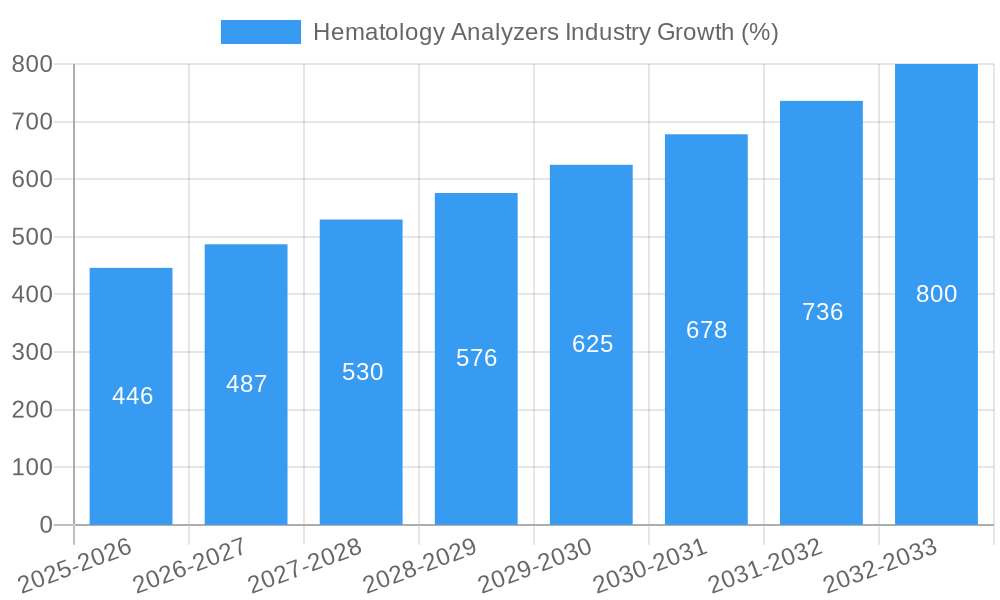
The global hematology analyzers market, valued at $6.23 billion in 2025, is projected to experience robust growth, driven by a compound annual growth rate (CAGR) of 7.10% from 2025 to 2033. This expansion is fueled by several key factors. Technological advancements leading to the development of sophisticated, automated analyzers with improved accuracy and speed are significantly impacting market growth. The increasing prevalence of blood-related disorders, such as leukemia, anemia, and other hematological malignancies, necessitates wider adoption of these analyzers in hospitals, clinical laboratories, and research institutions. Furthermore, the rising geriatric population, a demographic more susceptible to blood-related diseases, contributes to increased demand. The market is also witnessing a shift towards point-of-care testing (POCT) devices, enabling faster diagnosis and treatment in various settings. This trend is complemented by the growing adoption of integrated laboratory information systems (LIS) for efficient data management and workflow optimization. However, the high cost of advanced hematology analyzers and the need for skilled personnel to operate and maintain them pose potential restraints to market expansion, particularly in resource-limited settings. Nevertheless, the overall market outlook remains positive, with considerable growth opportunities across diverse segments, including reagent and service provision.
The competitive landscape is characterized by the presence of several major players, such as Stratec Biomedical Systems, Horiba Ltd., Siemens Healthineers, and Abbott Laboratories, each contributing to the market's innovation and expansion. Regional variations in market penetration exist, with North America and Europe currently holding substantial market shares due to advanced healthcare infrastructure and high adoption rates. However, the Asia-Pacific region is projected to witness significant growth in the coming years driven by rising healthcare expenditure, improving diagnostic capabilities, and expanding healthcare infrastructure. The market segmentation, categorized by product type (instruments, reagents, services) and end-user (hospitals, clinical laboratories, research institutes), reveals opportunities for specialized solutions tailored to meet specific needs. The continuous technological advancements and the growing need for accurate and timely hematological diagnostics are key drivers behind the consistent expansion of this vital sector of the healthcare industry.
This comprehensive report provides an in-depth analysis of the global hematology analyzers industry, covering market size, segmentation, growth drivers, challenges, and key players. The study period spans from 2019 to 2033, with 2025 serving as the base and estimated year. The report offers actionable insights for industry stakeholders, including manufacturers, distributors, and investors. The market is expected to reach xx Million by 2033, exhibiting a CAGR of xx% during the forecast period (2025-2033).
Hematology Analyzers Industry Market Concentration & Innovation
The hematology analyzers market is moderately concentrated, with several key players holding significant market share. While precise market share figures vary by segment and region, companies like Sysmex Corporation, Siemens Healthineers, and Abbott Laboratories consistently rank among the top contenders globally. These companies benefit from established brand recognition, extensive distribution networks, and continuous investment in R&D. Smaller players, including Stratec Biomedical Systems (DIATRON), Horiba Ltd, and Boule Diagnostics AB, often focus on niche segments or specialized technologies to compete effectively.
Market concentration is influenced by factors such as economies of scale, technological advancements, and regulatory hurdles. Innovation is a primary driver, with companies continuously developing advanced analyzers that offer improved accuracy, speed, and automation. This includes incorporating artificial intelligence (AI) and machine learning for enhanced data analysis and diagnostic capabilities. Stringent regulatory frameworks, primarily dictated by agencies like the FDA and EMA, influence product development and market entry. Substitutes are limited, mostly confined to manual methods which are less efficient. Consolidation through mergers and acquisitions (M&A) is observed, with deals in recent years totaling an estimated xx Million. Examples include:
- Strategic Alliances: Partnerships between analyzer manufacturers and reagent suppliers to enhance product offerings and market reach.
- Acquisitions: Acquisition of smaller companies with specialized technologies or geographical reach by larger players.
End-user trends towards greater automation and efficiency are driving demand for high-throughput analyzers.
Hematology Analyzers Industry Industry Trends & Insights
The hematology analyzers market is experiencing robust growth fueled by several key factors. The rising prevalence of hematological disorders globally is a major driver, increasing the demand for accurate and timely diagnostic testing. Technological advancements, including the development of automated, high-throughput analyzers with improved analytical capabilities, are also contributing to market expansion. Furthermore, the increasing adoption of point-of-care testing (POCT) devices is creating new opportunities for growth, particularly in underserved regions.
Consumer preferences are shifting towards analyzers that offer faster turnaround times, reduced operating costs, and easy-to-use interfaces. The increasing integration of hematology analyzers into laboratory information systems (LIS) is improving workflow efficiency and data management. Competitive dynamics are intense, with companies focusing on product innovation, strategic partnerships, and geographic expansion to maintain a competitive edge. The market displays significant regional variations, with developed economies exhibiting higher adoption rates due to advanced healthcare infrastructure and higher diagnostic testing rates. The global hematology analyzers market is projected to reach xx Million by 2033, exhibiting a CAGR of xx% during the forecast period. Market penetration varies considerably depending on the region and type of analyzer, with developed regions showing higher penetration rates.
Dominant Markets & Segments in Hematology Analyzers Industry
The hospitals segment dominates the end-user landscape, driven by the high volume of hematological tests conducted in these settings. Clinical laboratories are another major segment, playing a crucial role in providing centralized testing services. Research institutes represent a smaller but significant market, utilizing advanced hematology analyzers for research and development purposes. The instrument segment commands the largest market share among product types, while the reagents segment exhibits robust growth potential due to its consumables nature.
- Key Drivers for Hospitals Segment Dominance:
- High volume of patient testing
- Well-established infrastructure
- Availability of skilled personnel
- Key Drivers for Reagents Segment Growth:
- Consumable nature of reagents
- Technological advancements leading to enhanced reagent performance
- Increasing demand for higher throughput testing
Geographically, North America and Europe currently hold significant market shares due to well-established healthcare systems and higher healthcare expenditure. However, emerging economies in Asia-Pacific are witnessing rapid growth fueled by rising healthcare spending, increasing awareness of hematological disorders, and expanding healthcare infrastructure.
Hematology Analyzers Industry Product Developments
Recent advancements in hematology analyzers include the integration of artificial intelligence (AI) for improved accuracy and automation, the development of miniaturized and portable devices for point-of-care testing, and the incorporation of multiplexing capabilities to perform a wider range of tests simultaneously. These innovations offer significant advantages, such as faster turnaround times, reduced operating costs, and improved diagnostic accuracy. The focus is on developing user-friendly systems that enhance workflow efficiency in clinical settings.
Report Scope & Segmentation Analysis
This report segments the hematology analyzers market by product type (instruments and reagents), end-user (hospitals, clinical laboratories, research institutes, and other end-users), and geography. The instruments segment includes automated and semi-automated analyzers with varying throughput capacities. The reagents segment encompasses a wide range of consumables used in hematology testing, including dyes, diluents, and controls. End-user segmentation reflects the diverse applications of hematology analyzers across various healthcare settings. The growth projections for each segment vary, with the instruments segment and hospital segment expected to dominate in terms of market size. Competitive dynamics also vary across segments, influenced by factors such as technological advancements, regulatory changes, and pricing strategies.
Key Drivers of Hematology Analyzers Industry Growth
Several factors are driving the growth of the hematology analyzers industry. Technological advancements, such as the development of more accurate, faster, and automated analyzers, are a key driver. The rising prevalence of chronic diseases, including various blood disorders, contributes significantly to increased demand for diagnostic testing. Favorable government regulations promoting healthcare infrastructure development in emerging economies also fuels growth. Lastly, the increasing adoption of point-of-care testing (POCT) is expanding market reach and accessibility.
Challenges in the Hematology Analyzers Industry Sector
The hematology analyzers industry faces challenges such as stringent regulatory requirements for new product approvals, increasing competition from both established and emerging players, and the need for continuous investment in research and development to maintain a competitive edge. Supply chain disruptions can also impact the availability of crucial components and reagents. These factors can negatively impact profitability and market growth. The overall impact of these challenges is estimated to reduce the market growth rate by approximately xx% during the forecast period.
Emerging Opportunities in Hematology Analyzers Industry
Emerging opportunities exist in the development of personalized medicine approaches for hematological disorders and the expansion of point-of-care testing (POCT) in remote and underserved areas. The integration of artificial intelligence (AI) and machine learning (ML) for enhanced data analysis and diagnostic capabilities also presents significant opportunities. Additionally, exploring new markets in developing economies holds vast potential for growth and expansion.
Leading Players in the Hematology Analyzers Industry Market
- Stratec Biomedical Systems (DIATRON)
- Horiba Ltd
- Siemens Healthineers
- Abbott Laboratories
- F Hoffmann-La Roche Ltd
- Ortho Clinical Diagnostics
- Boule Diagnostics AB
- Bio-Rad Laboratories
- Beckman Coulter Inc (Danaher Corporation)
- Sysmex Corporation
- Accurex Biomedical Pvt Ltd
- Nihon Kohden Corporation
Key Developments in Hematology Analyzers Industry Industry
- May 2022: Nihon Kohden India established a new hematology analyzer reagent factory, expanding its manufacturing capabilities and potentially reducing costs.
- March 2022: Mindray launched the BC-700 Series, a revolutionary hematology analyzer series that includes both complete blood count (CBC) and erythrocyte sedimentation rate (ESR) tests, enhancing its product portfolio and competitiveness.
Strategic Outlook for Hematology Analyzers Industry Market
The hematology analyzers market is poised for continued growth, driven by technological advancements, the rising prevalence of hematological disorders, and expanding healthcare infrastructure globally. Strategic investments in research and development, strategic partnerships, and expansion into emerging markets will be crucial for companies to capitalize on the market's future potential. The increasing demand for high-throughput, automated analyzers with enhanced diagnostic capabilities will continue to shape the industry landscape.
Hematology Analyzers Industry Segmentation
-
1. Product Type
-
1.1. Instruments
- 1.1.1. 3 Part Hematology Analyzer
- 1.1.2. 5 Part Hematology Analyzer
- 1.1.3. Point-of-care Testing Hematology Analyzers
- 1.1.4. Others
- 1.2. Reagents
- 1.3. Services
-
1.1. Instruments
-
2. End User
- 2.1. Hospitals
- 2.2. Clinical Laboratories
- 2.3. Research Institutes
- 2.4. Other End Users
Hematology Analyzers Industry Segmentation By Geography
-
1. North America
- 1.1. United States
- 1.2. Canada
- 1.3. Mexico
-
2. Europe
- 2.1. Germany
- 2.2. United Kingdom
- 2.3. France
- 2.4. Italy
- 2.5. Spain
- 2.6. Rest of Europe
-
3. Asia Pacific
- 3.1. China
- 3.2. Japan
- 3.3. India
- 3.4. Australia
- 3.5. South Korea
- 3.6. Rest of Asia Pacific
-
4. Middle East and Africa
- 4.1. GCC
- 4.2. South Africa
- 4.3. Rest of Middle East and Africa
-
5. South America
- 5.1. Brazil
- 5.2. Argentina
- 5.3. Rest of South America

Hematology Analyzers Industry REPORT HIGHLIGHTS
| Aspects | Details |
|---|---|
| Study Period | 2019-2033 |
| Base Year | 2024 |
| Estimated Year | 2025 |
| Forecast Period | 2025-2033 |
| Historical Period | 2019-2024 |
| Growth Rate | CAGR of 7.10% from 2019-2033 |
| Segmentation |
|
Table of Contents
- 1. Introduction
- 1.1. Research Scope
- 1.2. Market Segmentation
- 1.3. Research Methodology
- 1.4. Definitions and Assumptions
- 2. Executive Summary
- 2.1. Introduction
- 3. Market Dynamics
- 3.1. Introduction
- 3.2. Market Drivers
- 3.2.1. Rising Burden of Blood Disorders; Increasing Technological Advancements and Rising Adoption Rates of Automated Hematology Instruments
- 3.3. Market Restrains
- 3.3.1. High Cost of Hematology Analyzers; Time-consuming and Stringent Rregulatory Policies
- 3.4. Market Trends
- 3.4.1. 3 Part Hematology Analyzer is the Segment by Instruments Expected to Hold Significant Market Share Over the Forecast Period
- 4. Market Factor Analysis
- 4.1. Porters Five Forces
- 4.2. Supply/Value Chain
- 4.3. PESTEL analysis
- 4.4. Market Entropy
- 4.5. Patent/Trademark Analysis
- 5. Global Hematology Analyzers Industry Analysis, Insights and Forecast, 2019-2031
- 5.1. Market Analysis, Insights and Forecast - by Product Type
- 5.1.1. Instruments
- 5.1.1.1. 3 Part Hematology Analyzer
- 5.1.1.2. 5 Part Hematology Analyzer
- 5.1.1.3. Point-of-care Testing Hematology Analyzers
- 5.1.1.4. Others
- 5.1.2. Reagents
- 5.1.3. Services
- 5.1.1. Instruments
- 5.2. Market Analysis, Insights and Forecast - by End User
- 5.2.1. Hospitals
- 5.2.2. Clinical Laboratories
- 5.2.3. Research Institutes
- 5.2.4. Other End Users
- 5.3. Market Analysis, Insights and Forecast - by Region
- 5.3.1. North America
- 5.3.2. Europe
- 5.3.3. Asia Pacific
- 5.3.4. Middle East and Africa
- 5.3.5. South America
- 5.1. Market Analysis, Insights and Forecast - by Product Type
- 6. North America Hematology Analyzers Industry Analysis, Insights and Forecast, 2019-2031
- 6.1. Market Analysis, Insights and Forecast - by Product Type
- 6.1.1. Instruments
- 6.1.1.1. 3 Part Hematology Analyzer
- 6.1.1.2. 5 Part Hematology Analyzer
- 6.1.1.3. Point-of-care Testing Hematology Analyzers
- 6.1.1.4. Others
- 6.1.2. Reagents
- 6.1.3. Services
- 6.1.1. Instruments
- 6.2. Market Analysis, Insights and Forecast - by End User
- 6.2.1. Hospitals
- 6.2.2. Clinical Laboratories
- 6.2.3. Research Institutes
- 6.2.4. Other End Users
- 6.1. Market Analysis, Insights and Forecast - by Product Type
- 7. Europe Hematology Analyzers Industry Analysis, Insights and Forecast, 2019-2031
- 7.1. Market Analysis, Insights and Forecast - by Product Type
- 7.1.1. Instruments
- 7.1.1.1. 3 Part Hematology Analyzer
- 7.1.1.2. 5 Part Hematology Analyzer
- 7.1.1.3. Point-of-care Testing Hematology Analyzers
- 7.1.1.4. Others
- 7.1.2. Reagents
- 7.1.3. Services
- 7.1.1. Instruments
- 7.2. Market Analysis, Insights and Forecast - by End User
- 7.2.1. Hospitals
- 7.2.2. Clinical Laboratories
- 7.2.3. Research Institutes
- 7.2.4. Other End Users
- 7.1. Market Analysis, Insights and Forecast - by Product Type
- 8. Asia Pacific Hematology Analyzers Industry Analysis, Insights and Forecast, 2019-2031
- 8.1. Market Analysis, Insights and Forecast - by Product Type
- 8.1.1. Instruments
- 8.1.1.1. 3 Part Hematology Analyzer
- 8.1.1.2. 5 Part Hematology Analyzer
- 8.1.1.3. Point-of-care Testing Hematology Analyzers
- 8.1.1.4. Others
- 8.1.2. Reagents
- 8.1.3. Services
- 8.1.1. Instruments
- 8.2. Market Analysis, Insights and Forecast - by End User
- 8.2.1. Hospitals
- 8.2.2. Clinical Laboratories
- 8.2.3. Research Institutes
- 8.2.4. Other End Users
- 8.1. Market Analysis, Insights and Forecast - by Product Type
- 9. Middle East and Africa Hematology Analyzers Industry Analysis, Insights and Forecast, 2019-2031
- 9.1. Market Analysis, Insights and Forecast - by Product Type
- 9.1.1. Instruments
- 9.1.1.1. 3 Part Hematology Analyzer
- 9.1.1.2. 5 Part Hematology Analyzer
- 9.1.1.3. Point-of-care Testing Hematology Analyzers
- 9.1.1.4. Others
- 9.1.2. Reagents
- 9.1.3. Services
- 9.1.1. Instruments
- 9.2. Market Analysis, Insights and Forecast - by End User
- 9.2.1. Hospitals
- 9.2.2. Clinical Laboratories
- 9.2.3. Research Institutes
- 9.2.4. Other End Users
- 9.1. Market Analysis, Insights and Forecast - by Product Type
- 10. South America Hematology Analyzers Industry Analysis, Insights and Forecast, 2019-2031
- 10.1. Market Analysis, Insights and Forecast - by Product Type
- 10.1.1. Instruments
- 10.1.1.1. 3 Part Hematology Analyzer
- 10.1.1.2. 5 Part Hematology Analyzer
- 10.1.1.3. Point-of-care Testing Hematology Analyzers
- 10.1.1.4. Others
- 10.1.2. Reagents
- 10.1.3. Services
- 10.1.1. Instruments
- 10.2. Market Analysis, Insights and Forecast - by End User
- 10.2.1. Hospitals
- 10.2.2. Clinical Laboratories
- 10.2.3. Research Institutes
- 10.2.4. Other End Users
- 10.1. Market Analysis, Insights and Forecast - by Product Type
- 11. North America Hematology Analyzers Industry Analysis, Insights and Forecast, 2019-2031
- 11.1. Market Analysis, Insights and Forecast - By Country/Sub-region
- 11.1.1 United States
- 11.1.2 Canada
- 11.1.3 Mexico
- 12. South America Hematology Analyzers Industry Analysis, Insights and Forecast, 2019-2031
- 12.1. Market Analysis, Insights and Forecast - By Country/Sub-region
- 12.1.1 Brazil
- 12.1.2 Mexico
- 12.1.3 Rest of South America
- 13. Europe Hematology Analyzers Industry Analysis, Insights and Forecast, 2019-2031
- 13.1. Market Analysis, Insights and Forecast - By Country/Sub-region
- 13.1.1 United Kingdom
- 13.1.2 Germany
- 13.1.3 France
- 13.1.4 Italy
- 13.1.5 Spain
- 13.1.6 Russia
- 13.1.7 Rest of Europe
- 14. Asia Pacific Hematology Analyzers Industry Analysis, Insights and Forecast, 2019-2031
- 14.1. Market Analysis, Insights and Forecast - By Country/Sub-region
- 14.1.1 China
- 14.1.2 Japan
- 14.1.3 India
- 14.1.4 South Korea
- 14.1.5 Taiwan
- 14.1.6 Australia
- 14.1.7 Rest of Asia-Pacific
- 15. MEA Hematology Analyzers Industry Analysis, Insights and Forecast, 2019-2031
- 15.1. Market Analysis, Insights and Forecast - By Country/Sub-region
- 15.1.1 Middle East
- 15.1.2 Africa
- 16. Competitive Analysis
- 16.1. Global Market Share Analysis 2024
- 16.2. Company Profiles
- 16.2.1 Stratec Biomedical Systems (DIATRON)
- 16.2.1.1. Overview
- 16.2.1.2. Products
- 16.2.1.3. SWOT Analysis
- 16.2.1.4. Recent Developments
- 16.2.1.5. Financials (Based on Availability)
- 16.2.2 Horiba Ltd
- 16.2.2.1. Overview
- 16.2.2.2. Products
- 16.2.2.3. SWOT Analysis
- 16.2.2.4. Recent Developments
- 16.2.2.5. Financials (Based on Availability)
- 16.2.3 Siemens Healthineers
- 16.2.3.1. Overview
- 16.2.3.2. Products
- 16.2.3.3. SWOT Analysis
- 16.2.3.4. Recent Developments
- 16.2.3.5. Financials (Based on Availability)
- 16.2.4 Abbott Laboratories
- 16.2.4.1. Overview
- 16.2.4.2. Products
- 16.2.4.3. SWOT Analysis
- 16.2.4.4. Recent Developments
- 16.2.4.5. Financials (Based on Availability)
- 16.2.5 F Hoffmann-La Roche Ltd
- 16.2.5.1. Overview
- 16.2.5.2. Products
- 16.2.5.3. SWOT Analysis
- 16.2.5.4. Recent Developments
- 16.2.5.5. Financials (Based on Availability)
- 16.2.6 Ortho Clinical Diagnostics
- 16.2.6.1. Overview
- 16.2.6.2. Products
- 16.2.6.3. SWOT Analysis
- 16.2.6.4. Recent Developments
- 16.2.6.5. Financials (Based on Availability)
- 16.2.7 Boule Diagnostics AB
- 16.2.7.1. Overview
- 16.2.7.2. Products
- 16.2.7.3. SWOT Analysis
- 16.2.7.4. Recent Developments
- 16.2.7.5. Financials (Based on Availability)
- 16.2.8 Bio-Rad Laboratories
- 16.2.8.1. Overview
- 16.2.8.2. Products
- 16.2.8.3. SWOT Analysis
- 16.2.8.4. Recent Developments
- 16.2.8.5. Financials (Based on Availability)
- 16.2.9 Beckman Coulter Inc (Danaher Corporation)
- 16.2.9.1. Overview
- 16.2.9.2. Products
- 16.2.9.3. SWOT Analysis
- 16.2.9.4. Recent Developments
- 16.2.9.5. Financials (Based on Availability)
- 16.2.10 Sysmex Corporation
- 16.2.10.1. Overview
- 16.2.10.2. Products
- 16.2.10.3. SWOT Analysis
- 16.2.10.4. Recent Developments
- 16.2.10.5. Financials (Based on Availability)
- 16.2.11 Accurex Biomedical Pvt Ltd
- 16.2.11.1. Overview
- 16.2.11.2. Products
- 16.2.11.3. SWOT Analysis
- 16.2.11.4. Recent Developments
- 16.2.11.5. Financials (Based on Availability)
- 16.2.12 Nihon Kohden Corporation
- 16.2.12.1. Overview
- 16.2.12.2. Products
- 16.2.12.3. SWOT Analysis
- 16.2.12.4. Recent Developments
- 16.2.12.5. Financials (Based on Availability)
- 16.2.1 Stratec Biomedical Systems (DIATRON)
List of Figures
- Figure 1: Global Hematology Analyzers Industry Revenue Breakdown (Million, %) by Region 2024 & 2032
- Figure 2: Global Hematology Analyzers Industry Volume Breakdown (K Unit, %) by Region 2024 & 2032
- Figure 3: North America Hematology Analyzers Industry Revenue (Million), by Country 2024 & 2032
- Figure 4: North America Hematology Analyzers Industry Volume (K Unit), by Country 2024 & 2032
- Figure 5: North America Hematology Analyzers Industry Revenue Share (%), by Country 2024 & 2032
- Figure 6: North America Hematology Analyzers Industry Volume Share (%), by Country 2024 & 2032
- Figure 7: South America Hematology Analyzers Industry Revenue (Million), by Country 2024 & 2032
- Figure 8: South America Hematology Analyzers Industry Volume (K Unit), by Country 2024 & 2032
- Figure 9: South America Hematology Analyzers Industry Revenue Share (%), by Country 2024 & 2032
- Figure 10: South America Hematology Analyzers Industry Volume Share (%), by Country 2024 & 2032
- Figure 11: Europe Hematology Analyzers Industry Revenue (Million), by Country 2024 & 2032
- Figure 12: Europe Hematology Analyzers Industry Volume (K Unit), by Country 2024 & 2032
- Figure 13: Europe Hematology Analyzers Industry Revenue Share (%), by Country 2024 & 2032
- Figure 14: Europe Hematology Analyzers Industry Volume Share (%), by Country 2024 & 2032
- Figure 15: Asia Pacific Hematology Analyzers Industry Revenue (Million), by Country 2024 & 2032
- Figure 16: Asia Pacific Hematology Analyzers Industry Volume (K Unit), by Country 2024 & 2032
- Figure 17: Asia Pacific Hematology Analyzers Industry Revenue Share (%), by Country 2024 & 2032
- Figure 18: Asia Pacific Hematology Analyzers Industry Volume Share (%), by Country 2024 & 2032
- Figure 19: MEA Hematology Analyzers Industry Revenue (Million), by Country 2024 & 2032
- Figure 20: MEA Hematology Analyzers Industry Volume (K Unit), by Country 2024 & 2032
- Figure 21: MEA Hematology Analyzers Industry Revenue Share (%), by Country 2024 & 2032
- Figure 22: MEA Hematology Analyzers Industry Volume Share (%), by Country 2024 & 2032
- Figure 23: North America Hematology Analyzers Industry Revenue (Million), by Product Type 2024 & 2032
- Figure 24: North America Hematology Analyzers Industry Volume (K Unit), by Product Type 2024 & 2032
- Figure 25: North America Hematology Analyzers Industry Revenue Share (%), by Product Type 2024 & 2032
- Figure 26: North America Hematology Analyzers Industry Volume Share (%), by Product Type 2024 & 2032
- Figure 27: North America Hematology Analyzers Industry Revenue (Million), by End User 2024 & 2032
- Figure 28: North America Hematology Analyzers Industry Volume (K Unit), by End User 2024 & 2032
- Figure 29: North America Hematology Analyzers Industry Revenue Share (%), by End User 2024 & 2032
- Figure 30: North America Hematology Analyzers Industry Volume Share (%), by End User 2024 & 2032
- Figure 31: North America Hematology Analyzers Industry Revenue (Million), by Country 2024 & 2032
- Figure 32: North America Hematology Analyzers Industry Volume (K Unit), by Country 2024 & 2032
- Figure 33: North America Hematology Analyzers Industry Revenue Share (%), by Country 2024 & 2032
- Figure 34: North America Hematology Analyzers Industry Volume Share (%), by Country 2024 & 2032
- Figure 35: Europe Hematology Analyzers Industry Revenue (Million), by Product Type 2024 & 2032
- Figure 36: Europe Hematology Analyzers Industry Volume (K Unit), by Product Type 2024 & 2032
- Figure 37: Europe Hematology Analyzers Industry Revenue Share (%), by Product Type 2024 & 2032
- Figure 38: Europe Hematology Analyzers Industry Volume Share (%), by Product Type 2024 & 2032
- Figure 39: Europe Hematology Analyzers Industry Revenue (Million), by End User 2024 & 2032
- Figure 40: Europe Hematology Analyzers Industry Volume (K Unit), by End User 2024 & 2032
- Figure 41: Europe Hematology Analyzers Industry Revenue Share (%), by End User 2024 & 2032
- Figure 42: Europe Hematology Analyzers Industry Volume Share (%), by End User 2024 & 2032
- Figure 43: Europe Hematology Analyzers Industry Revenue (Million), by Country 2024 & 2032
- Figure 44: Europe Hematology Analyzers Industry Volume (K Unit), by Country 2024 & 2032
- Figure 45: Europe Hematology Analyzers Industry Revenue Share (%), by Country 2024 & 2032
- Figure 46: Europe Hematology Analyzers Industry Volume Share (%), by Country 2024 & 2032
- Figure 47: Asia Pacific Hematology Analyzers Industry Revenue (Million), by Product Type 2024 & 2032
- Figure 48: Asia Pacific Hematology Analyzers Industry Volume (K Unit), by Product Type 2024 & 2032
- Figure 49: Asia Pacific Hematology Analyzers Industry Revenue Share (%), by Product Type 2024 & 2032
- Figure 50: Asia Pacific Hematology Analyzers Industry Volume Share (%), by Product Type 2024 & 2032
- Figure 51: Asia Pacific Hematology Analyzers Industry Revenue (Million), by End User 2024 & 2032
- Figure 52: Asia Pacific Hematology Analyzers Industry Volume (K Unit), by End User 2024 & 2032
- Figure 53: Asia Pacific Hematology Analyzers Industry Revenue Share (%), by End User 2024 & 2032
- Figure 54: Asia Pacific Hematology Analyzers Industry Volume Share (%), by End User 2024 & 2032
- Figure 55: Asia Pacific Hematology Analyzers Industry Revenue (Million), by Country 2024 & 2032
- Figure 56: Asia Pacific Hematology Analyzers Industry Volume (K Unit), by Country 2024 & 2032
- Figure 57: Asia Pacific Hematology Analyzers Industry Revenue Share (%), by Country 2024 & 2032
- Figure 58: Asia Pacific Hematology Analyzers Industry Volume Share (%), by Country 2024 & 2032
- Figure 59: Middle East and Africa Hematology Analyzers Industry Revenue (Million), by Product Type 2024 & 2032
- Figure 60: Middle East and Africa Hematology Analyzers Industry Volume (K Unit), by Product Type 2024 & 2032
- Figure 61: Middle East and Africa Hematology Analyzers Industry Revenue Share (%), by Product Type 2024 & 2032
- Figure 62: Middle East and Africa Hematology Analyzers Industry Volume Share (%), by Product Type 2024 & 2032
- Figure 63: Middle East and Africa Hematology Analyzers Industry Revenue (Million), by End User 2024 & 2032
- Figure 64: Middle East and Africa Hematology Analyzers Industry Volume (K Unit), by End User 2024 & 2032
- Figure 65: Middle East and Africa Hematology Analyzers Industry Revenue Share (%), by End User 2024 & 2032
- Figure 66: Middle East and Africa Hematology Analyzers Industry Volume Share (%), by End User 2024 & 2032
- Figure 67: Middle East and Africa Hematology Analyzers Industry Revenue (Million), by Country 2024 & 2032
- Figure 68: Middle East and Africa Hematology Analyzers Industry Volume (K Unit), by Country 2024 & 2032
- Figure 69: Middle East and Africa Hematology Analyzers Industry Revenue Share (%), by Country 2024 & 2032
- Figure 70: Middle East and Africa Hematology Analyzers Industry Volume Share (%), by Country 2024 & 2032
- Figure 71: South America Hematology Analyzers Industry Revenue (Million), by Product Type 2024 & 2032
- Figure 72: South America Hematology Analyzers Industry Volume (K Unit), by Product Type 2024 & 2032
- Figure 73: South America Hematology Analyzers Industry Revenue Share (%), by Product Type 2024 & 2032
- Figure 74: South America Hematology Analyzers Industry Volume Share (%), by Product Type 2024 & 2032
- Figure 75: South America Hematology Analyzers Industry Revenue (Million), by End User 2024 & 2032
- Figure 76: South America Hematology Analyzers Industry Volume (K Unit), by End User 2024 & 2032
- Figure 77: South America Hematology Analyzers Industry Revenue Share (%), by End User 2024 & 2032
- Figure 78: South America Hematology Analyzers Industry Volume Share (%), by End User 2024 & 2032
- Figure 79: South America Hematology Analyzers Industry Revenue (Million), by Country 2024 & 2032
- Figure 80: South America Hematology Analyzers Industry Volume (K Unit), by Country 2024 & 2032
- Figure 81: South America Hematology Analyzers Industry Revenue Share (%), by Country 2024 & 2032
- Figure 82: South America Hematology Analyzers Industry Volume Share (%), by Country 2024 & 2032
List of Tables
- Table 1: Global Hematology Analyzers Industry Revenue Million Forecast, by Region 2019 & 2032
- Table 2: Global Hematology Analyzers Industry Volume K Unit Forecast, by Region 2019 & 2032
- Table 3: Global Hematology Analyzers Industry Revenue Million Forecast, by Product Type 2019 & 2032
- Table 4: Global Hematology Analyzers Industry Volume K Unit Forecast, by Product Type 2019 & 2032
- Table 5: Global Hematology Analyzers Industry Revenue Million Forecast, by End User 2019 & 2032
- Table 6: Global Hematology Analyzers Industry Volume K Unit Forecast, by End User 2019 & 2032
- Table 7: Global Hematology Analyzers Industry Revenue Million Forecast, by Region 2019 & 2032
- Table 8: Global Hematology Analyzers Industry Volume K Unit Forecast, by Region 2019 & 2032
- Table 9: Global Hematology Analyzers Industry Revenue Million Forecast, by Country 2019 & 2032
- Table 10: Global Hematology Analyzers Industry Volume K Unit Forecast, by Country 2019 & 2032
- Table 11: United States Hematology Analyzers Industry Revenue (Million) Forecast, by Application 2019 & 2032
- Table 12: United States Hematology Analyzers Industry Volume (K Unit) Forecast, by Application 2019 & 2032
- Table 13: Canada Hematology Analyzers Industry Revenue (Million) Forecast, by Application 2019 & 2032
- Table 14: Canada Hematology Analyzers Industry Volume (K Unit) Forecast, by Application 2019 & 2032
- Table 15: Mexico Hematology Analyzers Industry Revenue (Million) Forecast, by Application 2019 & 2032
- Table 16: Mexico Hematology Analyzers Industry Volume (K Unit) Forecast, by Application 2019 & 2032
- Table 17: Global Hematology Analyzers Industry Revenue Million Forecast, by Country 2019 & 2032
- Table 18: Global Hematology Analyzers Industry Volume K Unit Forecast, by Country 2019 & 2032
- Table 19: Brazil Hematology Analyzers Industry Revenue (Million) Forecast, by Application 2019 & 2032
- Table 20: Brazil Hematology Analyzers Industry Volume (K Unit) Forecast, by Application 2019 & 2032
- Table 21: Mexico Hematology Analyzers Industry Revenue (Million) Forecast, by Application 2019 & 2032
- Table 22: Mexico Hematology Analyzers Industry Volume (K Unit) Forecast, by Application 2019 & 2032
- Table 23: Rest of South America Hematology Analyzers Industry Revenue (Million) Forecast, by Application 2019 & 2032
- Table 24: Rest of South America Hematology Analyzers Industry Volume (K Unit) Forecast, by Application 2019 & 2032
- Table 25: Global Hematology Analyzers Industry Revenue Million Forecast, by Country 2019 & 2032
- Table 26: Global Hematology Analyzers Industry Volume K Unit Forecast, by Country 2019 & 2032
- Table 27: United Kingdom Hematology Analyzers Industry Revenue (Million) Forecast, by Application 2019 & 2032
- Table 28: United Kingdom Hematology Analyzers Industry Volume (K Unit) Forecast, by Application 2019 & 2032
- Table 29: Germany Hematology Analyzers Industry Revenue (Million) Forecast, by Application 2019 & 2032
- Table 30: Germany Hematology Analyzers Industry Volume (K Unit) Forecast, by Application 2019 & 2032
- Table 31: France Hematology Analyzers Industry Revenue (Million) Forecast, by Application 2019 & 2032
- Table 32: France Hematology Analyzers Industry Volume (K Unit) Forecast, by Application 2019 & 2032
- Table 33: Italy Hematology Analyzers Industry Revenue (Million) Forecast, by Application 2019 & 2032
- Table 34: Italy Hematology Analyzers Industry Volume (K Unit) Forecast, by Application 2019 & 2032
- Table 35: Spain Hematology Analyzers Industry Revenue (Million) Forecast, by Application 2019 & 2032
- Table 36: Spain Hematology Analyzers Industry Volume (K Unit) Forecast, by Application 2019 & 2032
- Table 37: Russia Hematology Analyzers Industry Revenue (Million) Forecast, by Application 2019 & 2032
- Table 38: Russia Hematology Analyzers Industry Volume (K Unit) Forecast, by Application 2019 & 2032
- Table 39: Rest of Europe Hematology Analyzers Industry Revenue (Million) Forecast, by Application 2019 & 2032
- Table 40: Rest of Europe Hematology Analyzers Industry Volume (K Unit) Forecast, by Application 2019 & 2032
- Table 41: Global Hematology Analyzers Industry Revenue Million Forecast, by Country 2019 & 2032
- Table 42: Global Hematology Analyzers Industry Volume K Unit Forecast, by Country 2019 & 2032
- Table 43: China Hematology Analyzers Industry Revenue (Million) Forecast, by Application 2019 & 2032
- Table 44: China Hematology Analyzers Industry Volume (K Unit) Forecast, by Application 2019 & 2032
- Table 45: Japan Hematology Analyzers Industry Revenue (Million) Forecast, by Application 2019 & 2032
- Table 46: Japan Hematology Analyzers Industry Volume (K Unit) Forecast, by Application 2019 & 2032
- Table 47: India Hematology Analyzers Industry Revenue (Million) Forecast, by Application 2019 & 2032
- Table 48: India Hematology Analyzers Industry Volume (K Unit) Forecast, by Application 2019 & 2032
- Table 49: South Korea Hematology Analyzers Industry Revenue (Million) Forecast, by Application 2019 & 2032
- Table 50: South Korea Hematology Analyzers Industry Volume (K Unit) Forecast, by Application 2019 & 2032
- Table 51: Taiwan Hematology Analyzers Industry Revenue (Million) Forecast, by Application 2019 & 2032
- Table 52: Taiwan Hematology Analyzers Industry Volume (K Unit) Forecast, by Application 2019 & 2032
- Table 53: Australia Hematology Analyzers Industry Revenue (Million) Forecast, by Application 2019 & 2032
- Table 54: Australia Hematology Analyzers Industry Volume (K Unit) Forecast, by Application 2019 & 2032
- Table 55: Rest of Asia-Pacific Hematology Analyzers Industry Revenue (Million) Forecast, by Application 2019 & 2032
- Table 56: Rest of Asia-Pacific Hematology Analyzers Industry Volume (K Unit) Forecast, by Application 2019 & 2032
- Table 57: Global Hematology Analyzers Industry Revenue Million Forecast, by Country 2019 & 2032
- Table 58: Global Hematology Analyzers Industry Volume K Unit Forecast, by Country 2019 & 2032
- Table 59: Middle East Hematology Analyzers Industry Revenue (Million) Forecast, by Application 2019 & 2032
- Table 60: Middle East Hematology Analyzers Industry Volume (K Unit) Forecast, by Application 2019 & 2032
- Table 61: Africa Hematology Analyzers Industry Revenue (Million) Forecast, by Application 2019 & 2032
- Table 62: Africa Hematology Analyzers Industry Volume (K Unit) Forecast, by Application 2019 & 2032
- Table 63: Global Hematology Analyzers Industry Revenue Million Forecast, by Product Type 2019 & 2032
- Table 64: Global Hematology Analyzers Industry Volume K Unit Forecast, by Product Type 2019 & 2032
- Table 65: Global Hematology Analyzers Industry Revenue Million Forecast, by End User 2019 & 2032
- Table 66: Global Hematology Analyzers Industry Volume K Unit Forecast, by End User 2019 & 2032
- Table 67: Global Hematology Analyzers Industry Revenue Million Forecast, by Country 2019 & 2032
- Table 68: Global Hematology Analyzers Industry Volume K Unit Forecast, by Country 2019 & 2032
- Table 69: United States Hematology Analyzers Industry Revenue (Million) Forecast, by Application 2019 & 2032
- Table 70: United States Hematology Analyzers Industry Volume (K Unit) Forecast, by Application 2019 & 2032
- Table 71: Canada Hematology Analyzers Industry Revenue (Million) Forecast, by Application 2019 & 2032
- Table 72: Canada Hematology Analyzers Industry Volume (K Unit) Forecast, by Application 2019 & 2032
- Table 73: Mexico Hematology Analyzers Industry Revenue (Million) Forecast, by Application 2019 & 2032
- Table 74: Mexico Hematology Analyzers Industry Volume (K Unit) Forecast, by Application 2019 & 2032
- Table 75: Global Hematology Analyzers Industry Revenue Million Forecast, by Product Type 2019 & 2032
- Table 76: Global Hematology Analyzers Industry Volume K Unit Forecast, by Product Type 2019 & 2032
- Table 77: Global Hematology Analyzers Industry Revenue Million Forecast, by End User 2019 & 2032
- Table 78: Global Hematology Analyzers Industry Volume K Unit Forecast, by End User 2019 & 2032
- Table 79: Global Hematology Analyzers Industry Revenue Million Forecast, by Country 2019 & 2032
- Table 80: Global Hematology Analyzers Industry Volume K Unit Forecast, by Country 2019 & 2032
- Table 81: Germany Hematology Analyzers Industry Revenue (Million) Forecast, by Application 2019 & 2032
- Table 82: Germany Hematology Analyzers Industry Volume (K Unit) Forecast, by Application 2019 & 2032
- Table 83: United Kingdom Hematology Analyzers Industry Revenue (Million) Forecast, by Application 2019 & 2032
- Table 84: United Kingdom Hematology Analyzers Industry Volume (K Unit) Forecast, by Application 2019 & 2032
- Table 85: France Hematology Analyzers Industry Revenue (Million) Forecast, by Application 2019 & 2032
- Table 86: France Hematology Analyzers Industry Volume (K Unit) Forecast, by Application 2019 & 2032
- Table 87: Italy Hematology Analyzers Industry Revenue (Million) Forecast, by Application 2019 & 2032
- Table 88: Italy Hematology Analyzers Industry Volume (K Unit) Forecast, by Application 2019 & 2032
- Table 89: Spain Hematology Analyzers Industry Revenue (Million) Forecast, by Application 2019 & 2032
- Table 90: Spain Hematology Analyzers Industry Volume (K Unit) Forecast, by Application 2019 & 2032
- Table 91: Rest of Europe Hematology Analyzers Industry Revenue (Million) Forecast, by Application 2019 & 2032
- Table 92: Rest of Europe Hematology Analyzers Industry Volume (K Unit) Forecast, by Application 2019 & 2032
- Table 93: Global Hematology Analyzers Industry Revenue Million Forecast, by Product Type 2019 & 2032
- Table 94: Global Hematology Analyzers Industry Volume K Unit Forecast, by Product Type 2019 & 2032
- Table 95: Global Hematology Analyzers Industry Revenue Million Forecast, by End User 2019 & 2032
- Table 96: Global Hematology Analyzers Industry Volume K Unit Forecast, by End User 2019 & 2032
- Table 97: Global Hematology Analyzers Industry Revenue Million Forecast, by Country 2019 & 2032
- Table 98: Global Hematology Analyzers Industry Volume K Unit Forecast, by Country 2019 & 2032
- Table 99: China Hematology Analyzers Industry Revenue (Million) Forecast, by Application 2019 & 2032
- Table 100: China Hematology Analyzers Industry Volume (K Unit) Forecast, by Application 2019 & 2032
- Table 101: Japan Hematology Analyzers Industry Revenue (Million) Forecast, by Application 2019 & 2032
- Table 102: Japan Hematology Analyzers Industry Volume (K Unit) Forecast, by Application 2019 & 2032
- Table 103: India Hematology Analyzers Industry Revenue (Million) Forecast, by Application 2019 & 2032
- Table 104: India Hematology Analyzers Industry Volume (K Unit) Forecast, by Application 2019 & 2032
- Table 105: Australia Hematology Analyzers Industry Revenue (Million) Forecast, by Application 2019 & 2032
- Table 106: Australia Hematology Analyzers Industry Volume (K Unit) Forecast, by Application 2019 & 2032
- Table 107: South Korea Hematology Analyzers Industry Revenue (Million) Forecast, by Application 2019 & 2032
- Table 108: South Korea Hematology Analyzers Industry Volume (K Unit) Forecast, by Application 2019 & 2032
- Table 109: Rest of Asia Pacific Hematology Analyzers Industry Revenue (Million) Forecast, by Application 2019 & 2032
- Table 110: Rest of Asia Pacific Hematology Analyzers Industry Volume (K Unit) Forecast, by Application 2019 & 2032
- Table 111: Global Hematology Analyzers Industry Revenue Million Forecast, by Product Type 2019 & 2032
- Table 112: Global Hematology Analyzers Industry Volume K Unit Forecast, by Product Type 2019 & 2032
- Table 113: Global Hematology Analyzers Industry Revenue Million Forecast, by End User 2019 & 2032
- Table 114: Global Hematology Analyzers Industry Volume K Unit Forecast, by End User 2019 & 2032
- Table 115: Global Hematology Analyzers Industry Revenue Million Forecast, by Country 2019 & 2032
- Table 116: Global Hematology Analyzers Industry Volume K Unit Forecast, by Country 2019 & 2032
- Table 117: GCC Hematology Analyzers Industry Revenue (Million) Forecast, by Application 2019 & 2032
- Table 118: GCC Hematology Analyzers Industry Volume (K Unit) Forecast, by Application 2019 & 2032
- Table 119: South Africa Hematology Analyzers Industry Revenue (Million) Forecast, by Application 2019 & 2032
- Table 120: South Africa Hematology Analyzers Industry Volume (K Unit) Forecast, by Application 2019 & 2032
- Table 121: Rest of Middle East and Africa Hematology Analyzers Industry Revenue (Million) Forecast, by Application 2019 & 2032
- Table 122: Rest of Middle East and Africa Hematology Analyzers Industry Volume (K Unit) Forecast, by Application 2019 & 2032
- Table 123: Global Hematology Analyzers Industry Revenue Million Forecast, by Product Type 2019 & 2032
- Table 124: Global Hematology Analyzers Industry Volume K Unit Forecast, by Product Type 2019 & 2032
- Table 125: Global Hematology Analyzers Industry Revenue Million Forecast, by End User 2019 & 2032
- Table 126: Global Hematology Analyzers Industry Volume K Unit Forecast, by End User 2019 & 2032
- Table 127: Global Hematology Analyzers Industry Revenue Million Forecast, by Country 2019 & 2032
- Table 128: Global Hematology Analyzers Industry Volume K Unit Forecast, by Country 2019 & 2032
- Table 129: Brazil Hematology Analyzers Industry Revenue (Million) Forecast, by Application 2019 & 2032
- Table 130: Brazil Hematology Analyzers Industry Volume (K Unit) Forecast, by Application 2019 & 2032
- Table 131: Argentina Hematology Analyzers Industry Revenue (Million) Forecast, by Application 2019 & 2032
- Table 132: Argentina Hematology Analyzers Industry Volume (K Unit) Forecast, by Application 2019 & 2032
- Table 133: Rest of South America Hematology Analyzers Industry Revenue (Million) Forecast, by Application 2019 & 2032
- Table 134: Rest of South America Hematology Analyzers Industry Volume (K Unit) Forecast, by Application 2019 & 2032
Frequently Asked Questions
1. What is the projected Compound Annual Growth Rate (CAGR) of the Hematology Analyzers Industry?
The projected CAGR is approximately 7.10%.
2. Which companies are prominent players in the Hematology Analyzers Industry?
Key companies in the market include Stratec Biomedical Systems (DIATRON), Horiba Ltd, Siemens Healthineers, Abbott Laboratories, F Hoffmann-La Roche Ltd, Ortho Clinical Diagnostics, Boule Diagnostics AB, Bio-Rad Laboratories, Beckman Coulter Inc (Danaher Corporation), Sysmex Corporation, Accurex Biomedical Pvt Ltd , Nihon Kohden Corporation.
3. What are the main segments of the Hematology Analyzers Industry?
The market segments include Product Type, End User.
4. Can you provide details about the market size?
The market size is estimated to be USD 6.23 Million as of 2022.
5. What are some drivers contributing to market growth?
Rising Burden of Blood Disorders; Increasing Technological Advancements and Rising Adoption Rates of Automated Hematology Instruments.
6. What are the notable trends driving market growth?
3 Part Hematology Analyzer is the Segment by Instruments Expected to Hold Significant Market Share Over the Forecast Period.
7. Are there any restraints impacting market growth?
High Cost of Hematology Analyzers; Time-consuming and Stringent Rregulatory Policies.
8. Can you provide examples of recent developments in the market?
In May 2022, Nihon Kohden India established a new hematology analyzer reagent factory.
9. What pricing options are available for accessing the report?
Pricing options include single-user, multi-user, and enterprise licenses priced at USD 4750, USD 5250, and USD 8750 respectively.
10. Is the market size provided in terms of value or volume?
The market size is provided in terms of value, measured in Million and volume, measured in K Unit.
11. Are there any specific market keywords associated with the report?
Yes, the market keyword associated with the report is "Hematology Analyzers Industry," which aids in identifying and referencing the specific market segment covered.
12. How do I determine which pricing option suits my needs best?
The pricing options vary based on user requirements and access needs. Individual users may opt for single-user licenses, while businesses requiring broader access may choose multi-user or enterprise licenses for cost-effective access to the report.
13. Are there any additional resources or data provided in the Hematology Analyzers Industry report?
While the report offers comprehensive insights, it's advisable to review the specific contents or supplementary materials provided to ascertain if additional resources or data are available.
14. How can I stay updated on further developments or reports in the Hematology Analyzers Industry?
To stay informed about further developments, trends, and reports in the Hematology Analyzers Industry, consider subscribing to industry newsletters, following relevant companies and organizations, or regularly checking reputable industry news sources and publications.
Methodology
Step 1 - Identification of Relevant Samples Size from Population Database


Step 2 - Approaches for Defining Global Market Size (Value, Volume* & Price*)

Note*: In applicable scenarios
Step 3 - Data Sources
Primary Research
- Web Analytics
- Survey Reports
- Research Institute
- Latest Research Reports
- Opinion Leaders
Secondary Research
- Annual Reports
- White Paper
- Latest Press Release
- Industry Association
- Paid Database
- Investor Presentations

Step 4 - Data Triangulation
Involves using different sources of information in order to increase the validity of a study
These sources are likely to be stakeholders in a program - participants, other researchers, program staff, other community members, and so on.
Then we put all data in single framework & apply various statistical tools to find out the dynamic on the market.
During the analysis stage, feedback from the stakeholder groups would be compared to determine areas of agreement as well as areas of divergence


