
Key Insights
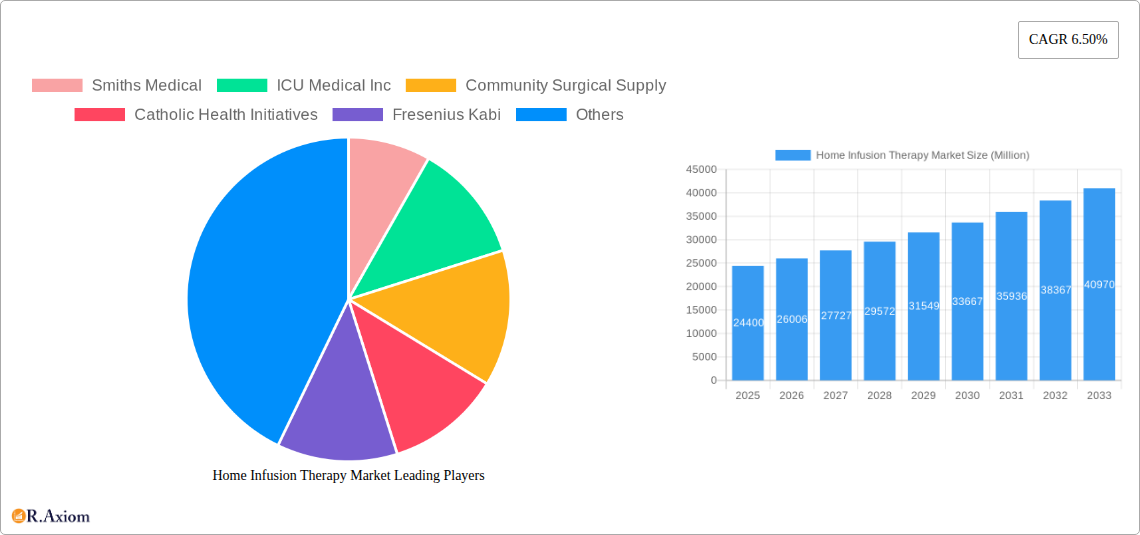
The Home Infusion Therapy market, valued at $24.40 billion in 2025, is projected to experience robust growth, driven by several key factors. The increasing prevalence of chronic diseases requiring long-term infusion therapy, such as cancer, diabetes, and autoimmune disorders, is a significant driver. Furthermore, the rising geriatric population, which is more susceptible to these conditions, fuels market expansion. Technological advancements in infusion pumps and devices, leading to improved patient comfort, safety, and treatment efficacy, further contribute to market growth. The shift towards home-based care, driven by cost-effectiveness and improved patient quality of life, is another major trend. However, challenges remain, including the need for skilled healthcare professionals for administration and monitoring, potential risks associated with home infusion, and reimbursement complexities across various healthcare systems. This necessitates a well-defined regulatory landscape and investment in robust training programs for healthcare providers.
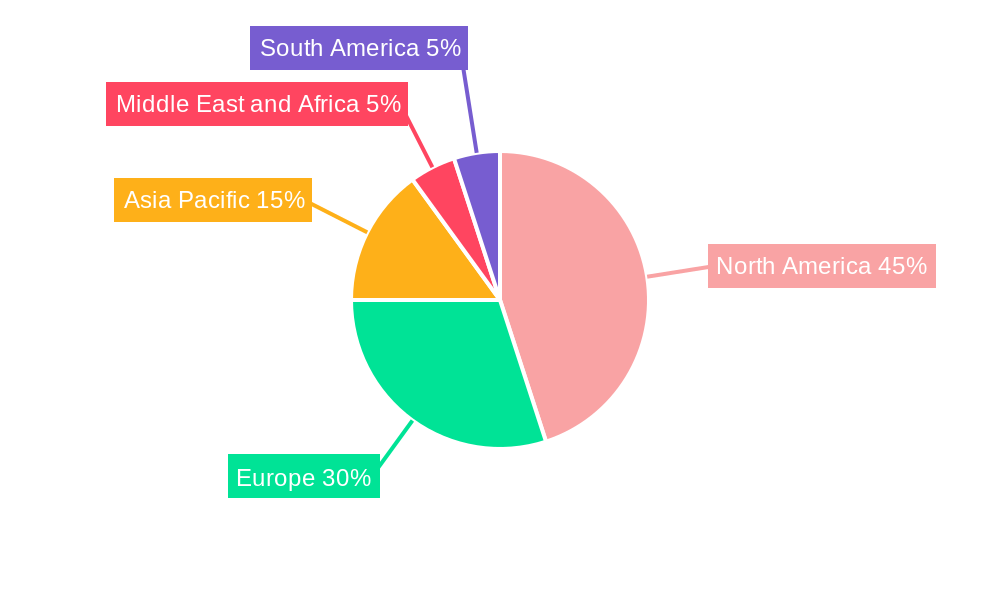
Despite these restraints, the market's positive outlook is underscored by the diverse range of applications, including total parenteral nutrition, anti-infective therapy, enteral nutrition, hydration therapy, chemotherapy, and IVIg/specialty pharmaceuticals. The market is segmented geographically, with North America and Europe currently holding significant market share due to well-established healthcare infrastructure and higher adoption rates. However, the Asia Pacific region is poised for significant growth in the coming years, driven by rising healthcare spending and increasing awareness of home infusion therapy. The competitive landscape includes established players like Smiths Medical, ICU Medical Inc., and Fresenius Kabi, along with other significant regional and specialty providers. Continued innovation, strategic partnerships, and expansion into emerging markets will be crucial for success in this dynamic and expanding market. The forecast period of 2025-2033 anticipates sustained growth, propelled by the factors outlined above.
Home Infusion Therapy Market: A Comprehensive Report (2019-2033)
This detailed report provides a comprehensive analysis of the Home Infusion Therapy market, offering invaluable insights for stakeholders across the industry. Covering the period from 2019 to 2033, with a base year of 2025 and a forecast period of 2025-2033, this report meticulously examines market dynamics, growth drivers, challenges, and emerging opportunities. The study incorporates extensive data and analysis, including market sizing, segmentation, competitive landscape, and key industry developments, to provide a holistic understanding of this rapidly evolving market. The report uses Million for all values.
Home Infusion Therapy Market Market Concentration & Innovation
The Home Infusion Therapy market exhibits a moderately concentrated landscape, with a few key players holding significant market share. However, the market also witnesses consistent innovation, driven by the demand for improved patient outcomes, technological advancements, and evolving regulatory landscapes. Market share data from 2024 suggests that the top five players collectively hold approximately xx% of the market. The average deal value for M&A activities in the past five years has been approximately $xx Million, indicating significant consolidation efforts within the sector.
- Key Players: Smiths Medical, ICU Medical Inc, Fresenius Kabi, Baxter International, Becton Dickinson and Companies.
- Innovation Drivers: Advances in infusion pump technology (e.g., smart pumps, wireless connectivity), development of novel drug delivery systems, and the increasing adoption of remote patient monitoring solutions.
- Regulatory Frameworks: Stringent regulatory approvals (e.g., FDA 510(k) clearances) influence product development and market entry. Variations in regulatory frameworks across different regions impact market penetration strategies.
- Product Substitutes: While direct substitutes are limited, alternative treatment approaches and advancements in oral medications pose some indirect competitive pressure.
- End-User Trends: Increasing preference for home-based care, coupled with a growing aging population and rising prevalence of chronic diseases, fuels market demand.
- M&A Activities: Strategic acquisitions and mergers aim to expand product portfolios, enhance geographic reach, and consolidate market positions.
Home Infusion Therapy Market Industry Trends & Insights
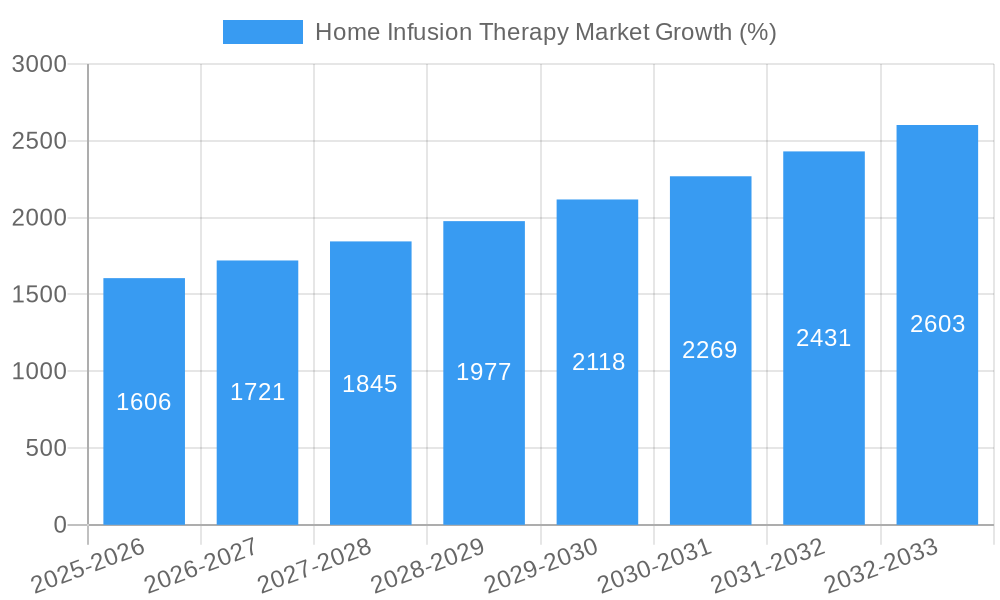
The Home Infusion Therapy market is experiencing robust growth, with a projected CAGR of xx% during the forecast period (2025-2033). This growth is primarily driven by the increasing prevalence of chronic diseases requiring long-term infusion therapies, rising healthcare expenditure, and technological advancements leading to improved treatment efficacy and patient convenience. Market penetration for home infusion therapy is also on the rise, particularly in developed regions. Technological disruptions, such as the integration of AI and IoT in infusion pumps, are enhancing treatment precision and patient safety. Consumer preferences are shifting towards convenient and personalized home-based care solutions. The competitive landscape is marked by both large multinational corporations and specialized home infusion providers. This intensifying competition is further driving innovation and improvements in service quality. The market is witnessing increased adoption of value-based care models and the growing importance of data analytics to optimize treatment strategies and improve outcomes.
Dominant Markets & Segments in Home Infusion Therapy Market
The North American region currently dominates the Home Infusion Therapy market, driven by high healthcare spending, advanced healthcare infrastructure, and a large patient population requiring infusion therapies. Within product segments, Infusion Pump Sets hold the largest market share, reflecting the essential nature of these devices in home infusion therapy. Among applications, Chemotherapy and IVIg/Specialty Pharmaceuticals are the leading segments, owing to the increasing prevalence of cancer and autoimmune disorders.
- Key Drivers in North America:
- High healthcare expenditure and insurance coverage.
- Well-established healthcare infrastructure and skilled workforce.
- High prevalence of chronic diseases requiring home infusion therapy.
- Dominance Analysis: The dominance of North America is further strengthened by the presence of major market players, advanced technological capabilities, and favorable regulatory environments. However, other regions, such as Europe and Asia-Pacific, are expected to witness significant growth in the coming years, driven by increasing healthcare awareness and improving healthcare infrastructure.
Home Infusion Therapy Market Product Developments
Recent innovations in home infusion therapy have focused on enhancing safety, convenience, and efficacy of treatment. Smart pumps with advanced features like drug library and automated alerts improve accuracy and reduce the risk of medication errors. The development of smaller, more portable infusion devices enhances patient mobility and comfort. Advances in needle-free injection technologies are increasing patient acceptance and reducing the discomfort associated with traditional needle-based infusions. These developments align with market demands for safer, more convenient, and effective home infusion solutions.
Report Scope & Segmentation Analysis
This report segments the Home Infusion Therapy market based on Product (Infusion Pump Sets, Accessories and Consumables) and Applications (Total Parenteral Nutrition, Anti-infective Therapy, Enteral Nutrition, Hydration Therapy, Chemotherapy, IVIg/Specialty Pharmaceuticals, Other Applications). Each segment's growth projections are analyzed based on factors like market size, competitive intensity, and technological advancements. The Infusion Pump Sets segment is projected to maintain a significant market share due to the indispensable nature of infusion pumps. The Chemotherapy segment is expected to grow rapidly, driven by the rising prevalence of cancer. Competitive dynamics vary across segments, with some experiencing higher competition than others.
Key Drivers of Home Infusion Therapy Market Growth
The home infusion therapy market’s expansion is propelled by several factors: the rising prevalence of chronic illnesses requiring long-term infusion treatments; the escalating costs associated with hospitalizations; a preference for convenient and cost-effective home-based care; technological breakthroughs such as smart pumps and remote patient monitoring systems; and supportive regulatory frameworks that encourage home healthcare. Moreover, favorable reimbursement policies and increasing healthcare investments further stimulate growth.
Challenges in the Home Infusion Therapy Market Sector
The home infusion therapy sector faces challenges, including stringent regulatory hurdles and the associated costs of compliance; complexities in supply chain management, particularly for specialized medications; intensifying competition among providers leading to price pressures; and the need for skilled healthcare professionals to oversee patient care at home. These challenges, if not mitigated effectively, can impact market growth. The average cost of regulatory compliance for a new product introduction is estimated at xx Million.
Emerging Opportunities in Home Infusion Therapy Market
Emerging opportunities include the expansion into underserved markets, especially in developing economies; the integration of telehealth and remote monitoring to enhance patient care and reduce hospital readmissions; the development of innovative drug delivery systems; the customization of treatment plans based on individual patient needs; and the use of data analytics to optimize treatment outcomes.
Leading Players in the Home Infusion Therapy Market Market
- Smiths Medical
- ICU Medical Inc
- Community Surgical Supply
- Catholic Health Initiatives
- Fresenius Kabi
- Terumo Corporation
- Nipro Corporation
- Eli Lilly and Company
- McLaren Health Care
- Sutter Health
- Option Care Health Inc
- McKesson Medical-Surgical Inc
- B Braun Melsungen AG
- Baxter International
- Becton Dickinson and Companies
Key Developments in Home Infusion Therapy Market Industry
- September 2022: Baxter International Inc. received FDA 510(k) clearance for its new Novum IQ syringe infusion pump (SYR) with Dose IQ Safety Software. This launch signifies a significant advancement in infusion pump technology, enhancing safety and efficacy.
- January 2023: KORU Medical Systems, Inc. entered into a development agreement to develop and seek regulatory approval for the Freedom Infusion System with a SCIg prefilled syringe. This collaboration expands the applications of the Freedom Infusion System and positions KORU Medical Systems for growth within the SCIg market.
Strategic Outlook for Home Infusion Therapy Market Market
The future of the home infusion therapy market appears promising, with sustained growth driven by the factors mentioned previously. Strategic initiatives focusing on technological innovation, expansion into new markets, strategic partnerships, and the development of personalized treatment solutions will be crucial for players to succeed in this dynamic and evolving landscape. The market is poised for significant expansion in the coming years, fueled by increasing demand and technological advancements.
Home Infusion Therapy Market Segmentation
-
1. Product
- 1.1. Infusion Pump Sets
- 1.2. Accessories and Consumables
-
2. Applications
- 2.1. Total Parenteral Nutrition
- 2.2. Anti-infective Therapy
- 2.3. Enteral Nutrition
- 2.4. Hydration Therapy
- 2.5. Chemotherapy
- 2.6. IVIg/Specialty Pharmaceuticals
- 2.7. Other Applications
Home Infusion Therapy Market Segmentation By Geography
-
1. North America
- 1.1. United States
- 1.2. Canada
- 1.3. Mexico
-
2. Europe
- 2.1. Germany
- 2.2. United Kingdom
- 2.3. France
- 2.4. Italy
- 2.5. Spain
- 2.6. Rest of Europe
-
3. Asia Pacific
- 3.1. China
- 3.2. Japan
- 3.3. India
- 3.4. Australia
- 3.5. South Korea
- 3.6. Rest of Asia Pacific
-
4. Middle East and Africa
- 4.1. GCC
- 4.2. South Africa
- 4.3. Rest of Middle East and Africa
-
5. South America
- 5.1. Brazil
- 5.2. Argentina
- 5.3. Rest of South America
Home Infusion Therapy Market REPORT HIGHLIGHTS
| Aspects | Details |
|---|---|
| Study Period | 2019-2033 |
| Base Year | 2024 |
| Estimated Year | 2025 |
| Forecast Period | 2025-2033 |
| Historical Period | 2019-2024 |
| Growth Rate | CAGR of 6.50% from 2019-2033 |
| Segmentation |
|
Table of Contents
- 1. Introduction
- 1.1. Research Scope
- 1.2. Market Segmentation
- 1.3. Research Methodology
- 1.4. Definitions and Assumptions
- 2. Executive Summary
- 2.1. Introduction
- 3. Market Dynamics
- 3.1. Introduction
- 3.2. Market Drivers
- 3.2.1. Growing Number of Baby Boomers Suffering From Decreased Mobility; Growing Incidence of Hospital-acquired Infections; Increasing Adoption of Home Healthcare Coupled with Technological Advancements
- 3.3. Market Restrains
- 3.3.1. High Cost of Infusion Pumps; Safety Issues Associated with Infusion Pumps
- 3.4. Market Trends
- 3.4.1. Anti-infective Therapy Dominates the Home Infusion Therapy Market
- 4. Market Factor Analysis
- 4.1. Porters Five Forces
- 4.2. Supply/Value Chain
- 4.3. PESTEL analysis
- 4.4. Market Entropy
- 4.5. Patent/Trademark Analysis
- 5. Global Home Infusion Therapy Market Analysis, Insights and Forecast, 2019-2031
- 5.1. Market Analysis, Insights and Forecast - by Product
- 5.1.1. Infusion Pump Sets
- 5.1.2. Accessories and Consumables
- 5.2. Market Analysis, Insights and Forecast - by Applications
- 5.2.1. Total Parenteral Nutrition
- 5.2.2. Anti-infective Therapy
- 5.2.3. Enteral Nutrition
- 5.2.4. Hydration Therapy
- 5.2.5. Chemotherapy
- 5.2.6. IVIg/Specialty Pharmaceuticals
- 5.2.7. Other Applications
- 5.3. Market Analysis, Insights and Forecast - by Region
- 5.3.1. North America
- 5.3.2. Europe
- 5.3.3. Asia Pacific
- 5.3.4. Middle East and Africa
- 5.3.5. South America
- 5.1. Market Analysis, Insights and Forecast - by Product
- 6. North America Home Infusion Therapy Market Analysis, Insights and Forecast, 2019-2031
- 6.1. Market Analysis, Insights and Forecast - by Product
- 6.1.1. Infusion Pump Sets
- 6.1.2. Accessories and Consumables
- 6.2. Market Analysis, Insights and Forecast - by Applications
- 6.2.1. Total Parenteral Nutrition
- 6.2.2. Anti-infective Therapy
- 6.2.3. Enteral Nutrition
- 6.2.4. Hydration Therapy
- 6.2.5. Chemotherapy
- 6.2.6. IVIg/Specialty Pharmaceuticals
- 6.2.7. Other Applications
- 6.1. Market Analysis, Insights and Forecast - by Product
- 7. Europe Home Infusion Therapy Market Analysis, Insights and Forecast, 2019-2031
- 7.1. Market Analysis, Insights and Forecast - by Product
- 7.1.1. Infusion Pump Sets
- 7.1.2. Accessories and Consumables
- 7.2. Market Analysis, Insights and Forecast - by Applications
- 7.2.1. Total Parenteral Nutrition
- 7.2.2. Anti-infective Therapy
- 7.2.3. Enteral Nutrition
- 7.2.4. Hydration Therapy
- 7.2.5. Chemotherapy
- 7.2.6. IVIg/Specialty Pharmaceuticals
- 7.2.7. Other Applications
- 7.1. Market Analysis, Insights and Forecast - by Product
- 8. Asia Pacific Home Infusion Therapy Market Analysis, Insights and Forecast, 2019-2031
- 8.1. Market Analysis, Insights and Forecast - by Product
- 8.1.1. Infusion Pump Sets
- 8.1.2. Accessories and Consumables
- 8.2. Market Analysis, Insights and Forecast - by Applications
- 8.2.1. Total Parenteral Nutrition
- 8.2.2. Anti-infective Therapy
- 8.2.3. Enteral Nutrition
- 8.2.4. Hydration Therapy
- 8.2.5. Chemotherapy
- 8.2.6. IVIg/Specialty Pharmaceuticals
- 8.2.7. Other Applications
- 8.1. Market Analysis, Insights and Forecast - by Product
- 9. Middle East and Africa Home Infusion Therapy Market Analysis, Insights and Forecast, 2019-2031
- 9.1. Market Analysis, Insights and Forecast - by Product
- 9.1.1. Infusion Pump Sets
- 9.1.2. Accessories and Consumables
- 9.2. Market Analysis, Insights and Forecast - by Applications
- 9.2.1. Total Parenteral Nutrition
- 9.2.2. Anti-infective Therapy
- 9.2.3. Enteral Nutrition
- 9.2.4. Hydration Therapy
- 9.2.5. Chemotherapy
- 9.2.6. IVIg/Specialty Pharmaceuticals
- 9.2.7. Other Applications
- 9.1. Market Analysis, Insights and Forecast - by Product
- 10. South America Home Infusion Therapy Market Analysis, Insights and Forecast, 2019-2031
- 10.1. Market Analysis, Insights and Forecast - by Product
- 10.1.1. Infusion Pump Sets
- 10.1.2. Accessories and Consumables
- 10.2. Market Analysis, Insights and Forecast - by Applications
- 10.2.1. Total Parenteral Nutrition
- 10.2.2. Anti-infective Therapy
- 10.2.3. Enteral Nutrition
- 10.2.4. Hydration Therapy
- 10.2.5. Chemotherapy
- 10.2.6. IVIg/Specialty Pharmaceuticals
- 10.2.7. Other Applications
- 10.1. Market Analysis, Insights and Forecast - by Product
- 11. North America Home Infusion Therapy Market Analysis, Insights and Forecast, 2019-2031
- 11.1. Market Analysis, Insights and Forecast - By Country/Sub-region
- 11.1.1. undefined
- 12. Europe Home Infusion Therapy Market Analysis, Insights and Forecast, 2019-2031
- 12.1. Market Analysis, Insights and Forecast - By Country/Sub-region
- 12.1.1. undefined
- 13. Asia Pacific Home Infusion Therapy Market Analysis, Insights and Forecast, 2019-2031
- 13.1. Market Analysis, Insights and Forecast - By Country/Sub-region
- 13.1.1. undefined
- 14. Middle East and Africa Home Infusion Therapy Market Analysis, Insights and Forecast, 2019-2031
- 14.1. Market Analysis, Insights and Forecast - By Country/Sub-region
- 14.1.1. undefined
- 15. South America Home Infusion Therapy Market Analysis, Insights and Forecast, 2019-2031
- 15.1. Market Analysis, Insights and Forecast - By Country/Sub-region
- 15.1.1. undefined
- 16. Competitive Analysis
- 16.1. Global Market Share Analysis 2024
- 16.2. Company Profiles
- 16.2.1 Smiths Medical
- 16.2.1.1. Overview
- 16.2.1.2. Products
- 16.2.1.3. SWOT Analysis
- 16.2.1.4. Recent Developments
- 16.2.1.5. Financials (Based on Availability)
- 16.2.2 ICU Medical Inc
- 16.2.2.1. Overview
- 16.2.2.2. Products
- 16.2.2.3. SWOT Analysis
- 16.2.2.4. Recent Developments
- 16.2.2.5. Financials (Based on Availability)
- 16.2.3 Community Surgical Supply
- 16.2.3.1. Overview
- 16.2.3.2. Products
- 16.2.3.3. SWOT Analysis
- 16.2.3.4. Recent Developments
- 16.2.3.5. Financials (Based on Availability)
- 16.2.4 Catholic Health Initiatives
- 16.2.4.1. Overview
- 16.2.4.2. Products
- 16.2.4.3. SWOT Analysis
- 16.2.4.4. Recent Developments
- 16.2.4.5. Financials (Based on Availability)
- 16.2.5 Fresenius Kabi
- 16.2.5.1. Overview
- 16.2.5.2. Products
- 16.2.5.3. SWOT Analysis
- 16.2.5.4. Recent Developments
- 16.2.5.5. Financials (Based on Availability)
- 16.2.6 Terumo Corporation
- 16.2.6.1. Overview
- 16.2.6.2. Products
- 16.2.6.3. SWOT Analysis
- 16.2.6.4. Recent Developments
- 16.2.6.5. Financials (Based on Availability)
- 16.2.7 Nipro Corporation
- 16.2.7.1. Overview
- 16.2.7.2. Products
- 16.2.7.3. SWOT Analysis
- 16.2.7.4. Recent Developments
- 16.2.7.5. Financials (Based on Availability)
- 16.2.8 Eli Lilly and Company
- 16.2.8.1. Overview
- 16.2.8.2. Products
- 16.2.8.3. SWOT Analysis
- 16.2.8.4. Recent Developments
- 16.2.8.5. Financials (Based on Availability)
- 16.2.9 McLaren Health Care
- 16.2.9.1. Overview
- 16.2.9.2. Products
- 16.2.9.3. SWOT Analysis
- 16.2.9.4. Recent Developments
- 16.2.9.5. Financials (Based on Availability)
- 16.2.10 Sutter Health
- 16.2.10.1. Overview
- 16.2.10.2. Products
- 16.2.10.3. SWOT Analysis
- 16.2.10.4. Recent Developments
- 16.2.10.5. Financials (Based on Availability)
- 16.2.11 Option Care Health Inc
- 16.2.11.1. Overview
- 16.2.11.2. Products
- 16.2.11.3. SWOT Analysis
- 16.2.11.4. Recent Developments
- 16.2.11.5. Financials (Based on Availability)
- 16.2.12 McKesson Medical-Surgical Inc
- 16.2.12.1. Overview
- 16.2.12.2. Products
- 16.2.12.3. SWOT Analysis
- 16.2.12.4. Recent Developments
- 16.2.12.5. Financials (Based on Availability)
- 16.2.13 B Braun Melsungen AG
- 16.2.13.1. Overview
- 16.2.13.2. Products
- 16.2.13.3. SWOT Analysis
- 16.2.13.4. Recent Developments
- 16.2.13.5. Financials (Based on Availability)
- 16.2.14 Baxter International
- 16.2.14.1. Overview
- 16.2.14.2. Products
- 16.2.14.3. SWOT Analysis
- 16.2.14.4. Recent Developments
- 16.2.14.5. Financials (Based on Availability)
- 16.2.15 Becton Dickinson and Companies
- 16.2.15.1. Overview
- 16.2.15.2. Products
- 16.2.15.3. SWOT Analysis
- 16.2.15.4. Recent Developments
- 16.2.15.5. Financials (Based on Availability)
- 16.2.1 Smiths Medical
List of Figures
- Figure 1: Global Home Infusion Therapy Market Revenue Breakdown (Million, %) by Region 2024 & 2032
- Figure 2: Global Home Infusion Therapy Market Volume Breakdown (K Unit, %) by Region 2024 & 2032
- Figure 3: North America Home Infusion Therapy Market Revenue (Million), by Country 2024 & 2032
- Figure 4: North America Home Infusion Therapy Market Volume (K Unit), by Country 2024 & 2032
- Figure 5: North America Home Infusion Therapy Market Revenue Share (%), by Country 2024 & 2032
- Figure 6: North America Home Infusion Therapy Market Volume Share (%), by Country 2024 & 2032
- Figure 7: Europe Home Infusion Therapy Market Revenue (Million), by Country 2024 & 2032
- Figure 8: Europe Home Infusion Therapy Market Volume (K Unit), by Country 2024 & 2032
- Figure 9: Europe Home Infusion Therapy Market Revenue Share (%), by Country 2024 & 2032
- Figure 10: Europe Home Infusion Therapy Market Volume Share (%), by Country 2024 & 2032
- Figure 11: Asia Pacific Home Infusion Therapy Market Revenue (Million), by Country 2024 & 2032
- Figure 12: Asia Pacific Home Infusion Therapy Market Volume (K Unit), by Country 2024 & 2032
- Figure 13: Asia Pacific Home Infusion Therapy Market Revenue Share (%), by Country 2024 & 2032
- Figure 14: Asia Pacific Home Infusion Therapy Market Volume Share (%), by Country 2024 & 2032
- Figure 15: Middle East and Africa Home Infusion Therapy Market Revenue (Million), by Country 2024 & 2032
- Figure 16: Middle East and Africa Home Infusion Therapy Market Volume (K Unit), by Country 2024 & 2032
- Figure 17: Middle East and Africa Home Infusion Therapy Market Revenue Share (%), by Country 2024 & 2032
- Figure 18: Middle East and Africa Home Infusion Therapy Market Volume Share (%), by Country 2024 & 2032
- Figure 19: South America Home Infusion Therapy Market Revenue (Million), by Country 2024 & 2032
- Figure 20: South America Home Infusion Therapy Market Volume (K Unit), by Country 2024 & 2032
- Figure 21: South America Home Infusion Therapy Market Revenue Share (%), by Country 2024 & 2032
- Figure 22: South America Home Infusion Therapy Market Volume Share (%), by Country 2024 & 2032
- Figure 23: North America Home Infusion Therapy Market Revenue (Million), by Product 2024 & 2032
- Figure 24: North America Home Infusion Therapy Market Volume (K Unit), by Product 2024 & 2032
- Figure 25: North America Home Infusion Therapy Market Revenue Share (%), by Product 2024 & 2032
- Figure 26: North America Home Infusion Therapy Market Volume Share (%), by Product 2024 & 2032
- Figure 27: North America Home Infusion Therapy Market Revenue (Million), by Applications 2024 & 2032
- Figure 28: North America Home Infusion Therapy Market Volume (K Unit), by Applications 2024 & 2032
- Figure 29: North America Home Infusion Therapy Market Revenue Share (%), by Applications 2024 & 2032
- Figure 30: North America Home Infusion Therapy Market Volume Share (%), by Applications 2024 & 2032
- Figure 31: North America Home Infusion Therapy Market Revenue (Million), by Country 2024 & 2032
- Figure 32: North America Home Infusion Therapy Market Volume (K Unit), by Country 2024 & 2032
- Figure 33: North America Home Infusion Therapy Market Revenue Share (%), by Country 2024 & 2032
- Figure 34: North America Home Infusion Therapy Market Volume Share (%), by Country 2024 & 2032
- Figure 35: Europe Home Infusion Therapy Market Revenue (Million), by Product 2024 & 2032
- Figure 36: Europe Home Infusion Therapy Market Volume (K Unit), by Product 2024 & 2032
- Figure 37: Europe Home Infusion Therapy Market Revenue Share (%), by Product 2024 & 2032
- Figure 38: Europe Home Infusion Therapy Market Volume Share (%), by Product 2024 & 2032
- Figure 39: Europe Home Infusion Therapy Market Revenue (Million), by Applications 2024 & 2032
- Figure 40: Europe Home Infusion Therapy Market Volume (K Unit), by Applications 2024 & 2032
- Figure 41: Europe Home Infusion Therapy Market Revenue Share (%), by Applications 2024 & 2032
- Figure 42: Europe Home Infusion Therapy Market Volume Share (%), by Applications 2024 & 2032
- Figure 43: Europe Home Infusion Therapy Market Revenue (Million), by Country 2024 & 2032
- Figure 44: Europe Home Infusion Therapy Market Volume (K Unit), by Country 2024 & 2032
- Figure 45: Europe Home Infusion Therapy Market Revenue Share (%), by Country 2024 & 2032
- Figure 46: Europe Home Infusion Therapy Market Volume Share (%), by Country 2024 & 2032
- Figure 47: Asia Pacific Home Infusion Therapy Market Revenue (Million), by Product 2024 & 2032
- Figure 48: Asia Pacific Home Infusion Therapy Market Volume (K Unit), by Product 2024 & 2032
- Figure 49: Asia Pacific Home Infusion Therapy Market Revenue Share (%), by Product 2024 & 2032
- Figure 50: Asia Pacific Home Infusion Therapy Market Volume Share (%), by Product 2024 & 2032
- Figure 51: Asia Pacific Home Infusion Therapy Market Revenue (Million), by Applications 2024 & 2032
- Figure 52: Asia Pacific Home Infusion Therapy Market Volume (K Unit), by Applications 2024 & 2032
- Figure 53: Asia Pacific Home Infusion Therapy Market Revenue Share (%), by Applications 2024 & 2032
- Figure 54: Asia Pacific Home Infusion Therapy Market Volume Share (%), by Applications 2024 & 2032
- Figure 55: Asia Pacific Home Infusion Therapy Market Revenue (Million), by Country 2024 & 2032
- Figure 56: Asia Pacific Home Infusion Therapy Market Volume (K Unit), by Country 2024 & 2032
- Figure 57: Asia Pacific Home Infusion Therapy Market Revenue Share (%), by Country 2024 & 2032
- Figure 58: Asia Pacific Home Infusion Therapy Market Volume Share (%), by Country 2024 & 2032
- Figure 59: Middle East and Africa Home Infusion Therapy Market Revenue (Million), by Product 2024 & 2032
- Figure 60: Middle East and Africa Home Infusion Therapy Market Volume (K Unit), by Product 2024 & 2032
- Figure 61: Middle East and Africa Home Infusion Therapy Market Revenue Share (%), by Product 2024 & 2032
- Figure 62: Middle East and Africa Home Infusion Therapy Market Volume Share (%), by Product 2024 & 2032
- Figure 63: Middle East and Africa Home Infusion Therapy Market Revenue (Million), by Applications 2024 & 2032
- Figure 64: Middle East and Africa Home Infusion Therapy Market Volume (K Unit), by Applications 2024 & 2032
- Figure 65: Middle East and Africa Home Infusion Therapy Market Revenue Share (%), by Applications 2024 & 2032
- Figure 66: Middle East and Africa Home Infusion Therapy Market Volume Share (%), by Applications 2024 & 2032
- Figure 67: Middle East and Africa Home Infusion Therapy Market Revenue (Million), by Country 2024 & 2032
- Figure 68: Middle East and Africa Home Infusion Therapy Market Volume (K Unit), by Country 2024 & 2032
- Figure 69: Middle East and Africa Home Infusion Therapy Market Revenue Share (%), by Country 2024 & 2032
- Figure 70: Middle East and Africa Home Infusion Therapy Market Volume Share (%), by Country 2024 & 2032
- Figure 71: South America Home Infusion Therapy Market Revenue (Million), by Product 2024 & 2032
- Figure 72: South America Home Infusion Therapy Market Volume (K Unit), by Product 2024 & 2032
- Figure 73: South America Home Infusion Therapy Market Revenue Share (%), by Product 2024 & 2032
- Figure 74: South America Home Infusion Therapy Market Volume Share (%), by Product 2024 & 2032
- Figure 75: South America Home Infusion Therapy Market Revenue (Million), by Applications 2024 & 2032
- Figure 76: South America Home Infusion Therapy Market Volume (K Unit), by Applications 2024 & 2032
- Figure 77: South America Home Infusion Therapy Market Revenue Share (%), by Applications 2024 & 2032
- Figure 78: South America Home Infusion Therapy Market Volume Share (%), by Applications 2024 & 2032
- Figure 79: South America Home Infusion Therapy Market Revenue (Million), by Country 2024 & 2032
- Figure 80: South America Home Infusion Therapy Market Volume (K Unit), by Country 2024 & 2032
- Figure 81: South America Home Infusion Therapy Market Revenue Share (%), by Country 2024 & 2032
- Figure 82: South America Home Infusion Therapy Market Volume Share (%), by Country 2024 & 2032
List of Tables
- Table 1: Global Home Infusion Therapy Market Revenue Million Forecast, by Region 2019 & 2032
- Table 2: Global Home Infusion Therapy Market Volume K Unit Forecast, by Region 2019 & 2032
- Table 3: Global Home Infusion Therapy Market Revenue Million Forecast, by Product 2019 & 2032
- Table 4: Global Home Infusion Therapy Market Volume K Unit Forecast, by Product 2019 & 2032
- Table 5: Global Home Infusion Therapy Market Revenue Million Forecast, by Applications 2019 & 2032
- Table 6: Global Home Infusion Therapy Market Volume K Unit Forecast, by Applications 2019 & 2032
- Table 7: Global Home Infusion Therapy Market Revenue Million Forecast, by Region 2019 & 2032
- Table 8: Global Home Infusion Therapy Market Volume K Unit Forecast, by Region 2019 & 2032
- Table 9: Global Home Infusion Therapy Market Revenue Million Forecast, by Country 2019 & 2032
- Table 10: Global Home Infusion Therapy Market Volume K Unit Forecast, by Country 2019 & 2032
- Table 11: Global Home Infusion Therapy Market Revenue Million Forecast, by Country 2019 & 2032
- Table 12: Global Home Infusion Therapy Market Volume K Unit Forecast, by Country 2019 & 2032
- Table 13: Global Home Infusion Therapy Market Revenue Million Forecast, by Country 2019 & 2032
- Table 14: Global Home Infusion Therapy Market Volume K Unit Forecast, by Country 2019 & 2032
- Table 15: Global Home Infusion Therapy Market Revenue Million Forecast, by Country 2019 & 2032
- Table 16: Global Home Infusion Therapy Market Volume K Unit Forecast, by Country 2019 & 2032
- Table 17: Global Home Infusion Therapy Market Revenue Million Forecast, by Country 2019 & 2032
- Table 18: Global Home Infusion Therapy Market Volume K Unit Forecast, by Country 2019 & 2032
- Table 19: Global Home Infusion Therapy Market Revenue Million Forecast, by Product 2019 & 2032
- Table 20: Global Home Infusion Therapy Market Volume K Unit Forecast, by Product 2019 & 2032
- Table 21: Global Home Infusion Therapy Market Revenue Million Forecast, by Applications 2019 & 2032
- Table 22: Global Home Infusion Therapy Market Volume K Unit Forecast, by Applications 2019 & 2032
- Table 23: Global Home Infusion Therapy Market Revenue Million Forecast, by Country 2019 & 2032
- Table 24: Global Home Infusion Therapy Market Volume K Unit Forecast, by Country 2019 & 2032
- Table 25: United States Home Infusion Therapy Market Revenue (Million) Forecast, by Application 2019 & 2032
- Table 26: United States Home Infusion Therapy Market Volume (K Unit) Forecast, by Application 2019 & 2032
- Table 27: Canada Home Infusion Therapy Market Revenue (Million) Forecast, by Application 2019 & 2032
- Table 28: Canada Home Infusion Therapy Market Volume (K Unit) Forecast, by Application 2019 & 2032
- Table 29: Mexico Home Infusion Therapy Market Revenue (Million) Forecast, by Application 2019 & 2032
- Table 30: Mexico Home Infusion Therapy Market Volume (K Unit) Forecast, by Application 2019 & 2032
- Table 31: Global Home Infusion Therapy Market Revenue Million Forecast, by Product 2019 & 2032
- Table 32: Global Home Infusion Therapy Market Volume K Unit Forecast, by Product 2019 & 2032
- Table 33: Global Home Infusion Therapy Market Revenue Million Forecast, by Applications 2019 & 2032
- Table 34: Global Home Infusion Therapy Market Volume K Unit Forecast, by Applications 2019 & 2032
- Table 35: Global Home Infusion Therapy Market Revenue Million Forecast, by Country 2019 & 2032
- Table 36: Global Home Infusion Therapy Market Volume K Unit Forecast, by Country 2019 & 2032
- Table 37: Germany Home Infusion Therapy Market Revenue (Million) Forecast, by Application 2019 & 2032
- Table 38: Germany Home Infusion Therapy Market Volume (K Unit) Forecast, by Application 2019 & 2032
- Table 39: United Kingdom Home Infusion Therapy Market Revenue (Million) Forecast, by Application 2019 & 2032
- Table 40: United Kingdom Home Infusion Therapy Market Volume (K Unit) Forecast, by Application 2019 & 2032
- Table 41: France Home Infusion Therapy Market Revenue (Million) Forecast, by Application 2019 & 2032
- Table 42: France Home Infusion Therapy Market Volume (K Unit) Forecast, by Application 2019 & 2032
- Table 43: Italy Home Infusion Therapy Market Revenue (Million) Forecast, by Application 2019 & 2032
- Table 44: Italy Home Infusion Therapy Market Volume (K Unit) Forecast, by Application 2019 & 2032
- Table 45: Spain Home Infusion Therapy Market Revenue (Million) Forecast, by Application 2019 & 2032
- Table 46: Spain Home Infusion Therapy Market Volume (K Unit) Forecast, by Application 2019 & 2032
- Table 47: Rest of Europe Home Infusion Therapy Market Revenue (Million) Forecast, by Application 2019 & 2032
- Table 48: Rest of Europe Home Infusion Therapy Market Volume (K Unit) Forecast, by Application 2019 & 2032
- Table 49: Global Home Infusion Therapy Market Revenue Million Forecast, by Product 2019 & 2032
- Table 50: Global Home Infusion Therapy Market Volume K Unit Forecast, by Product 2019 & 2032
- Table 51: Global Home Infusion Therapy Market Revenue Million Forecast, by Applications 2019 & 2032
- Table 52: Global Home Infusion Therapy Market Volume K Unit Forecast, by Applications 2019 & 2032
- Table 53: Global Home Infusion Therapy Market Revenue Million Forecast, by Country 2019 & 2032
- Table 54: Global Home Infusion Therapy Market Volume K Unit Forecast, by Country 2019 & 2032
- Table 55: China Home Infusion Therapy Market Revenue (Million) Forecast, by Application 2019 & 2032
- Table 56: China Home Infusion Therapy Market Volume (K Unit) Forecast, by Application 2019 & 2032
- Table 57: Japan Home Infusion Therapy Market Revenue (Million) Forecast, by Application 2019 & 2032
- Table 58: Japan Home Infusion Therapy Market Volume (K Unit) Forecast, by Application 2019 & 2032
- Table 59: India Home Infusion Therapy Market Revenue (Million) Forecast, by Application 2019 & 2032
- Table 60: India Home Infusion Therapy Market Volume (K Unit) Forecast, by Application 2019 & 2032
- Table 61: Australia Home Infusion Therapy Market Revenue (Million) Forecast, by Application 2019 & 2032
- Table 62: Australia Home Infusion Therapy Market Volume (K Unit) Forecast, by Application 2019 & 2032
- Table 63: South Korea Home Infusion Therapy Market Revenue (Million) Forecast, by Application 2019 & 2032
- Table 64: South Korea Home Infusion Therapy Market Volume (K Unit) Forecast, by Application 2019 & 2032
- Table 65: Rest of Asia Pacific Home Infusion Therapy Market Revenue (Million) Forecast, by Application 2019 & 2032
- Table 66: Rest of Asia Pacific Home Infusion Therapy Market Volume (K Unit) Forecast, by Application 2019 & 2032
- Table 67: Global Home Infusion Therapy Market Revenue Million Forecast, by Product 2019 & 2032
- Table 68: Global Home Infusion Therapy Market Volume K Unit Forecast, by Product 2019 & 2032
- Table 69: Global Home Infusion Therapy Market Revenue Million Forecast, by Applications 2019 & 2032
- Table 70: Global Home Infusion Therapy Market Volume K Unit Forecast, by Applications 2019 & 2032
- Table 71: Global Home Infusion Therapy Market Revenue Million Forecast, by Country 2019 & 2032
- Table 72: Global Home Infusion Therapy Market Volume K Unit Forecast, by Country 2019 & 2032
- Table 73: GCC Home Infusion Therapy Market Revenue (Million) Forecast, by Application 2019 & 2032
- Table 74: GCC Home Infusion Therapy Market Volume (K Unit) Forecast, by Application 2019 & 2032
- Table 75: South Africa Home Infusion Therapy Market Revenue (Million) Forecast, by Application 2019 & 2032
- Table 76: South Africa Home Infusion Therapy Market Volume (K Unit) Forecast, by Application 2019 & 2032
- Table 77: Rest of Middle East and Africa Home Infusion Therapy Market Revenue (Million) Forecast, by Application 2019 & 2032
- Table 78: Rest of Middle East and Africa Home Infusion Therapy Market Volume (K Unit) Forecast, by Application 2019 & 2032
- Table 79: Global Home Infusion Therapy Market Revenue Million Forecast, by Product 2019 & 2032
- Table 80: Global Home Infusion Therapy Market Volume K Unit Forecast, by Product 2019 & 2032
- Table 81: Global Home Infusion Therapy Market Revenue Million Forecast, by Applications 2019 & 2032
- Table 82: Global Home Infusion Therapy Market Volume K Unit Forecast, by Applications 2019 & 2032
- Table 83: Global Home Infusion Therapy Market Revenue Million Forecast, by Country 2019 & 2032
- Table 84: Global Home Infusion Therapy Market Volume K Unit Forecast, by Country 2019 & 2032
- Table 85: Brazil Home Infusion Therapy Market Revenue (Million) Forecast, by Application 2019 & 2032
- Table 86: Brazil Home Infusion Therapy Market Volume (K Unit) Forecast, by Application 2019 & 2032
- Table 87: Argentina Home Infusion Therapy Market Revenue (Million) Forecast, by Application 2019 & 2032
- Table 88: Argentina Home Infusion Therapy Market Volume (K Unit) Forecast, by Application 2019 & 2032
- Table 89: Rest of South America Home Infusion Therapy Market Revenue (Million) Forecast, by Application 2019 & 2032
- Table 90: Rest of South America Home Infusion Therapy Market Volume (K Unit) Forecast, by Application 2019 & 2032
Frequently Asked Questions
1. What is the projected Compound Annual Growth Rate (CAGR) of the Home Infusion Therapy Market?
The projected CAGR is approximately 6.50%.
2. Which companies are prominent players in the Home Infusion Therapy Market?
Key companies in the market include Smiths Medical, ICU Medical Inc, Community Surgical Supply, Catholic Health Initiatives, Fresenius Kabi, Terumo Corporation, Nipro Corporation, Eli Lilly and Company, McLaren Health Care, Sutter Health, Option Care Health Inc, McKesson Medical-Surgical Inc, B Braun Melsungen AG, Baxter International, Becton Dickinson and Companies.
3. What are the main segments of the Home Infusion Therapy Market?
The market segments include Product, Applications.
4. Can you provide details about the market size?
The market size is estimated to be USD 24.40 Million as of 2022.
5. What are some drivers contributing to market growth?
Growing Number of Baby Boomers Suffering From Decreased Mobility; Growing Incidence of Hospital-acquired Infections; Increasing Adoption of Home Healthcare Coupled with Technological Advancements.
6. What are the notable trends driving market growth?
Anti-infective Therapy Dominates the Home Infusion Therapy Market.
7. Are there any restraints impacting market growth?
High Cost of Infusion Pumps; Safety Issues Associated with Infusion Pumps.
8. Can you provide examples of recent developments in the market?
January 2023: KORU Medical Systems, Inc. entered into a development agreement with a pharmaceutical manufacturer of subcutaneous immunoglobulin therapy (SCIg) to develop and seek regulatory approval for the Freedom Infusion System with a SCIg prefilled syringe. The Freedom Infusion System currently includes the Freddom60 and FreedomEdge Syringe Infusion Drivers, Precision Flow Rate Tubing, and HIgH-Flo Subcutaneous Safety Needle Sets. These devices are used for infusions administered in the home and alternate care settings.
9. What pricing options are available for accessing the report?
Pricing options include single-user, multi-user, and enterprise licenses priced at USD 4750, USD 5250, and USD 8750 respectively.
10. Is the market size provided in terms of value or volume?
The market size is provided in terms of value, measured in Million and volume, measured in K Unit.
11. Are there any specific market keywords associated with the report?
Yes, the market keyword associated with the report is "Home Infusion Therapy Market," which aids in identifying and referencing the specific market segment covered.
12. How do I determine which pricing option suits my needs best?
The pricing options vary based on user requirements and access needs. Individual users may opt for single-user licenses, while businesses requiring broader access may choose multi-user or enterprise licenses for cost-effective access to the report.
13. Are there any additional resources or data provided in the Home Infusion Therapy Market report?
While the report offers comprehensive insights, it's advisable to review the specific contents or supplementary materials provided to ascertain if additional resources or data are available.
14. How can I stay updated on further developments or reports in the Home Infusion Therapy Market?
To stay informed about further developments, trends, and reports in the Home Infusion Therapy Market, consider subscribing to industry newsletters, following relevant companies and organizations, or regularly checking reputable industry news sources and publications.
Methodology
Step 1 - Identification of Relevant Samples Size from Population Database


Step 2 - Approaches for Defining Global Market Size (Value, Volume* & Price*)

Note*: In applicable scenarios
Step 3 - Data Sources
Primary Research
- Web Analytics
- Survey Reports
- Research Institute
- Latest Research Reports
- Opinion Leaders
Secondary Research
- Annual Reports
- White Paper
- Latest Press Release
- Industry Association
- Paid Database
- Investor Presentations

Step 4 - Data Triangulation
Involves using different sources of information in order to increase the validity of a study
These sources are likely to be stakeholders in a program - participants, other researchers, program staff, other community members, and so on.
Then we put all data in single framework & apply various statistical tools to find out the dynamic on the market.
During the analysis stage, feedback from the stakeholder groups would be compared to determine areas of agreement as well as areas of divergence


