

Key Insights
The global Hydro Generators market is projected to reach $7 billion by 2025, growing at a Compound Annual Growth Rate (CAGR) of 4.3%. This expansion is driven by increasing global demand for clean energy, necessitating significant investments in hydropower infrastructure. Government initiatives for decarbonization and energy security are accelerating the development and refurbishment of hydroelectric power plants. Technological advancements in turbine efficiency, generator design, and grid integration enhance hydropower's competitiveness and reliability. The industry sees demand for both large-scale and decentralized hydropower solutions, supporting diverse energy needs.
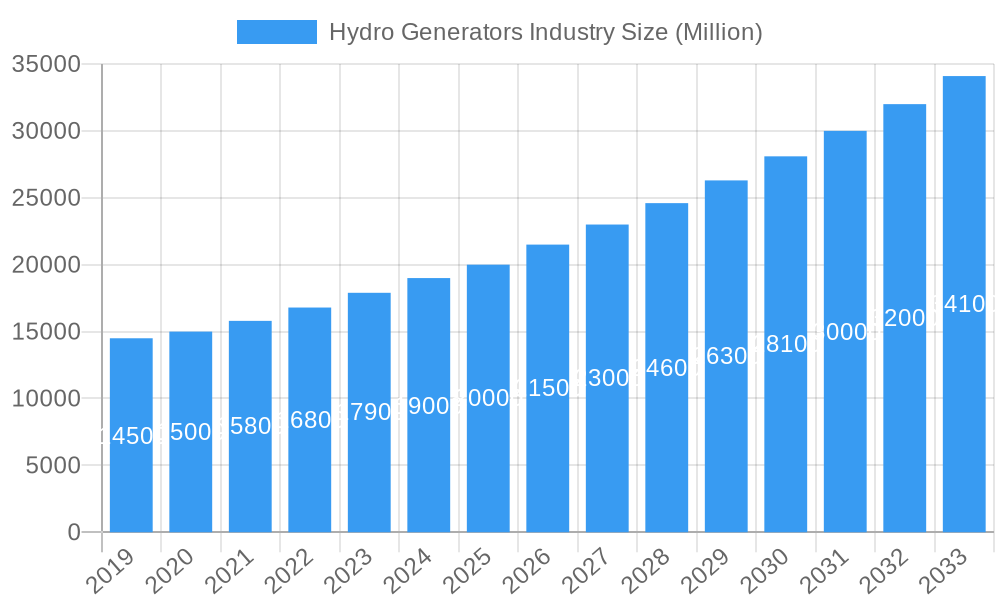
Hydro Generators Industry Market Size (In Billion)
Key market players such as Siemens AG, General Electric Company, and Andritz AG are leading innovation in high-efficiency, low-maintenance hydro generator solutions and comprehensive lifecycle services. Trends include the adoption of digital technologies for remote monitoring and predictive maintenance, alongside advanced control systems for optimized power output and grid stability. Restraints include high initial capital expenditure, lengthy permitting processes, and environmental concerns. However, the strong push for renewable energy, combined with technological progress and strategic investments, ensures a robust future for the Hydro Generators industry.
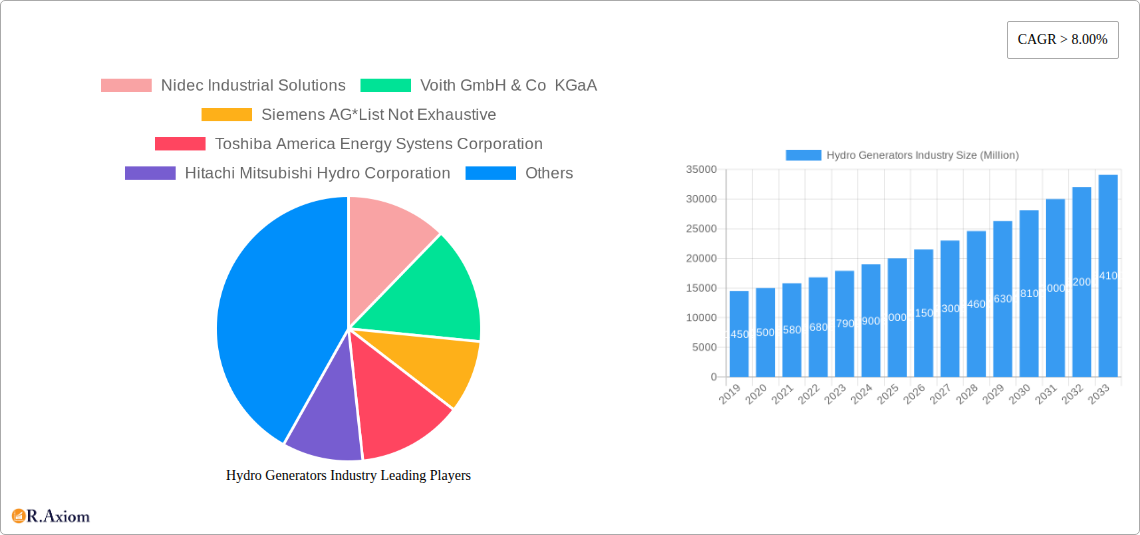
Hydro Generators Industry Company Market Share
This comprehensive report analyzes the global Hydro Generators industry from 2019 to 2033, with a base year of 2025. It offers critical insights into market concentration, technological innovation, regulatory frameworks, and emerging opportunities. Understand the key drivers, challenges, and strategic initiatives shaping the future of hydro generator manufacturers. This report is essential for investors, manufacturers, policymakers, and researchers focused on capitalizing on the advancements and market penetration of hydropower solutions.
Hydro Generators Industry Market Concentration & Innovation
The Hydro Generators industry exhibits moderate to high market concentration, with a few dominant players controlling a significant share of the global market. Innovation is a key differentiator, driven by the continuous pursuit of higher efficiency, increased reliability, and reduced environmental impact in hydropower generation. Advanced materials, digital control systems, and smart grid integration are at the forefront of technological advancements. Regulatory frameworks, particularly concerning environmental impact assessments and renewable energy mandates, play a crucial role in shaping market entry and operational standards. While direct product substitutes are limited for large-scale hydropower, advancements in other renewable energy sources like solar and wind power present indirect competition for overall energy generation capacity. End-user trends indicate a growing demand for decentralized power solutions and grid modernization, favoring adaptable and scalable hydro generator technologies. Mergers and acquisition (M&A) activities, while present, are often strategic, focusing on consolidating expertise, expanding product portfolios, or gaining access to new markets. Deal values are typically substantial, reflecting the capital-intensive nature of the hydro power sector. Key market share indicators reveal a competitive landscape where technological prowess and project execution capabilities are paramount.
Hydro Generators Industry Industry Trends & Insights
The Hydro Generators industry is experiencing robust growth, fueled by the global imperative for clean and sustainable energy solutions. Market growth drivers are multifaceted, encompassing rising electricity demand, government incentives for renewable energy adoption, and the inherent reliability and long operational lifespan of hydropower facilities. The industry is witnessing a Compound Annual Growth Rate (CAGR) of approximately 5.2% over the forecast period, reflecting sustained investment and development. Technological disruptions are transforming the sector, with advancements in turbine design, generator efficiency, and digital monitoring systems enhancing performance and reducing operational costs. There is a growing trend towards smart hydro solutions, enabling real-time data analysis, predictive maintenance, and seamless integration with national grids. Consumer preferences are increasingly leaning towards environmentally friendly energy sources, with hydropower being recognized for its low carbon footprint and its ability to provide baseload power. Competitive dynamics are characterized by fierce competition among established players and the emergence of innovative smaller firms specializing in niche segments like micro and pico-hydro. Market penetration is expected to deepen, particularly in developing economies with untapped hydropower potential and in regions undergoing significant infrastructure upgrades. The focus on energy security and independence further bolsters the demand for domestically sourced renewable energy, with hydro generators playing a pivotal role. The ongoing transition to a low-carbon economy necessitates substantial investment in renewable energy infrastructure, positioning hydro generators as a cornerstone of future energy portfolios. The development of pumped-storage hydropower for grid stabilization and energy storage also represents a significant growth avenue.
Dominant Markets & Segments in Hydro Generators Industry
The Large segment of the Hydro Generators industry holds dominance due to the scale of infrastructure projects and the substantial electricity output required to meet national energy demands. This dominance is driven by economic policies that prioritize large-scale renewable energy projects to achieve ambitious decarbonization targets and ensure energy security. Countries with significant river systems and a history of investing in hydropower, such as China, the United States, Canada, Brazil, and Norway, are leading markets.
- Key Drivers of Dominance in the Large Segment:
- Government Subsidies and Incentives: Favorable policies, feed-in tariffs, and tax credits for large-scale renewable energy projects significantly de-risk investments and accelerate development.
- Grid Stability and Baseload Power: Large hydropower plants are crucial for providing stable, baseload electricity, complementing intermittent renewable sources like solar and wind.
- Technological Maturity and Economies of Scale: The technology for large hydro generators is well-established, leading to economies of scale in manufacturing and installation, making them cost-competitive over their long lifespan.
- Water Resource Availability: Access to significant water resources and favorable topographical conditions are prerequisites for large hydropower development.
- International Funding and Development Banks: Global financial institutions often support large-scale hydropower projects in developing nations, facilitating their realization.
While the Large segment commands the largest market share in terms of installed capacity and investment value, the Small and Micro segments are experiencing significant growth and are crucial for decentralized power generation and energy access in remote areas.
- Small Segment (typically 1 MW to 10 MW): This segment caters to regional power needs, industrial applications, and powering remote communities. Growth drivers include the need for localized energy solutions and the decommissioning or upgrading of older, smaller hydropower facilities.
- Micro Segment (typically less than 100 kW): The micro-hydro segment is experiencing rapid expansion due to its applicability in off-grid solutions, agricultural irrigation systems, and its low environmental footprint. Technological advancements have made these systems more accessible and efficient, driving adoption in developing countries and for individual or community-based power generation.
Hydro Generators Industry Product Developments
Product developments in the Hydro Generators industry are focused on enhancing efficiency, reliability, and adaptability. Innovations include advanced composite materials for turbine blades, optimized generator designs for variable water flow, and the integration of digital technologies for real-time monitoring and predictive maintenance. These advancements aim to reduce operational costs, extend equipment lifespan, and minimize environmental impact. Competitive advantages are being gained through tailored solutions for specific site conditions and the development of hybrid systems that integrate with other renewable energy sources. The market is witnessing a rise in modular designs, facilitating easier installation and maintenance.
Report Scope & Segmentation Analysis
This report segments the Hydro Generators industry by size, encompassing Large, Small, and Micro categories.
The Large hydro generator segment, typically exceeding 10 MW, represents the largest market share due to its role in utility-scale power generation. This segment is expected to witness sustained growth driven by the need for baseload power and grid stability.
The Small hydro generator segment, ranging from 1 MW to 10 MW, is crucial for regional power grids and industrial applications, offering a balance between capacity and adaptability. This segment is anticipated to grow steadily as demand for distributed energy solutions increases.
The Micro hydro generator segment, under 1 MW (often less than 100 kW), is experiencing the fastest growth. Its appeal lies in providing off-grid power solutions, supporting agricultural needs, and serving remote communities, driven by cost-effectiveness and ease of deployment.
Key Drivers of Hydro Generators Industry Growth
The Hydro Generators industry is propelled by several key growth drivers. Foremost is the global transition towards renewable energy sources, with hydropower recognized for its low carbon footprint and reliability. Government policies promoting clean energy, including subsidies, tax incentives, and renewable portfolio standards, are significant catalysts. The increasing demand for electricity, especially in developing economies, necessitates the expansion of power generation capacity, where hydropower offers a sustainable solution. Technological advancements leading to improved efficiency and reduced costs of hydro generator systems also contribute to market expansion. Furthermore, the growing emphasis on energy security and the desire to reduce reliance on fossil fuels further bolster the demand for hydropower.
Challenges in the Hydro Generators Industry Sector
Despite its growth potential, the Hydro Generators industry faces several challenges. The substantial upfront capital investment required for large-scale hydropower projects can be a significant barrier. Environmental concerns, including the impact on aquatic ecosystems, sedimentation, and potential displacement of communities, often lead to lengthy and complex regulatory approval processes. The intermittency of water flow due to seasonal variations and drought conditions can affect power generation consistency. Furthermore, competition from other renewable energy sources, such as solar and wind power, which may have lower initial installation costs in certain regions, presents a challenge. Supply chain disruptions for critical components and the need for specialized engineering expertise also add to the complexities.
Emerging Opportunities in Hydro Generators Industry
Emerging opportunities in the Hydro Generators industry are vast and varied. The increasing focus on grid modernization and energy storage presents a significant avenue for growth, particularly with pumped-storage hydropower. The development of smaller, more efficient, and environmentally friendly hydro generator technologies is opening up new markets for micro and pico-hydro solutions, especially in remote and off-grid areas. Digitalization and the adoption of smart technologies for remote monitoring, predictive maintenance, and grid integration are creating opportunities for value-added services. Furthermore, the refurbishment and upgrading of existing hydropower facilities offer substantial business prospects, enhancing efficiency and extending the lifespan of current assets. The growing interest in decentralized energy systems and the electrification of rural areas are also key drivers for innovation and market expansion.
Leading Players in the Hydro Generators Industry Market
- Nidec Industrial Solutions
- Voith GmbH & Co KGaA
- Siemens AG
- Toshiba America Energy Systens Corporation
- Hitachi Mitsubishi Hydro Corporation
- OJSC Power Machines
- General Electric Company
- Global Hydro Energy GmbH
- Andritz AG
- WEG SA
Key Developments in Hydro Generators Industry Industry
- January 2022: GE Renewable Energy and Avista Utilities entered into a service agreement to update four generator units at the Long Lake hydropower facility in the United States. Upon completion, the renovated plant will boast an installed capacity exceeding 100 MW, sufficient to power approximately 80,000 homes. This development highlights the industry's focus on upgrading existing infrastructure for enhanced capacity and efficiency.
- March 2022: A Japanese multinational imaging and electronics company introduced a pico-hydro generation system designed for use with irrigation canals and industrial drainage systems. This innovation underscores the expanding applications of hydropower, particularly for smaller-scale, decentralized energy generation solutions. Pico-hydro systems, defined as having a capacity of less than 5 kW, are becoming increasingly important for providing power in niche applications.
Strategic Outlook for Hydro Generators Industry Market
The strategic outlook for the Hydro Generators industry remains highly positive, driven by the undeniable global shift towards sustainable energy. The report anticipates continued investment in both new large-scale hydropower projects and the modernization of existing facilities. Opportunities lie in developing more efficient, modular, and digitally integrated hydro generator systems that cater to diverse energy needs, from utility-scale power to decentralized micro-grids. The growing emphasis on energy storage solutions will further solidify hydropower's role, particularly through pumped storage. Strategic partnerships, technological innovation, and a focus on environmental sustainability will be critical for market leaders to maintain their competitive edge and capitalize on the expanding global demand for clean, reliable hydropower. The forecast period is set to witness a significant expansion in market penetration, especially in emerging economies.
Hydro Generators Industry Segmentation
-
1. Size
- 1.1. Large
- 1.2. Small
- 1.3. Micro
Hydro Generators Industry Segmentation By Geography
- 1. North America
- 2. Asia Pacific
- 3. Europe
- 4. South America
- 5. Middle East
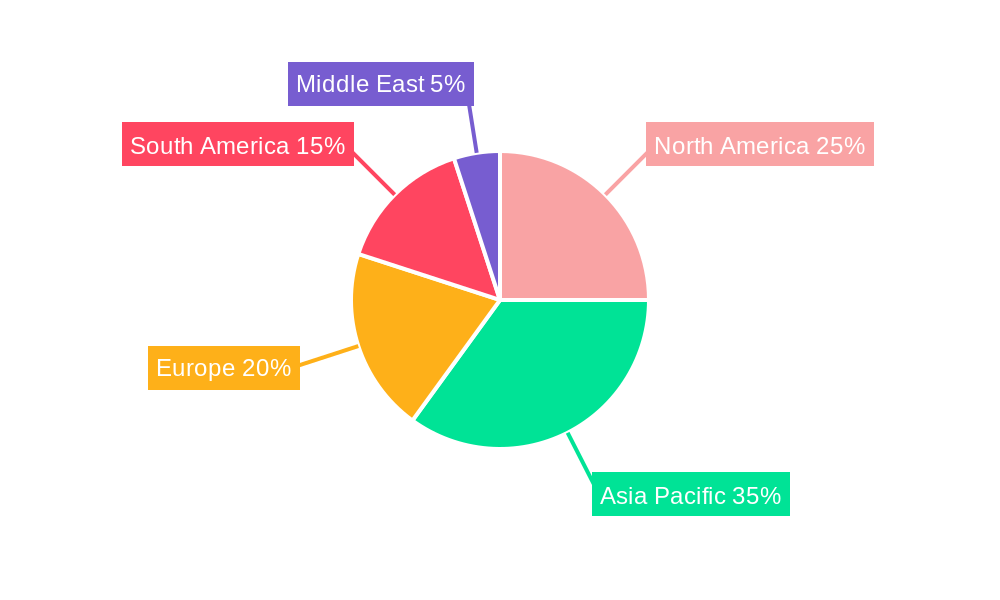
Hydro Generators Industry Regional Market Share
Geographic Coverage of Hydro Generators Industry
Hydro Generators Industry REPORT HIGHLIGHTS
| Aspects | Details |
|---|---|
| Study Period | 2020-2034 |
| Base Year | 2025 |
| Estimated Year | 2026 |
| Forecast Period | 2026-2034 |
| Historical Period | 2020-2025 |
| Growth Rate | CAGR of 4.3% from 2020-2034 |
| Segmentation |
|
Table of Contents
- 1. Introduction
- 1.1. Research Scope
- 1.2. Market Segmentation
- 1.3. Research Objective
- 1.4. Definitions and Assumptions
- 2. Executive Summary
- 2.1. Market Snapshot
- 3. Market Dynamics
- 3.1. Market Drivers
- 3.2. Market Restrains
- 3.3. Market Trends
- 3.4. Market Opportunities
- 4. Market Factor Analysis
- 4.1. Porters Five Forces
- 4.1.1. Bargaining Power of Suppliers
- 4.1.2. Bargaining Power of Buyers
- 4.1.3. Threat of New Entrants
- 4.1.4. Threat of Substitutes
- 4.1.5. Competitive Rivalry
- 4.2. PESTEL analysis
- 4.3. BCG Analysis
- 4.3.1. Stars (High Growth, High Market Share)
- 4.3.2. Cash Cows (Low Growth, High Market Share)
- 4.3.3. Question Mark (High Growth, Low Market Share)
- 4.3.4. Dogs (Low Growth, Low Market Share)
- 4.4. Ansoff Matrix Analysis
- 4.5. Supply Chain Analysis
- 4.6. Regulatory Landscape
- 4.7. Current Market Potential and Opportunity Assessment (TAM–SAM–SOM Framework)
- 4.8. RAX Analyst Note
- 4.1. Porters Five Forces
- 5. Market Analysis, Insights and Forecast 2021-2033
- 5.1. Market Analysis, Insights and Forecast - by Size
- 5.1.1. Large
- 5.1.2. Small
- 5.1.3. Micro
- 5.2. Market Analysis, Insights and Forecast - by Region
- 5.2.1. North America
- 5.2.2. Asia Pacific
- 5.2.3. Europe
- 5.2.4. South America
- 5.2.5. Middle East
- 5.1. Market Analysis, Insights and Forecast - by Size
- 6. Global Hydro Generators Industry Analysis, Insights and Forecast, 2021-2033
- 6.1. Market Analysis, Insights and Forecast - by Size
- 6.1.1. Large
- 6.1.2. Small
- 6.1.3. Micro
- 6.1. Market Analysis, Insights and Forecast - by Size
- 7. North America Hydro Generators Industry Analysis, Insights and Forecast, 2020-2032
- 7.1. Market Analysis, Insights and Forecast - by Size
- 7.1.1. Large
- 7.1.2. Small
- 7.1.3. Micro
- 7.1. Market Analysis, Insights and Forecast - by Size
- 8. Asia Pacific Hydro Generators Industry Analysis, Insights and Forecast, 2020-2032
- 8.1. Market Analysis, Insights and Forecast - by Size
- 8.1.1. Large
- 8.1.2. Small
- 8.1.3. Micro
- 8.1. Market Analysis, Insights and Forecast - by Size
- 9. Europe Hydro Generators Industry Analysis, Insights and Forecast, 2020-2032
- 9.1. Market Analysis, Insights and Forecast - by Size
- 9.1.1. Large
- 9.1.2. Small
- 9.1.3. Micro
- 9.1. Market Analysis, Insights and Forecast - by Size
- 10. South America Hydro Generators Industry Analysis, Insights and Forecast, 2020-2032
- 10.1. Market Analysis, Insights and Forecast - by Size
- 10.1.1. Large
- 10.1.2. Small
- 10.1.3. Micro
- 10.1. Market Analysis, Insights and Forecast - by Size
- 11. Middle East Hydro Generators Industry Analysis, Insights and Forecast, 2020-2032
- 11.1. Market Analysis, Insights and Forecast - by Size
- 11.1.1. Large
- 11.1.2. Small
- 11.1.3. Micro
- 11.1. Market Analysis, Insights and Forecast - by Size
- 12. Competitive Analysis
- 12.1. Company Profiles
- 12.1.1 Nidec Industrial Solutions
- 12.1.1.1. Company Overview
- 12.1.1.2. Products
- 12.1.1.3. Company Financials
- 12.1.1.4. SWOT Analysis
- 12.1.2 Voith GmbH & Co KGaA
- 12.1.2.1. Company Overview
- 12.1.2.2. Products
- 12.1.2.3. Company Financials
- 12.1.2.4. SWOT Analysis
- 12.1.3 Siemens AG*List Not Exhaustive
- 12.1.3.1. Company Overview
- 12.1.3.2. Products
- 12.1.3.3. Company Financials
- 12.1.3.4. SWOT Analysis
- 12.1.4 Toshiba America Energy Systens Corporation
- 12.1.4.1. Company Overview
- 12.1.4.2. Products
- 12.1.4.3. Company Financials
- 12.1.4.4. SWOT Analysis
- 12.1.5 Hitachi Mitsubishi Hydro Corporation
- 12.1.5.1. Company Overview
- 12.1.5.2. Products
- 12.1.5.3. Company Financials
- 12.1.5.4. SWOT Analysis
- 12.1.6 OJSC Power Machines
- 12.1.6.1. Company Overview
- 12.1.6.2. Products
- 12.1.6.3. Company Financials
- 12.1.6.4. SWOT Analysis
- 12.1.7 General Electric Company
- 12.1.7.1. Company Overview
- 12.1.7.2. Products
- 12.1.7.3. Company Financials
- 12.1.7.4. SWOT Analysis
- 12.1.8 Global Hydro Energy GmbH
- 12.1.8.1. Company Overview
- 12.1.8.2. Products
- 12.1.8.3. Company Financials
- 12.1.8.4. SWOT Analysis
- 12.1.9 Andritz AG
- 12.1.9.1. Company Overview
- 12.1.9.2. Products
- 12.1.9.3. Company Financials
- 12.1.9.4. SWOT Analysis
- 12.1.10 WEG SA
- 12.1.10.1. Company Overview
- 12.1.10.2. Products
- 12.1.10.3. Company Financials
- 12.1.10.4. SWOT Analysis
- 12.1.1 Nidec Industrial Solutions
- 12.2. Market Entropy
- 12.2.1 Company's Key Areas Served
- 12.2.2 Recent Developments
- 12.3. Company Market Share Analysis 2025
- 12.3.1 Top 5 Companies Market Share Analysis
- 12.3.2 Top 3 Companies Market Share Analysis
- 12.4. List of Potential Customers
- 13. Research Methodology
List of Figures
- Figure 1: Global Hydro Generators Industry Revenue Breakdown (billion, %) by Region 2025 & 2033
- Figure 2: North America Hydro Generators Industry Revenue (billion), by Size 2025 & 2033
- Figure 3: North America Hydro Generators Industry Revenue Share (%), by Size 2025 & 2033
- Figure 4: North America Hydro Generators Industry Revenue (billion), by Country 2025 & 2033
- Figure 5: North America Hydro Generators Industry Revenue Share (%), by Country 2025 & 2033
- Figure 6: Asia Pacific Hydro Generators Industry Revenue (billion), by Size 2025 & 2033
- Figure 7: Asia Pacific Hydro Generators Industry Revenue Share (%), by Size 2025 & 2033
- Figure 8: Asia Pacific Hydro Generators Industry Revenue (billion), by Country 2025 & 2033
- Figure 9: Asia Pacific Hydro Generators Industry Revenue Share (%), by Country 2025 & 2033
- Figure 10: Europe Hydro Generators Industry Revenue (billion), by Size 2025 & 2033
- Figure 11: Europe Hydro Generators Industry Revenue Share (%), by Size 2025 & 2033
- Figure 12: Europe Hydro Generators Industry Revenue (billion), by Country 2025 & 2033
- Figure 13: Europe Hydro Generators Industry Revenue Share (%), by Country 2025 & 2033
- Figure 14: South America Hydro Generators Industry Revenue (billion), by Size 2025 & 2033
- Figure 15: South America Hydro Generators Industry Revenue Share (%), by Size 2025 & 2033
- Figure 16: South America Hydro Generators Industry Revenue (billion), by Country 2025 & 2033
- Figure 17: South America Hydro Generators Industry Revenue Share (%), by Country 2025 & 2033
- Figure 18: Middle East Hydro Generators Industry Revenue (billion), by Size 2025 & 2033
- Figure 19: Middle East Hydro Generators Industry Revenue Share (%), by Size 2025 & 2033
- Figure 20: Middle East Hydro Generators Industry Revenue (billion), by Country 2025 & 2033
- Figure 21: Middle East Hydro Generators Industry Revenue Share (%), by Country 2025 & 2033
List of Tables
- Table 1: Global Hydro Generators Industry Revenue billion Forecast, by Size 2020 & 2033
- Table 2: Global Hydro Generators Industry Revenue billion Forecast, by Region 2020 & 2033
- Table 3: Global Hydro Generators Industry Revenue billion Forecast, by Size 2020 & 2033
- Table 4: Global Hydro Generators Industry Revenue billion Forecast, by Country 2020 & 2033
- Table 5: Global Hydro Generators Industry Revenue billion Forecast, by Size 2020 & 2033
- Table 6: Global Hydro Generators Industry Revenue billion Forecast, by Country 2020 & 2033
- Table 7: Global Hydro Generators Industry Revenue billion Forecast, by Size 2020 & 2033
- Table 8: Global Hydro Generators Industry Revenue billion Forecast, by Country 2020 & 2033
- Table 9: Global Hydro Generators Industry Revenue billion Forecast, by Size 2020 & 2033
- Table 10: Global Hydro Generators Industry Revenue billion Forecast, by Country 2020 & 2033
- Table 11: Global Hydro Generators Industry Revenue billion Forecast, by Size 2020 & 2033
- Table 12: Global Hydro Generators Industry Revenue billion Forecast, by Country 2020 & 2033
Frequently Asked Questions
1. What is the projected Compound Annual Growth Rate (CAGR) of the Hydro Generators Industry?
The projected CAGR is approximately 4.3%.
2. Which companies are prominent players in the Hydro Generators Industry?
Key companies in the market include Nidec Industrial Solutions, Voith GmbH & Co KGaA, Siemens AG*List Not Exhaustive, Toshiba America Energy Systens Corporation, Hitachi Mitsubishi Hydro Corporation, OJSC Power Machines, General Electric Company, Global Hydro Energy GmbH, Andritz AG, WEG SA.
3. What are the main segments of the Hydro Generators Industry?
The market segments include Size.
4. Can you provide details about the market size?
The market size is estimated to be USD 7 billion as of 2022.
5. What are some drivers contributing to market growth?
4.; Increasing Population Growth and Infrastructure Development.
6. What are the notable trends driving market growth?
Large Hydro Generator as a Prominent Segment.
7. Are there any restraints impacting market growth?
4.; High Operational and Maintenance Costs.
8. Can you provide examples of recent developments in the market?
In January 2022, In order to update four generator units at the Long Lake hydropower facility in the United States, GE Renewable Energy, and Avista Utilities, a US energy company serving four northwest states, entered into a service agreement. After the renovation project is finished, the plant will have an installed capacity that exceeds 100 MW. This quantity of energy can supply all the electricity that 80,000 houses would need.
9. What pricing options are available for accessing the report?
Pricing options include single-user, multi-user, and enterprise licenses priced at USD 4750, USD 5250, and USD 8750 respectively.
10. Is the market size provided in terms of value or volume?
The market size is provided in terms of value, measured in billion.
11. Are there any specific market keywords associated with the report?
Yes, the market keyword associated with the report is "Hydro Generators Industry," which aids in identifying and referencing the specific market segment covered.
12. How do I determine which pricing option suits my needs best?
The pricing options vary based on user requirements and access needs. Individual users may opt for single-user licenses, while businesses requiring broader access may choose multi-user or enterprise licenses for cost-effective access to the report.
13. Are there any additional resources or data provided in the Hydro Generators Industry report?
While the report offers comprehensive insights, it's advisable to review the specific contents or supplementary materials provided to ascertain if additional resources or data are available.
14. How can I stay updated on further developments or reports in the Hydro Generators Industry?
To stay informed about further developments, trends, and reports in the Hydro Generators Industry, consider subscribing to industry newsletters, following relevant companies and organizations, or regularly checking reputable industry news sources and publications.
Methodology
Step 1 - Identification of Relevant Samples Size from Population Database


Step 2 - Approaches for Defining Global Market Size (Value, Volume* & Price*)

Note*: In applicable scenarios
Step 3 - Data Sources
Primary Research
- Web Analytics
- Survey Reports
- Research Institute
- Latest Research Reports
- Opinion Leaders
Secondary Research
- Annual Reports
- White Paper
- Latest Press Release
- Industry Association
- Paid Database
- Investor Presentations

Step 4 - Data Triangulation
Involves using different sources of information in order to increase the validity of a study
These sources are likely to be stakeholders in a program - participants, other researchers, program staff, other community members, and so on.
Then we put all data in single framework & apply various statistical tools to find out the dynamic on the market.
During the analysis stage, feedback from the stakeholder groups would be compared to determine areas of agreement as well as areas of divergence