
Key Insights
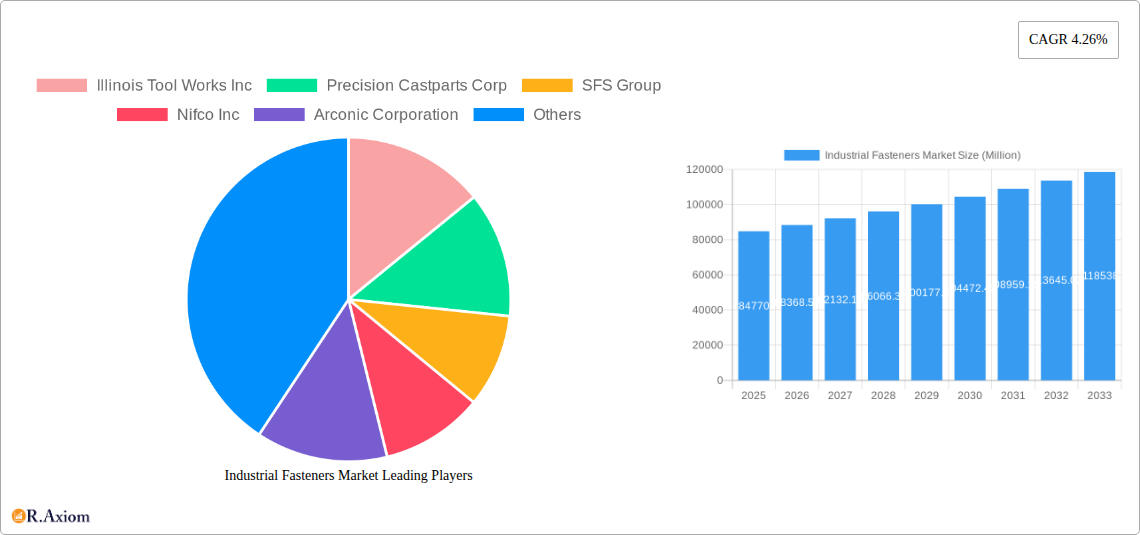
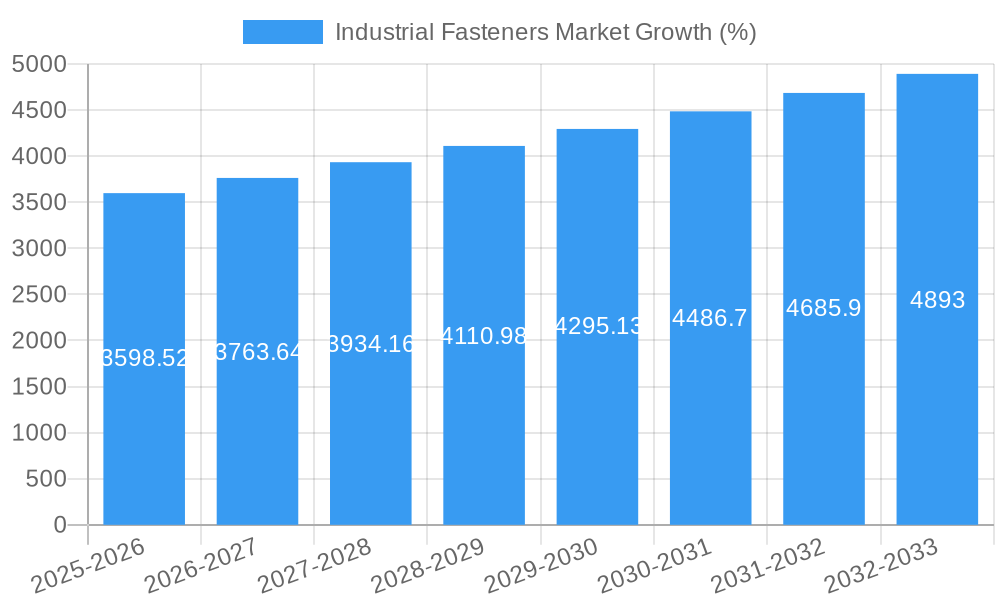
The global industrial fasteners market, valued at $84.77 billion in 2025, is projected to experience steady growth, driven by a Compound Annual Growth Rate (CAGR) of 4.26% from 2025 to 2033. This expansion is fueled by several key factors. Firstly, the burgeoning automotive and aerospace sectors are significant consumers of high-performance fasteners, demanding innovation in materials and design. The ongoing growth in construction and infrastructure projects globally, particularly in developing economies, contributes substantially to market demand. Furthermore, the increasing adoption of automation and robotics in manufacturing processes necessitates reliable and durable fastening solutions, further bolstering market growth. The rise of e-commerce and the increasing demand for customized fastening solutions are also contributing factors. While material price fluctuations and supply chain disruptions present challenges, the overall market outlook remains positive, driven by long-term industrial growth trends.
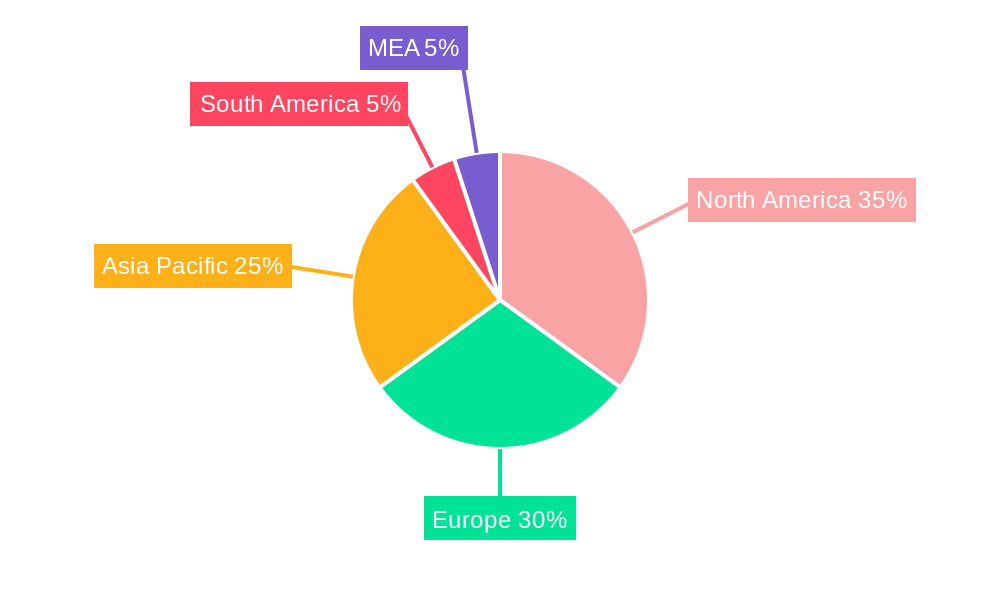
Market segmentation reveals that externally threaded fasteners hold the largest share, followed by internally threaded fasteners and non-threaded fasteners. Metal remains the dominant raw material, reflecting its superior strength and durability. Geographically, North America and Europe currently hold significant market shares, but the Asia-Pacific region, particularly China and India, exhibits the highest growth potential due to rapid industrialization and infrastructure development. Key players in the market include Illinois Tool Works, Precision Castparts, SFS Group, and others, actively engaged in product innovation, strategic partnerships, and expansion into emerging markets to gain a competitive edge. While competition is intense, opportunities exist for companies specializing in sustainable, high-performance fasteners and those offering comprehensive solutions integrating design, manufacturing, and supply chain management. The market's future hinges on technological advancements, sustainable practices, and the ability to adapt to evolving industry needs.
Industrial Fasteners Market: A Comprehensive Report (2019-2033)
This in-depth report provides a comprehensive analysis of the Industrial Fasteners Market, offering valuable insights for industry stakeholders, investors, and strategic decision-makers. The study covers the period from 2019 to 2033, with 2025 serving as the base and estimated year. The report meticulously examines market dynamics, segment performance, competitive landscape, and future growth prospects. The market size is projected to reach xx Million by 2033, exhibiting a CAGR of xx% during the forecast period (2025-2033).
Industrial Fasteners Market Market Concentration & Innovation
The Industrial Fasteners Market is characterized by a moderately concentrated landscape, with several multinational corporations holding significant market share. Illinois Tool Works Inc, Precision Castparts Corp, and SFS Group are among the leading players, collectively accounting for approximately xx% of the global market in 2025. Market concentration is influenced by factors such as economies of scale, technological advancements, and brand recognition.
Innovation plays a crucial role, driven by the need for improved performance, durability, and cost-effectiveness. Key innovation drivers include the development of lightweight materials, advanced manufacturing processes (e.g., 3D printing), and the integration of smart technologies. Stringent regulatory frameworks related to material safety and environmental compliance also influence innovation. The market witnesses frequent mergers and acquisitions (M&A) activities, with deal values exceeding xx Million in recent years. These activities aim to expand product portfolios, enhance manufacturing capabilities, and gain market share.
- Market Share Concentration: Top 3 players hold approximately xx%.
- M&A Activity: Deal values exceeding xx Million annually (2019-2024).
- Innovation Drivers: Lightweight materials, advanced manufacturing, smart technologies.
- Regulatory Influence: Compliance with safety and environmental standards.
Industrial Fasteners Market Industry Trends & Insights
The Industrial Fasteners Market is experiencing robust growth, driven by increasing industrialization, infrastructure development, and the expansion of end-use sectors such as automotive, aerospace, and construction. Technological advancements, particularly in materials science and manufacturing processes, are further propelling market growth. Consumer preferences are shifting towards high-performance, lightweight fasteners with enhanced durability and reliability. The competitive landscape is intensely dynamic, with companies focusing on product differentiation, cost optimization, and strategic partnerships to maintain a competitive edge. The market exhibits a high degree of fragmentation, with numerous regional and specialized players catering to niche segments. The automotive segment holds a significant market share, driven by increasing vehicle production and the adoption of advanced materials in automotive manufacturing.
The market penetration of innovative fasteners, such as aerospace grade fasteners, is gradually increasing. However, challenges remain, including fluctuations in raw material prices, supply chain disruptions, and economic downturns. The increasing adoption of sustainable manufacturing practices is a notable trend, with companies striving to reduce their environmental footprint.
Dominant Markets & Segments in Industrial Fasteners Market
The Asia-Pacific region is the dominant market for industrial fasteners, driven by rapid industrialization, significant infrastructure development, and a burgeoning automotive sector. China and India are key contributors to regional growth.
By Application:
- Automotive: High volume, driven by vehicle production growth. Key drivers include increasing vehicle production and adoption of lightweight materials.
- Aerospace: Stringent quality and safety standards drive demand for aerospace-grade fasteners. Key drivers include technological advancements in aerospace and increasing defense expenditure.
- Building and Construction: Significant market share, linked to infrastructure development globally. Key drivers include government investment in infrastructure and rising construction activity.
- Industrial Machinery: Steady growth, driven by industrial automation and manufacturing expansion. Key drivers include expansion of manufacturing industries and industrial automation.
- Home Appliances: Moderate growth, driven by increasing demand for durable and high-quality appliances. Key drivers include increasing disposable income and demand for modern appliances.
- Plumbing Products: Stable growth driven by residential and commercial construction. Key drivers include increasing urbanization and renovation projects.
- Other Applications: Includes various smaller segments with niche demand.
By Raw Materials:
- Metal: Dominates the market due to strength, durability, and versatility.
- Plastic: Growing segment, driven by cost-effectiveness and lightweight properties.
By Products:
- Externally threaded fasteners: Largest segment, widely used across various applications.
- Internally threaded fasteners: Significant market share, complementing externally threaded fasteners.
- Non-threaded fasteners: Niche applications, offering unique fastening solutions.
- Aerospace grade fasteners: High-growth segment, driven by stringent quality and safety requirements.
Industrial Fasteners Market Product Developments
Recent product innovations focus on enhanced strength, lightweight designs, corrosion resistance, and improved fastening techniques. The integration of smart sensors and data analytics is emerging as a key trend, enabling real-time monitoring of fastener performance and predictive maintenance. These advancements cater to the evolving needs of diverse industries, offering competitive advantages in terms of performance, safety, and cost-effectiveness.
Report Scope & Segmentation Analysis
This report provides a comprehensive segmentation analysis of the Industrial Fasteners Market by application (automotive, aerospace, building and construction, industrial machinery, home appliances, plumbing products, other applications), raw materials (metal, plastic), and product types (externally threaded fasteners, internally threaded fasteners, non-threaded fasteners, aerospace grade fasteners). Each segment's market size, growth projections, and competitive dynamics are analyzed in detail, providing valuable insights into the market's structure and future trends. Growth projections vary significantly across segments, reflecting differing industry dynamics and demand drivers.
Key Drivers of Industrial Fasteners Market Growth
The growth of the Industrial Fasteners Market is primarily driven by technological advancements in materials science and manufacturing, leading to the development of higher-performance and more cost-effective fasteners. Economic factors such as global infrastructure development and increasing industrial output are also major contributors. Favorable government policies promoting industrial growth and infrastructure investment further fuel market expansion.
Challenges in the Industrial Fasteners Market Sector
The Industrial Fasteners Market faces several challenges, including fluctuations in raw material prices, impacting production costs and profitability. Supply chain disruptions can significantly affect production and delivery timelines. Intense competition from both established players and new entrants requires continuous innovation and cost optimization to maintain market share.
Emerging Opportunities in Industrial Fasteners Market
Emerging opportunities exist in the development of sustainable and eco-friendly fasteners, catering to growing environmental concerns. The integration of smart technologies into fasteners, enabling real-time monitoring and predictive maintenance, offers significant potential for market expansion. Expansion into new and emerging markets presents further growth opportunities.
Leading Players in the Industrial Fasteners Market Market
- Illinois Tool Works Inc
- Precision Castparts Corp
- SFS Group
- Nifco Inc
- Arconic Corporation
- MacLean-Fogg Company
- Stanley Black & Decker Inc
- Acument Global Technologies Inc
- MISUMI Group Inc
- LISI Group
- Hilti Corporation
Key Developments in Industrial Fasteners Market Industry
- March 2022: Birmingham Fastener acquired K-T Bolt Manufacturing, Inc., expanding its product range and manufacturing capabilities.
- January 2022: Dokka Fasteners established a manufacturing unit in Klaipėda, Lithuania, expanding its European operations.
Strategic Outlook for Industrial Fasteners Market Market
The Industrial Fasteners Market is poised for continued growth, driven by ongoing industrialization, infrastructure development, and technological advancements. Opportunities exist in developing innovative, sustainable, and smart fasteners, catering to the evolving needs of various industries. Strategic partnerships, investments in research and development, and expansion into new markets will be crucial for companies seeking to capitalize on future growth potential.
Industrial Fasteners Market Segmentation
-
1. Raw Materials
- 1.1. Metal
- 1.2. Plastic
-
2. Products
- 2.1. Externally threaded fasteners
- 2.2. Internally threaded fasteners
- 2.3. Non-threaded fasteners
- 2.4. Aerospace grade fasteners
-
3. Application
- 3.1. Automotive
- 3.2. Aerospace
- 3.3. Building and Construction
- 3.4. Industrial Machinery
- 3.5. Home Appliances
- 3.6. Plumbing Products
- 3.7. Other Applications
Industrial Fasteners Market Segmentation By Geography
- 1. North America
- 2. Europe
- 3. Asia
- 4. Australia and New Zealand
- 5. Latin America
- 6. Middle East and Africa
Industrial Fasteners Market REPORT HIGHLIGHTS
| Aspects | Details |
|---|---|
| Study Period | 2019-2033 |
| Base Year | 2024 |
| Estimated Year | 2025 |
| Forecast Period | 2025-2033 |
| Historical Period | 2019-2024 |
| Growth Rate | CAGR of 4.26% from 2019-2033 |
| Segmentation |
|
Table of Contents
- 1. Introduction
- 1.1. Research Scope
- 1.2. Market Segmentation
- 1.3. Research Methodology
- 1.4. Definitions and Assumptions
- 2. Executive Summary
- 2.1. Introduction
- 3. Market Dynamics
- 3.1. Introduction
- 3.2. Market Drivers
- 3.2.1. Strong Revival in the Construction and Automotive Markets; Rapid Technological Advancement and Increased Spending in R&D
- 3.3. Market Restrains
- 3.3.1. Challenges Associated With LED Driver Failure and High Cost Associated With Installation
- 3.4. Market Trends
- 3.4.1. Metal Segment to Dominate the Market
- 4. Market Factor Analysis
- 4.1. Porters Five Forces
- 4.2. Supply/Value Chain
- 4.3. PESTEL analysis
- 4.4. Market Entropy
- 4.5. Patent/Trademark Analysis
- 5. Global Industrial Fasteners Market Analysis, Insights and Forecast, 2019-2031
- 5.1. Market Analysis, Insights and Forecast - by Raw Materials
- 5.1.1. Metal
- 5.1.2. Plastic
- 5.2. Market Analysis, Insights and Forecast - by Products
- 5.2.1. Externally threaded fasteners
- 5.2.2. Internally threaded fasteners
- 5.2.3. Non-threaded fasteners
- 5.2.4. Aerospace grade fasteners
- 5.3. Market Analysis, Insights and Forecast - by Application
- 5.3.1. Automotive
- 5.3.2. Aerospace
- 5.3.3. Building and Construction
- 5.3.4. Industrial Machinery
- 5.3.5. Home Appliances
- 5.3.6. Plumbing Products
- 5.3.7. Other Applications
- 5.4. Market Analysis, Insights and Forecast - by Region
- 5.4.1. North America
- 5.4.2. Europe
- 5.4.3. Asia
- 5.4.4. Australia and New Zealand
- 5.4.5. Latin America
- 5.4.6. Middle East and Africa
- 5.1. Market Analysis, Insights and Forecast - by Raw Materials
- 6. North America Industrial Fasteners Market Analysis, Insights and Forecast, 2019-2031
- 6.1. Market Analysis, Insights and Forecast - by Raw Materials
- 6.1.1. Metal
- 6.1.2. Plastic
- 6.2. Market Analysis, Insights and Forecast - by Products
- 6.2.1. Externally threaded fasteners
- 6.2.2. Internally threaded fasteners
- 6.2.3. Non-threaded fasteners
- 6.2.4. Aerospace grade fasteners
- 6.3. Market Analysis, Insights and Forecast - by Application
- 6.3.1. Automotive
- 6.3.2. Aerospace
- 6.3.3. Building and Construction
- 6.3.4. Industrial Machinery
- 6.3.5. Home Appliances
- 6.3.6. Plumbing Products
- 6.3.7. Other Applications
- 6.1. Market Analysis, Insights and Forecast - by Raw Materials
- 7. Europe Industrial Fasteners Market Analysis, Insights and Forecast, 2019-2031
- 7.1. Market Analysis, Insights and Forecast - by Raw Materials
- 7.1.1. Metal
- 7.1.2. Plastic
- 7.2. Market Analysis, Insights and Forecast - by Products
- 7.2.1. Externally threaded fasteners
- 7.2.2. Internally threaded fasteners
- 7.2.3. Non-threaded fasteners
- 7.2.4. Aerospace grade fasteners
- 7.3. Market Analysis, Insights and Forecast - by Application
- 7.3.1. Automotive
- 7.3.2. Aerospace
- 7.3.3. Building and Construction
- 7.3.4. Industrial Machinery
- 7.3.5. Home Appliances
- 7.3.6. Plumbing Products
- 7.3.7. Other Applications
- 7.1. Market Analysis, Insights and Forecast - by Raw Materials
- 8. Asia Industrial Fasteners Market Analysis, Insights and Forecast, 2019-2031
- 8.1. Market Analysis, Insights and Forecast - by Raw Materials
- 8.1.1. Metal
- 8.1.2. Plastic
- 8.2. Market Analysis, Insights and Forecast - by Products
- 8.2.1. Externally threaded fasteners
- 8.2.2. Internally threaded fasteners
- 8.2.3. Non-threaded fasteners
- 8.2.4. Aerospace grade fasteners
- 8.3. Market Analysis, Insights and Forecast - by Application
- 8.3.1. Automotive
- 8.3.2. Aerospace
- 8.3.3. Building and Construction
- 8.3.4. Industrial Machinery
- 8.3.5. Home Appliances
- 8.3.6. Plumbing Products
- 8.3.7. Other Applications
- 8.1. Market Analysis, Insights and Forecast - by Raw Materials
- 9. Australia and New Zealand Industrial Fasteners Market Analysis, Insights and Forecast, 2019-2031
- 9.1. Market Analysis, Insights and Forecast - by Raw Materials
- 9.1.1. Metal
- 9.1.2. Plastic
- 9.2. Market Analysis, Insights and Forecast - by Products
- 9.2.1. Externally threaded fasteners
- 9.2.2. Internally threaded fasteners
- 9.2.3. Non-threaded fasteners
- 9.2.4. Aerospace grade fasteners
- 9.3. Market Analysis, Insights and Forecast - by Application
- 9.3.1. Automotive
- 9.3.2. Aerospace
- 9.3.3. Building and Construction
- 9.3.4. Industrial Machinery
- 9.3.5. Home Appliances
- 9.3.6. Plumbing Products
- 9.3.7. Other Applications
- 9.1. Market Analysis, Insights and Forecast - by Raw Materials
- 10. Latin America Industrial Fasteners Market Analysis, Insights and Forecast, 2019-2031
- 10.1. Market Analysis, Insights and Forecast - by Raw Materials
- 10.1.1. Metal
- 10.1.2. Plastic
- 10.2. Market Analysis, Insights and Forecast - by Products
- 10.2.1. Externally threaded fasteners
- 10.2.2. Internally threaded fasteners
- 10.2.3. Non-threaded fasteners
- 10.2.4. Aerospace grade fasteners
- 10.3. Market Analysis, Insights and Forecast - by Application
- 10.3.1. Automotive
- 10.3.2. Aerospace
- 10.3.3. Building and Construction
- 10.3.4. Industrial Machinery
- 10.3.5. Home Appliances
- 10.3.6. Plumbing Products
- 10.3.7. Other Applications
- 10.1. Market Analysis, Insights and Forecast - by Raw Materials
- 11. Middle East and Africa Industrial Fasteners Market Analysis, Insights and Forecast, 2019-2031
- 11.1. Market Analysis, Insights and Forecast - by Raw Materials
- 11.1.1. Metal
- 11.1.2. Plastic
- 11.2. Market Analysis, Insights and Forecast - by Products
- 11.2.1. Externally threaded fasteners
- 11.2.2. Internally threaded fasteners
- 11.2.3. Non-threaded fasteners
- 11.2.4. Aerospace grade fasteners
- 11.3. Market Analysis, Insights and Forecast - by Application
- 11.3.1. Automotive
- 11.3.2. Aerospace
- 11.3.3. Building and Construction
- 11.3.4. Industrial Machinery
- 11.3.5. Home Appliances
- 11.3.6. Plumbing Products
- 11.3.7. Other Applications
- 11.1. Market Analysis, Insights and Forecast - by Raw Materials
- 12. North America Industrial Fasteners Market Analysis, Insights and Forecast, 2019-2031
- 12.1. Market Analysis, Insights and Forecast - By Country/Sub-region
- 12.1.1 United States
- 12.1.2 Canada
- 12.1.3 Mexico
- 13. Europe Industrial Fasteners Market Analysis, Insights and Forecast, 2019-2031
- 13.1. Market Analysis, Insights and Forecast - By Country/Sub-region
- 13.1.1 Germany
- 13.1.2 United Kingdom
- 13.1.3 France
- 13.1.4 Spain
- 13.1.5 Italy
- 13.1.6 Spain
- 13.1.7 Belgium
- 13.1.8 Netherland
- 13.1.9 Nordics
- 13.1.10 Rest of Europe
- 14. Asia Pacific Industrial Fasteners Market Analysis, Insights and Forecast, 2019-2031
- 14.1. Market Analysis, Insights and Forecast - By Country/Sub-region
- 14.1.1 China
- 14.1.2 Japan
- 14.1.3 India
- 14.1.4 South Korea
- 14.1.5 Southeast Asia
- 14.1.6 Australia
- 14.1.7 Indonesia
- 14.1.8 Phillipes
- 14.1.9 Singapore
- 14.1.10 Thailandc
- 14.1.11 Rest of Asia Pacific
- 15. South America Industrial Fasteners Market Analysis, Insights and Forecast, 2019-2031
- 15.1. Market Analysis, Insights and Forecast - By Country/Sub-region
- 15.1.1 Brazil
- 15.1.2 Argentina
- 15.1.3 Peru
- 15.1.4 Chile
- 15.1.5 Colombia
- 15.1.6 Ecuador
- 15.1.7 Venezuela
- 15.1.8 Rest of South America
- 16. North America Industrial Fasteners Market Analysis, Insights and Forecast, 2019-2031
- 16.1. Market Analysis, Insights and Forecast - By Country/Sub-region
- 16.1.1 United States
- 16.1.2 Canada
- 16.1.3 Mexico
- 17. MEA Industrial Fasteners Market Analysis, Insights and Forecast, 2019-2031
- 17.1. Market Analysis, Insights and Forecast - By Country/Sub-region
- 17.1.1 United Arab Emirates
- 17.1.2 Saudi Arabia
- 17.1.3 South Africa
- 17.1.4 Rest of Middle East and Africa
- 18. Competitive Analysis
- 18.1. Global Market Share Analysis 2024
- 18.2. Company Profiles
- 18.2.1 Illinois Tool Works Inc
- 18.2.1.1. Overview
- 18.2.1.2. Products
- 18.2.1.3. SWOT Analysis
- 18.2.1.4. Recent Developments
- 18.2.1.5. Financials (Based on Availability)
- 18.2.2 Precision Castparts Corp
- 18.2.2.1. Overview
- 18.2.2.2. Products
- 18.2.2.3. SWOT Analysis
- 18.2.2.4. Recent Developments
- 18.2.2.5. Financials (Based on Availability)
- 18.2.3 SFS Group
- 18.2.3.1. Overview
- 18.2.3.2. Products
- 18.2.3.3. SWOT Analysis
- 18.2.3.4. Recent Developments
- 18.2.3.5. Financials (Based on Availability)
- 18.2.4 Nifco Inc
- 18.2.4.1. Overview
- 18.2.4.2. Products
- 18.2.4.3. SWOT Analysis
- 18.2.4.4. Recent Developments
- 18.2.4.5. Financials (Based on Availability)
- 18.2.5 Arconic Corporation
- 18.2.5.1. Overview
- 18.2.5.2. Products
- 18.2.5.3. SWOT Analysis
- 18.2.5.4. Recent Developments
- 18.2.5.5. Financials (Based on Availability)
- 18.2.6 MacLean-Fogg Company
- 18.2.6.1. Overview
- 18.2.6.2. Products
- 18.2.6.3. SWOT Analysis
- 18.2.6.4. Recent Developments
- 18.2.6.5. Financials (Based on Availability)
- 18.2.7 Stanley Black & Decker Inc
- 18.2.7.1. Overview
- 18.2.7.2. Products
- 18.2.7.3. SWOT Analysis
- 18.2.7.4. Recent Developments
- 18.2.7.5. Financials (Based on Availability)
- 18.2.8 Acument Global Technologies Inc
- 18.2.8.1. Overview
- 18.2.8.2. Products
- 18.2.8.3. SWOT Analysis
- 18.2.8.4. Recent Developments
- 18.2.8.5. Financials (Based on Availability)
- 18.2.9 MISUMI Group Inc
- 18.2.9.1. Overview
- 18.2.9.2. Products
- 18.2.9.3. SWOT Analysis
- 18.2.9.4. Recent Developments
- 18.2.9.5. Financials (Based on Availability)
- 18.2.10 LISI Group
- 18.2.10.1. Overview
- 18.2.10.2. Products
- 18.2.10.3. SWOT Analysis
- 18.2.10.4. Recent Developments
- 18.2.10.5. Financials (Based on Availability)
- 18.2.11 Hilti Corporation
- 18.2.11.1. Overview
- 18.2.11.2. Products
- 18.2.11.3. SWOT Analysis
- 18.2.11.4. Recent Developments
- 18.2.11.5. Financials (Based on Availability)
- 18.2.1 Illinois Tool Works Inc
List of Figures
- Figure 1: Global Industrial Fasteners Market Revenue Breakdown (Million, %) by Region 2024 & 2032
- Figure 2: Global Industrial Fasteners Market Volume Breakdown (K Unit, %) by Region 2024 & 2032
- Figure 3: North America Industrial Fasteners Market Revenue (Million), by Country 2024 & 2032
- Figure 4: North America Industrial Fasteners Market Volume (K Unit), by Country 2024 & 2032
- Figure 5: North America Industrial Fasteners Market Revenue Share (%), by Country 2024 & 2032
- Figure 6: North America Industrial Fasteners Market Volume Share (%), by Country 2024 & 2032
- Figure 7: Europe Industrial Fasteners Market Revenue (Million), by Country 2024 & 2032
- Figure 8: Europe Industrial Fasteners Market Volume (K Unit), by Country 2024 & 2032
- Figure 9: Europe Industrial Fasteners Market Revenue Share (%), by Country 2024 & 2032
- Figure 10: Europe Industrial Fasteners Market Volume Share (%), by Country 2024 & 2032
- Figure 11: Asia Pacific Industrial Fasteners Market Revenue (Million), by Country 2024 & 2032
- Figure 12: Asia Pacific Industrial Fasteners Market Volume (K Unit), by Country 2024 & 2032
- Figure 13: Asia Pacific Industrial Fasteners Market Revenue Share (%), by Country 2024 & 2032
- Figure 14: Asia Pacific Industrial Fasteners Market Volume Share (%), by Country 2024 & 2032
- Figure 15: South America Industrial Fasteners Market Revenue (Million), by Country 2024 & 2032
- Figure 16: South America Industrial Fasteners Market Volume (K Unit), by Country 2024 & 2032
- Figure 17: South America Industrial Fasteners Market Revenue Share (%), by Country 2024 & 2032
- Figure 18: South America Industrial Fasteners Market Volume Share (%), by Country 2024 & 2032
- Figure 19: North America Industrial Fasteners Market Revenue (Million), by Country 2024 & 2032
- Figure 20: North America Industrial Fasteners Market Volume (K Unit), by Country 2024 & 2032
- Figure 21: North America Industrial Fasteners Market Revenue Share (%), by Country 2024 & 2032
- Figure 22: North America Industrial Fasteners Market Volume Share (%), by Country 2024 & 2032
- Figure 23: MEA Industrial Fasteners Market Revenue (Million), by Country 2024 & 2032
- Figure 24: MEA Industrial Fasteners Market Volume (K Unit), by Country 2024 & 2032
- Figure 25: MEA Industrial Fasteners Market Revenue Share (%), by Country 2024 & 2032
- Figure 26: MEA Industrial Fasteners Market Volume Share (%), by Country 2024 & 2032
- Figure 27: North America Industrial Fasteners Market Revenue (Million), by Raw Materials 2024 & 2032
- Figure 28: North America Industrial Fasteners Market Volume (K Unit), by Raw Materials 2024 & 2032
- Figure 29: North America Industrial Fasteners Market Revenue Share (%), by Raw Materials 2024 & 2032
- Figure 30: North America Industrial Fasteners Market Volume Share (%), by Raw Materials 2024 & 2032
- Figure 31: North America Industrial Fasteners Market Revenue (Million), by Products 2024 & 2032
- Figure 32: North America Industrial Fasteners Market Volume (K Unit), by Products 2024 & 2032
- Figure 33: North America Industrial Fasteners Market Revenue Share (%), by Products 2024 & 2032
- Figure 34: North America Industrial Fasteners Market Volume Share (%), by Products 2024 & 2032
- Figure 35: North America Industrial Fasteners Market Revenue (Million), by Application 2024 & 2032
- Figure 36: North America Industrial Fasteners Market Volume (K Unit), by Application 2024 & 2032
- Figure 37: North America Industrial Fasteners Market Revenue Share (%), by Application 2024 & 2032
- Figure 38: North America Industrial Fasteners Market Volume Share (%), by Application 2024 & 2032
- Figure 39: North America Industrial Fasteners Market Revenue (Million), by Country 2024 & 2032
- Figure 40: North America Industrial Fasteners Market Volume (K Unit), by Country 2024 & 2032
- Figure 41: North America Industrial Fasteners Market Revenue Share (%), by Country 2024 & 2032
- Figure 42: North America Industrial Fasteners Market Volume Share (%), by Country 2024 & 2032
- Figure 43: Europe Industrial Fasteners Market Revenue (Million), by Raw Materials 2024 & 2032
- Figure 44: Europe Industrial Fasteners Market Volume (K Unit), by Raw Materials 2024 & 2032
- Figure 45: Europe Industrial Fasteners Market Revenue Share (%), by Raw Materials 2024 & 2032
- Figure 46: Europe Industrial Fasteners Market Volume Share (%), by Raw Materials 2024 & 2032
- Figure 47: Europe Industrial Fasteners Market Revenue (Million), by Products 2024 & 2032
- Figure 48: Europe Industrial Fasteners Market Volume (K Unit), by Products 2024 & 2032
- Figure 49: Europe Industrial Fasteners Market Revenue Share (%), by Products 2024 & 2032
- Figure 50: Europe Industrial Fasteners Market Volume Share (%), by Products 2024 & 2032
- Figure 51: Europe Industrial Fasteners Market Revenue (Million), by Application 2024 & 2032
- Figure 52: Europe Industrial Fasteners Market Volume (K Unit), by Application 2024 & 2032
- Figure 53: Europe Industrial Fasteners Market Revenue Share (%), by Application 2024 & 2032
- Figure 54: Europe Industrial Fasteners Market Volume Share (%), by Application 2024 & 2032
- Figure 55: Europe Industrial Fasteners Market Revenue (Million), by Country 2024 & 2032
- Figure 56: Europe Industrial Fasteners Market Volume (K Unit), by Country 2024 & 2032
- Figure 57: Europe Industrial Fasteners Market Revenue Share (%), by Country 2024 & 2032
- Figure 58: Europe Industrial Fasteners Market Volume Share (%), by Country 2024 & 2032
- Figure 59: Asia Industrial Fasteners Market Revenue (Million), by Raw Materials 2024 & 2032
- Figure 60: Asia Industrial Fasteners Market Volume (K Unit), by Raw Materials 2024 & 2032
- Figure 61: Asia Industrial Fasteners Market Revenue Share (%), by Raw Materials 2024 & 2032
- Figure 62: Asia Industrial Fasteners Market Volume Share (%), by Raw Materials 2024 & 2032
- Figure 63: Asia Industrial Fasteners Market Revenue (Million), by Products 2024 & 2032
- Figure 64: Asia Industrial Fasteners Market Volume (K Unit), by Products 2024 & 2032
- Figure 65: Asia Industrial Fasteners Market Revenue Share (%), by Products 2024 & 2032
- Figure 66: Asia Industrial Fasteners Market Volume Share (%), by Products 2024 & 2032
- Figure 67: Asia Industrial Fasteners Market Revenue (Million), by Application 2024 & 2032
- Figure 68: Asia Industrial Fasteners Market Volume (K Unit), by Application 2024 & 2032
- Figure 69: Asia Industrial Fasteners Market Revenue Share (%), by Application 2024 & 2032
- Figure 70: Asia Industrial Fasteners Market Volume Share (%), by Application 2024 & 2032
- Figure 71: Asia Industrial Fasteners Market Revenue (Million), by Country 2024 & 2032
- Figure 72: Asia Industrial Fasteners Market Volume (K Unit), by Country 2024 & 2032
- Figure 73: Asia Industrial Fasteners Market Revenue Share (%), by Country 2024 & 2032
- Figure 74: Asia Industrial Fasteners Market Volume Share (%), by Country 2024 & 2032
- Figure 75: Australia and New Zealand Industrial Fasteners Market Revenue (Million), by Raw Materials 2024 & 2032
- Figure 76: Australia and New Zealand Industrial Fasteners Market Volume (K Unit), by Raw Materials 2024 & 2032
- Figure 77: Australia and New Zealand Industrial Fasteners Market Revenue Share (%), by Raw Materials 2024 & 2032
- Figure 78: Australia and New Zealand Industrial Fasteners Market Volume Share (%), by Raw Materials 2024 & 2032
- Figure 79: Australia and New Zealand Industrial Fasteners Market Revenue (Million), by Products 2024 & 2032
- Figure 80: Australia and New Zealand Industrial Fasteners Market Volume (K Unit), by Products 2024 & 2032
- Figure 81: Australia and New Zealand Industrial Fasteners Market Revenue Share (%), by Products 2024 & 2032
- Figure 82: Australia and New Zealand Industrial Fasteners Market Volume Share (%), by Products 2024 & 2032
- Figure 83: Australia and New Zealand Industrial Fasteners Market Revenue (Million), by Application 2024 & 2032
- Figure 84: Australia and New Zealand Industrial Fasteners Market Volume (K Unit), by Application 2024 & 2032
- Figure 85: Australia and New Zealand Industrial Fasteners Market Revenue Share (%), by Application 2024 & 2032
- Figure 86: Australia and New Zealand Industrial Fasteners Market Volume Share (%), by Application 2024 & 2032
- Figure 87: Australia and New Zealand Industrial Fasteners Market Revenue (Million), by Country 2024 & 2032
- Figure 88: Australia and New Zealand Industrial Fasteners Market Volume (K Unit), by Country 2024 & 2032
- Figure 89: Australia and New Zealand Industrial Fasteners Market Revenue Share (%), by Country 2024 & 2032
- Figure 90: Australia and New Zealand Industrial Fasteners Market Volume Share (%), by Country 2024 & 2032
- Figure 91: Latin America Industrial Fasteners Market Revenue (Million), by Raw Materials 2024 & 2032
- Figure 92: Latin America Industrial Fasteners Market Volume (K Unit), by Raw Materials 2024 & 2032
- Figure 93: Latin America Industrial Fasteners Market Revenue Share (%), by Raw Materials 2024 & 2032
- Figure 94: Latin America Industrial Fasteners Market Volume Share (%), by Raw Materials 2024 & 2032
- Figure 95: Latin America Industrial Fasteners Market Revenue (Million), by Products 2024 & 2032
- Figure 96: Latin America Industrial Fasteners Market Volume (K Unit), by Products 2024 & 2032
- Figure 97: Latin America Industrial Fasteners Market Revenue Share (%), by Products 2024 & 2032
- Figure 98: Latin America Industrial Fasteners Market Volume Share (%), by Products 2024 & 2032
- Figure 99: Latin America Industrial Fasteners Market Revenue (Million), by Application 2024 & 2032
- Figure 100: Latin America Industrial Fasteners Market Volume (K Unit), by Application 2024 & 2032
- Figure 101: Latin America Industrial Fasteners Market Revenue Share (%), by Application 2024 & 2032
- Figure 102: Latin America Industrial Fasteners Market Volume Share (%), by Application 2024 & 2032
- Figure 103: Latin America Industrial Fasteners Market Revenue (Million), by Country 2024 & 2032
- Figure 104: Latin America Industrial Fasteners Market Volume (K Unit), by Country 2024 & 2032
- Figure 105: Latin America Industrial Fasteners Market Revenue Share (%), by Country 2024 & 2032
- Figure 106: Latin America Industrial Fasteners Market Volume Share (%), by Country 2024 & 2032
- Figure 107: Middle East and Africa Industrial Fasteners Market Revenue (Million), by Raw Materials 2024 & 2032
- Figure 108: Middle East and Africa Industrial Fasteners Market Volume (K Unit), by Raw Materials 2024 & 2032
- Figure 109: Middle East and Africa Industrial Fasteners Market Revenue Share (%), by Raw Materials 2024 & 2032
- Figure 110: Middle East and Africa Industrial Fasteners Market Volume Share (%), by Raw Materials 2024 & 2032
- Figure 111: Middle East and Africa Industrial Fasteners Market Revenue (Million), by Products 2024 & 2032
- Figure 112: Middle East and Africa Industrial Fasteners Market Volume (K Unit), by Products 2024 & 2032
- Figure 113: Middle East and Africa Industrial Fasteners Market Revenue Share (%), by Products 2024 & 2032
- Figure 114: Middle East and Africa Industrial Fasteners Market Volume Share (%), by Products 2024 & 2032
- Figure 115: Middle East and Africa Industrial Fasteners Market Revenue (Million), by Application 2024 & 2032
- Figure 116: Middle East and Africa Industrial Fasteners Market Volume (K Unit), by Application 2024 & 2032
- Figure 117: Middle East and Africa Industrial Fasteners Market Revenue Share (%), by Application 2024 & 2032
- Figure 118: Middle East and Africa Industrial Fasteners Market Volume Share (%), by Application 2024 & 2032
- Figure 119: Middle East and Africa Industrial Fasteners Market Revenue (Million), by Country 2024 & 2032
- Figure 120: Middle East and Africa Industrial Fasteners Market Volume (K Unit), by Country 2024 & 2032
- Figure 121: Middle East and Africa Industrial Fasteners Market Revenue Share (%), by Country 2024 & 2032
- Figure 122: Middle East and Africa Industrial Fasteners Market Volume Share (%), by Country 2024 & 2032
List of Tables
- Table 1: Global Industrial Fasteners Market Revenue Million Forecast, by Region 2019 & 2032
- Table 2: Global Industrial Fasteners Market Volume K Unit Forecast, by Region 2019 & 2032
- Table 3: Global Industrial Fasteners Market Revenue Million Forecast, by Raw Materials 2019 & 2032
- Table 4: Global Industrial Fasteners Market Volume K Unit Forecast, by Raw Materials 2019 & 2032
- Table 5: Global Industrial Fasteners Market Revenue Million Forecast, by Products 2019 & 2032
- Table 6: Global Industrial Fasteners Market Volume K Unit Forecast, by Products 2019 & 2032
- Table 7: Global Industrial Fasteners Market Revenue Million Forecast, by Application 2019 & 2032
- Table 8: Global Industrial Fasteners Market Volume K Unit Forecast, by Application 2019 & 2032
- Table 9: Global Industrial Fasteners Market Revenue Million Forecast, by Region 2019 & 2032
- Table 10: Global Industrial Fasteners Market Volume K Unit Forecast, by Region 2019 & 2032
- Table 11: Global Industrial Fasteners Market Revenue Million Forecast, by Country 2019 & 2032
- Table 12: Global Industrial Fasteners Market Volume K Unit Forecast, by Country 2019 & 2032
- Table 13: United States Industrial Fasteners Market Revenue (Million) Forecast, by Application 2019 & 2032
- Table 14: United States Industrial Fasteners Market Volume (K Unit) Forecast, by Application 2019 & 2032
- Table 15: Canada Industrial Fasteners Market Revenue (Million) Forecast, by Application 2019 & 2032
- Table 16: Canada Industrial Fasteners Market Volume (K Unit) Forecast, by Application 2019 & 2032
- Table 17: Mexico Industrial Fasteners Market Revenue (Million) Forecast, by Application 2019 & 2032
- Table 18: Mexico Industrial Fasteners Market Volume (K Unit) Forecast, by Application 2019 & 2032
- Table 19: Global Industrial Fasteners Market Revenue Million Forecast, by Country 2019 & 2032
- Table 20: Global Industrial Fasteners Market Volume K Unit Forecast, by Country 2019 & 2032
- Table 21: Germany Industrial Fasteners Market Revenue (Million) Forecast, by Application 2019 & 2032
- Table 22: Germany Industrial Fasteners Market Volume (K Unit) Forecast, by Application 2019 & 2032
- Table 23: United Kingdom Industrial Fasteners Market Revenue (Million) Forecast, by Application 2019 & 2032
- Table 24: United Kingdom Industrial Fasteners Market Volume (K Unit) Forecast, by Application 2019 & 2032
- Table 25: France Industrial Fasteners Market Revenue (Million) Forecast, by Application 2019 & 2032
- Table 26: France Industrial Fasteners Market Volume (K Unit) Forecast, by Application 2019 & 2032
- Table 27: Spain Industrial Fasteners Market Revenue (Million) Forecast, by Application 2019 & 2032
- Table 28: Spain Industrial Fasteners Market Volume (K Unit) Forecast, by Application 2019 & 2032
- Table 29: Italy Industrial Fasteners Market Revenue (Million) Forecast, by Application 2019 & 2032
- Table 30: Italy Industrial Fasteners Market Volume (K Unit) Forecast, by Application 2019 & 2032
- Table 31: Spain Industrial Fasteners Market Revenue (Million) Forecast, by Application 2019 & 2032
- Table 32: Spain Industrial Fasteners Market Volume (K Unit) Forecast, by Application 2019 & 2032
- Table 33: Belgium Industrial Fasteners Market Revenue (Million) Forecast, by Application 2019 & 2032
- Table 34: Belgium Industrial Fasteners Market Volume (K Unit) Forecast, by Application 2019 & 2032
- Table 35: Netherland Industrial Fasteners Market Revenue (Million) Forecast, by Application 2019 & 2032
- Table 36: Netherland Industrial Fasteners Market Volume (K Unit) Forecast, by Application 2019 & 2032
- Table 37: Nordics Industrial Fasteners Market Revenue (Million) Forecast, by Application 2019 & 2032
- Table 38: Nordics Industrial Fasteners Market Volume (K Unit) Forecast, by Application 2019 & 2032
- Table 39: Rest of Europe Industrial Fasteners Market Revenue (Million) Forecast, by Application 2019 & 2032
- Table 40: Rest of Europe Industrial Fasteners Market Volume (K Unit) Forecast, by Application 2019 & 2032
- Table 41: Global Industrial Fasteners Market Revenue Million Forecast, by Country 2019 & 2032
- Table 42: Global Industrial Fasteners Market Volume K Unit Forecast, by Country 2019 & 2032
- Table 43: China Industrial Fasteners Market Revenue (Million) Forecast, by Application 2019 & 2032
- Table 44: China Industrial Fasteners Market Volume (K Unit) Forecast, by Application 2019 & 2032
- Table 45: Japan Industrial Fasteners Market Revenue (Million) Forecast, by Application 2019 & 2032
- Table 46: Japan Industrial Fasteners Market Volume (K Unit) Forecast, by Application 2019 & 2032
- Table 47: India Industrial Fasteners Market Revenue (Million) Forecast, by Application 2019 & 2032
- Table 48: India Industrial Fasteners Market Volume (K Unit) Forecast, by Application 2019 & 2032
- Table 49: South Korea Industrial Fasteners Market Revenue (Million) Forecast, by Application 2019 & 2032
- Table 50: South Korea Industrial Fasteners Market Volume (K Unit) Forecast, by Application 2019 & 2032
- Table 51: Southeast Asia Industrial Fasteners Market Revenue (Million) Forecast, by Application 2019 & 2032
- Table 52: Southeast Asia Industrial Fasteners Market Volume (K Unit) Forecast, by Application 2019 & 2032
- Table 53: Australia Industrial Fasteners Market Revenue (Million) Forecast, by Application 2019 & 2032
- Table 54: Australia Industrial Fasteners Market Volume (K Unit) Forecast, by Application 2019 & 2032
- Table 55: Indonesia Industrial Fasteners Market Revenue (Million) Forecast, by Application 2019 & 2032
- Table 56: Indonesia Industrial Fasteners Market Volume (K Unit) Forecast, by Application 2019 & 2032
- Table 57: Phillipes Industrial Fasteners Market Revenue (Million) Forecast, by Application 2019 & 2032
- Table 58: Phillipes Industrial Fasteners Market Volume (K Unit) Forecast, by Application 2019 & 2032
- Table 59: Singapore Industrial Fasteners Market Revenue (Million) Forecast, by Application 2019 & 2032
- Table 60: Singapore Industrial Fasteners Market Volume (K Unit) Forecast, by Application 2019 & 2032
- Table 61: Thailandc Industrial Fasteners Market Revenue (Million) Forecast, by Application 2019 & 2032
- Table 62: Thailandc Industrial Fasteners Market Volume (K Unit) Forecast, by Application 2019 & 2032
- Table 63: Rest of Asia Pacific Industrial Fasteners Market Revenue (Million) Forecast, by Application 2019 & 2032
- Table 64: Rest of Asia Pacific Industrial Fasteners Market Volume (K Unit) Forecast, by Application 2019 & 2032
- Table 65: Global Industrial Fasteners Market Revenue Million Forecast, by Country 2019 & 2032
- Table 66: Global Industrial Fasteners Market Volume K Unit Forecast, by Country 2019 & 2032
- Table 67: Brazil Industrial Fasteners Market Revenue (Million) Forecast, by Application 2019 & 2032
- Table 68: Brazil Industrial Fasteners Market Volume (K Unit) Forecast, by Application 2019 & 2032
- Table 69: Argentina Industrial Fasteners Market Revenue (Million) Forecast, by Application 2019 & 2032
- Table 70: Argentina Industrial Fasteners Market Volume (K Unit) Forecast, by Application 2019 & 2032
- Table 71: Peru Industrial Fasteners Market Revenue (Million) Forecast, by Application 2019 & 2032
- Table 72: Peru Industrial Fasteners Market Volume (K Unit) Forecast, by Application 2019 & 2032
- Table 73: Chile Industrial Fasteners Market Revenue (Million) Forecast, by Application 2019 & 2032
- Table 74: Chile Industrial Fasteners Market Volume (K Unit) Forecast, by Application 2019 & 2032
- Table 75: Colombia Industrial Fasteners Market Revenue (Million) Forecast, by Application 2019 & 2032
- Table 76: Colombia Industrial Fasteners Market Volume (K Unit) Forecast, by Application 2019 & 2032
- Table 77: Ecuador Industrial Fasteners Market Revenue (Million) Forecast, by Application 2019 & 2032
- Table 78: Ecuador Industrial Fasteners Market Volume (K Unit) Forecast, by Application 2019 & 2032
- Table 79: Venezuela Industrial Fasteners Market Revenue (Million) Forecast, by Application 2019 & 2032
- Table 80: Venezuela Industrial Fasteners Market Volume (K Unit) Forecast, by Application 2019 & 2032
- Table 81: Rest of South America Industrial Fasteners Market Revenue (Million) Forecast, by Application 2019 & 2032
- Table 82: Rest of South America Industrial Fasteners Market Volume (K Unit) Forecast, by Application 2019 & 2032
- Table 83: Global Industrial Fasteners Market Revenue Million Forecast, by Country 2019 & 2032
- Table 84: Global Industrial Fasteners Market Volume K Unit Forecast, by Country 2019 & 2032
- Table 85: United States Industrial Fasteners Market Revenue (Million) Forecast, by Application 2019 & 2032
- Table 86: United States Industrial Fasteners Market Volume (K Unit) Forecast, by Application 2019 & 2032
- Table 87: Canada Industrial Fasteners Market Revenue (Million) Forecast, by Application 2019 & 2032
- Table 88: Canada Industrial Fasteners Market Volume (K Unit) Forecast, by Application 2019 & 2032
- Table 89: Mexico Industrial Fasteners Market Revenue (Million) Forecast, by Application 2019 & 2032
- Table 90: Mexico Industrial Fasteners Market Volume (K Unit) Forecast, by Application 2019 & 2032
- Table 91: Global Industrial Fasteners Market Revenue Million Forecast, by Country 2019 & 2032
- Table 92: Global Industrial Fasteners Market Volume K Unit Forecast, by Country 2019 & 2032
- Table 93: United Arab Emirates Industrial Fasteners Market Revenue (Million) Forecast, by Application 2019 & 2032
- Table 94: United Arab Emirates Industrial Fasteners Market Volume (K Unit) Forecast, by Application 2019 & 2032
- Table 95: Saudi Arabia Industrial Fasteners Market Revenue (Million) Forecast, by Application 2019 & 2032
- Table 96: Saudi Arabia Industrial Fasteners Market Volume (K Unit) Forecast, by Application 2019 & 2032
- Table 97: South Africa Industrial Fasteners Market Revenue (Million) Forecast, by Application 2019 & 2032
- Table 98: South Africa Industrial Fasteners Market Volume (K Unit) Forecast, by Application 2019 & 2032
- Table 99: Rest of Middle East and Africa Industrial Fasteners Market Revenue (Million) Forecast, by Application 2019 & 2032
- Table 100: Rest of Middle East and Africa Industrial Fasteners Market Volume (K Unit) Forecast, by Application 2019 & 2032
- Table 101: Global Industrial Fasteners Market Revenue Million Forecast, by Raw Materials 2019 & 2032
- Table 102: Global Industrial Fasteners Market Volume K Unit Forecast, by Raw Materials 2019 & 2032
- Table 103: Global Industrial Fasteners Market Revenue Million Forecast, by Products 2019 & 2032
- Table 104: Global Industrial Fasteners Market Volume K Unit Forecast, by Products 2019 & 2032
- Table 105: Global Industrial Fasteners Market Revenue Million Forecast, by Application 2019 & 2032
- Table 106: Global Industrial Fasteners Market Volume K Unit Forecast, by Application 2019 & 2032
- Table 107: Global Industrial Fasteners Market Revenue Million Forecast, by Country 2019 & 2032
- Table 108: Global Industrial Fasteners Market Volume K Unit Forecast, by Country 2019 & 2032
- Table 109: Global Industrial Fasteners Market Revenue Million Forecast, by Raw Materials 2019 & 2032
- Table 110: Global Industrial Fasteners Market Volume K Unit Forecast, by Raw Materials 2019 & 2032
- Table 111: Global Industrial Fasteners Market Revenue Million Forecast, by Products 2019 & 2032
- Table 112: Global Industrial Fasteners Market Volume K Unit Forecast, by Products 2019 & 2032
- Table 113: Global Industrial Fasteners Market Revenue Million Forecast, by Application 2019 & 2032
- Table 114: Global Industrial Fasteners Market Volume K Unit Forecast, by Application 2019 & 2032
- Table 115: Global Industrial Fasteners Market Revenue Million Forecast, by Country 2019 & 2032
- Table 116: Global Industrial Fasteners Market Volume K Unit Forecast, by Country 2019 & 2032
- Table 117: Global Industrial Fasteners Market Revenue Million Forecast, by Raw Materials 2019 & 2032
- Table 118: Global Industrial Fasteners Market Volume K Unit Forecast, by Raw Materials 2019 & 2032
- Table 119: Global Industrial Fasteners Market Revenue Million Forecast, by Products 2019 & 2032
- Table 120: Global Industrial Fasteners Market Volume K Unit Forecast, by Products 2019 & 2032
- Table 121: Global Industrial Fasteners Market Revenue Million Forecast, by Application 2019 & 2032
- Table 122: Global Industrial Fasteners Market Volume K Unit Forecast, by Application 2019 & 2032
- Table 123: Global Industrial Fasteners Market Revenue Million Forecast, by Country 2019 & 2032
- Table 124: Global Industrial Fasteners Market Volume K Unit Forecast, by Country 2019 & 2032
- Table 125: Global Industrial Fasteners Market Revenue Million Forecast, by Raw Materials 2019 & 2032
- Table 126: Global Industrial Fasteners Market Volume K Unit Forecast, by Raw Materials 2019 & 2032
- Table 127: Global Industrial Fasteners Market Revenue Million Forecast, by Products 2019 & 2032
- Table 128: Global Industrial Fasteners Market Volume K Unit Forecast, by Products 2019 & 2032
- Table 129: Global Industrial Fasteners Market Revenue Million Forecast, by Application 2019 & 2032
- Table 130: Global Industrial Fasteners Market Volume K Unit Forecast, by Application 2019 & 2032
- Table 131: Global Industrial Fasteners Market Revenue Million Forecast, by Country 2019 & 2032
- Table 132: Global Industrial Fasteners Market Volume K Unit Forecast, by Country 2019 & 2032
- Table 133: Global Industrial Fasteners Market Revenue Million Forecast, by Raw Materials 2019 & 2032
- Table 134: Global Industrial Fasteners Market Volume K Unit Forecast, by Raw Materials 2019 & 2032
- Table 135: Global Industrial Fasteners Market Revenue Million Forecast, by Products 2019 & 2032
- Table 136: Global Industrial Fasteners Market Volume K Unit Forecast, by Products 2019 & 2032
- Table 137: Global Industrial Fasteners Market Revenue Million Forecast, by Application 2019 & 2032
- Table 138: Global Industrial Fasteners Market Volume K Unit Forecast, by Application 2019 & 2032
- Table 139: Global Industrial Fasteners Market Revenue Million Forecast, by Country 2019 & 2032
- Table 140: Global Industrial Fasteners Market Volume K Unit Forecast, by Country 2019 & 2032
- Table 141: Global Industrial Fasteners Market Revenue Million Forecast, by Raw Materials 2019 & 2032
- Table 142: Global Industrial Fasteners Market Volume K Unit Forecast, by Raw Materials 2019 & 2032
- Table 143: Global Industrial Fasteners Market Revenue Million Forecast, by Products 2019 & 2032
- Table 144: Global Industrial Fasteners Market Volume K Unit Forecast, by Products 2019 & 2032
- Table 145: Global Industrial Fasteners Market Revenue Million Forecast, by Application 2019 & 2032
- Table 146: Global Industrial Fasteners Market Volume K Unit Forecast, by Application 2019 & 2032
- Table 147: Global Industrial Fasteners Market Revenue Million Forecast, by Country 2019 & 2032
- Table 148: Global Industrial Fasteners Market Volume K Unit Forecast, by Country 2019 & 2032
Frequently Asked Questions
1. What is the projected Compound Annual Growth Rate (CAGR) of the Industrial Fasteners Market?
The projected CAGR is approximately 4.26%.
2. Which companies are prominent players in the Industrial Fasteners Market?
Key companies in the market include Illinois Tool Works Inc, Precision Castparts Corp, SFS Group, Nifco Inc, Arconic Corporation, MacLean-Fogg Company, Stanley Black & Decker Inc, Acument Global Technologies Inc, MISUMI Group Inc, LISI Group, Hilti Corporation.
3. What are the main segments of the Industrial Fasteners Market?
The market segments include Raw Materials, Products, Application.
4. Can you provide details about the market size?
The market size is estimated to be USD 84.77 Million as of 2022.
5. What are some drivers contributing to market growth?
Strong Revival in the Construction and Automotive Markets; Rapid Technological Advancement and Increased Spending in R&D.
6. What are the notable trends driving market growth?
Metal Segment to Dominate the Market.
7. Are there any restraints impacting market growth?
Challenges Associated With LED Driver Failure and High Cost Associated With Installation.
8. Can you provide examples of recent developments in the market?
March 2022: Birmingham Fastener announced the acquisition of K-T Bolt Manufacturing, Inc. to expand its product offering and manufacturing diversity. Based in Katy, Texas, K-T Bolt Manufacturing provides custom fabrication, in-house heat treating, closed-die forging, and electropolishing.
9. What pricing options are available for accessing the report?
Pricing options include single-user, multi-user, and enterprise licenses priced at USD 4750, USD 5250, and USD 8750 respectively.
10. Is the market size provided in terms of value or volume?
The market size is provided in terms of value, measured in Million and volume, measured in K Unit.
11. Are there any specific market keywords associated with the report?
Yes, the market keyword associated with the report is "Industrial Fasteners Market," which aids in identifying and referencing the specific market segment covered.
12. How do I determine which pricing option suits my needs best?
The pricing options vary based on user requirements and access needs. Individual users may opt for single-user licenses, while businesses requiring broader access may choose multi-user or enterprise licenses for cost-effective access to the report.
13. Are there any additional resources or data provided in the Industrial Fasteners Market report?
While the report offers comprehensive insights, it's advisable to review the specific contents or supplementary materials provided to ascertain if additional resources or data are available.
14. How can I stay updated on further developments or reports in the Industrial Fasteners Market?
To stay informed about further developments, trends, and reports in the Industrial Fasteners Market, consider subscribing to industry newsletters, following relevant companies and organizations, or regularly checking reputable industry news sources and publications.
Methodology
Step 1 - Identification of Relevant Samples Size from Population Database


Step 2 - Approaches for Defining Global Market Size (Value, Volume* & Price*)

Note*: In applicable scenarios
Step 3 - Data Sources
Primary Research
- Web Analytics
- Survey Reports
- Research Institute
- Latest Research Reports
- Opinion Leaders
Secondary Research
- Annual Reports
- White Paper
- Latest Press Release
- Industry Association
- Paid Database
- Investor Presentations

Step 4 - Data Triangulation
Involves using different sources of information in order to increase the validity of a study
These sources are likely to be stakeholders in a program - participants, other researchers, program staff, other community members, and so on.
Then we put all data in single framework & apply various statistical tools to find out the dynamic on the market.
During the analysis stage, feedback from the stakeholder groups would be compared to determine areas of agreement as well as areas of divergence


