
Key Insights
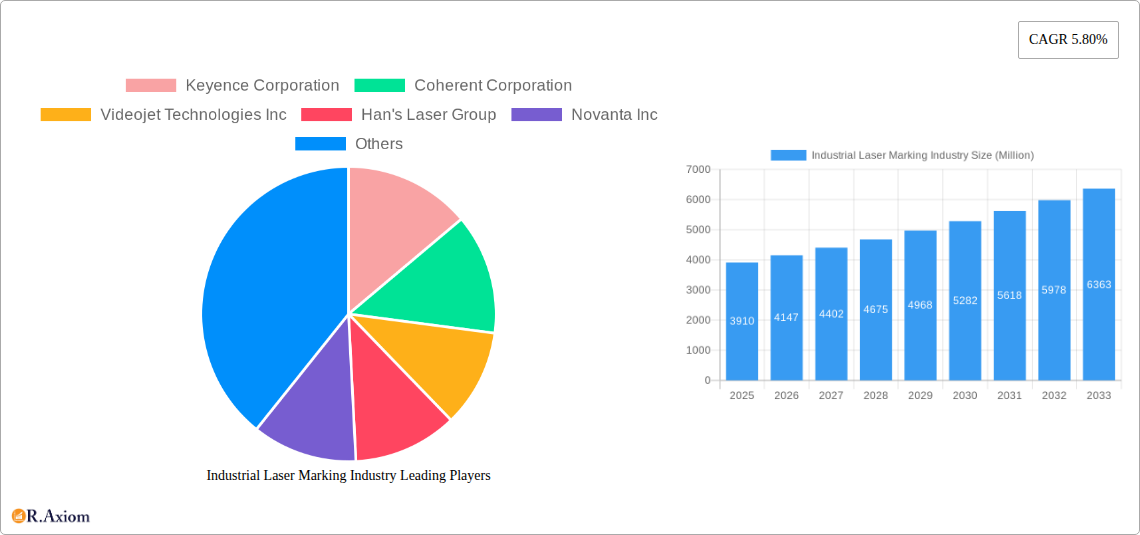
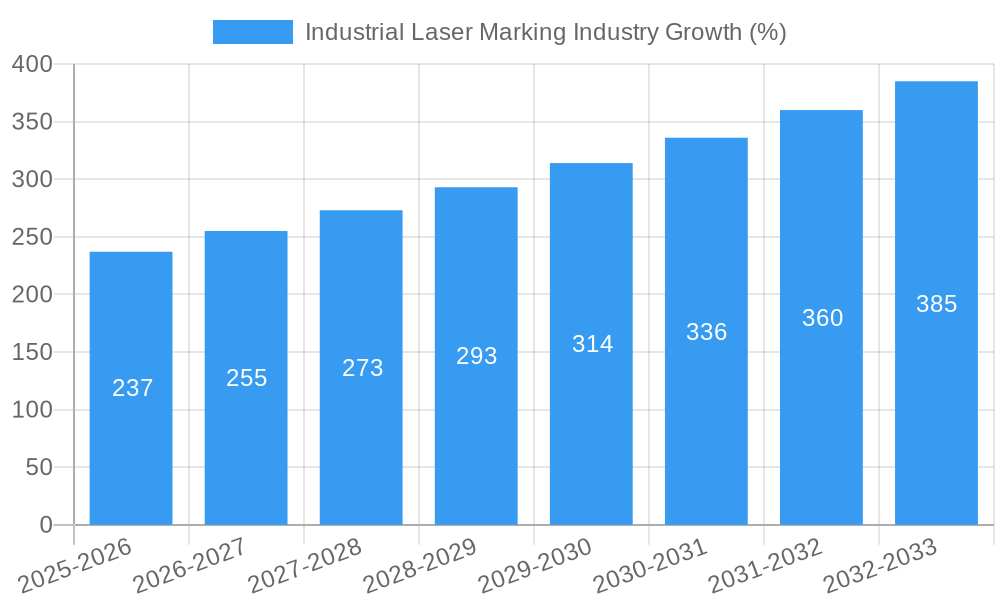
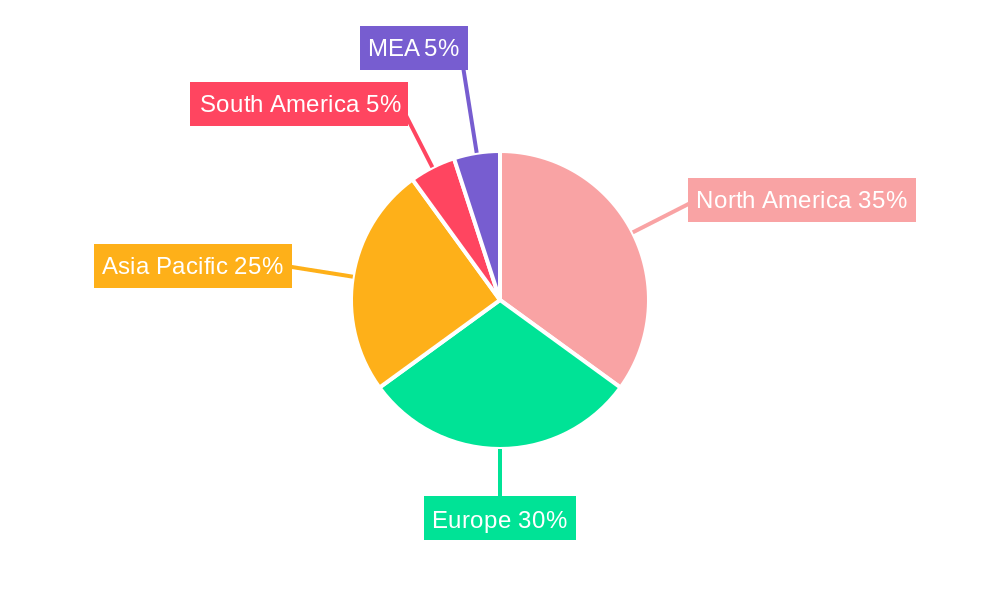
The industrial laser marking market, valued at $3.91 billion in 2025, is projected to experience robust growth, driven by increasing automation across diverse sectors and the rising demand for high-precision, permanent marking solutions. The market's Compound Annual Growth Rate (CAGR) of 5.80% from 2025 to 2033 indicates a significant expansion, fueled by several key factors. The healthcare industry, with its stringent regulatory requirements and need for traceability, is a major driver, alongside the automotive sector's demand for efficient part identification and quality control. Electronics manufacturing, with its miniaturization trends and need for intricate markings, further contributes to market growth. Technological advancements in fiber lasers, offering higher efficiency and precision compared to CO2 or solid-state lasers, are shaping market dynamics. The increasing adoption of software solutions for design and integration enhances the overall efficiency and cost-effectiveness of laser marking systems. While initial investment costs can be a restraint, the long-term benefits of increased productivity and reduced error rates outweigh this hurdle. The market is segmented by end-user industry (healthcare, automotive, electronics, machine tools, packaging, and others), equipment type (fiber, CO2, solid-state, and others), and offering (hardware and software). Geographic growth is expected across North America, Europe, and Asia-Pacific, with China and the US as key regional markets.
The forecast period from 2025 to 2033 anticipates continued market expansion, with specific growth rates varying across segments. The fiber laser segment is expected to maintain a dominant position due to its superior performance characteristics. Software solutions for automation and integration will continue to gain traction, boosting the software segment's market share. Future growth will be influenced by factors such as advancements in laser technology, the adoption of Industry 4.0 principles, and the increasing demand for product traceability and anti-counterfeiting measures across various industries. The competitive landscape includes major players like Keyence Corporation, Coherent Corporation, and IPG Photonics Corporation, who are likely to engage in strategic partnerships and technological innovations to maintain their market positions. The market’s trajectory indicates strong potential for continued expansion driven by both technological progress and the ever-growing need for efficient and precise marking in diverse industries.
Industrial Laser Marking Industry: A Comprehensive Market Report (2019-2033)
This in-depth report provides a comprehensive analysis of the Industrial Laser Marking industry, encompassing market size, growth projections, key players, and emerging trends from 2019 to 2033. The report leverages detailed market segmentation, examining various end-user industries, equipment types, and offerings to provide actionable insights for stakeholders. With a base year of 2025 and a forecast period spanning 2025-2033, this report is an indispensable resource for understanding the current landscape and future trajectory of this dynamic sector. The total market size is projected to reach xx Million by 2033.
Industrial Laser Marking Industry Market Concentration & Innovation
The Industrial Laser Marking industry exhibits a moderately concentrated market structure, with several major players holding significant market share. Keyence Corporation, Coherent Corporation, and IPG Photonics Corporation are among the leading companies, collectively accounting for an estimated xx% of the global market in 2025. However, the market also includes a number of smaller, specialized firms, fostering competition and innovation.
- Market Share (2025 Estimate): Keyence Corporation (xx%), Coherent Corporation (xx%), IPG Photonics Corporation (xx%), Others (xx%).
- Innovation Drivers: Advancements in laser technology (e.g., fiber lasers), increasing demand for high-speed and precise marking solutions, and the growing adoption of automation in various industries are key innovation drivers.
- Regulatory Frameworks: Industry regulations related to safety, environmental compliance, and product traceability influence market dynamics. Stringent regulations in certain regions can present both challenges and opportunities for innovation.
- Product Substitutes: Alternative marking technologies like inkjet printing and screen printing exist, but laser marking offers superior precision and durability, limiting the impact of substitutes.
- End-User Trends: The increasing adoption of laser marking in industries such as electronics, automotive, and healthcare drives market expansion. Demand for traceability and serialization in various products further fuels industry growth.
- M&A Activities: The industry has witnessed a moderate level of mergers and acquisitions activity in recent years, with deal values ranging from USD xx Million to USD xx Million. These activities reflect consolidation trends and efforts to expand market reach and technological capabilities.
Industrial Laser Marking Industry Industry Trends & Insights
The Industrial Laser Marking industry is experiencing robust growth, driven by several factors. The global market is anticipated to achieve a Compound Annual Growth Rate (CAGR) of xx% during the forecast period (2025-2033). Market penetration in emerging economies is also increasing, representing a significant opportunity for growth. Technological disruptions, such as the development of more efficient and versatile laser systems, further fuel this expansion. Consumer preferences for high-quality, durable, and traceable products create consistent demand for laser marking solutions. Competitive dynamics are shaped by ongoing innovation, price competition, and strategic alliances.
Dominant Markets & Segments in Industrial Laser Marking Industry
The Electronics segment dominates the Industrial Laser Marking market by end-user industry, driven by the high volume of electronic components requiring precise and durable marking for traceability and quality control. Within equipment types, Fiber Lasers hold the largest market share due to their high efficiency, precision, and versatility. In terms of offerings, Hardware accounts for a significant portion of the market revenue, although the demand for integrated Software solutions is also growing rapidly. Geographically, the Asia-Pacific region is a dominant market, driven by robust manufacturing activities in countries like China, Japan, and South Korea.
Key Drivers (Electronics Segment):
- High-volume manufacturing of electronics.
- Demand for high-speed and precise marking.
- Stringent industry regulations requiring product traceability.
Dominance Analysis: The Electronics sector's dominance stems from the high volume of small parts requiring highly precise and durable markings, which fiber lasers excel at. The Asia-Pacific region's large manufacturing base further fuels this segment's significant market share. The Hardware segment naturally leads given the primary need for physical laser marking equipment, but Software solutions are quickly rising due to the need for efficient data management and traceability.
Industrial Laser Marking Industry Product Developments
Recent product innovations focus on enhanced precision, speed, and versatility. Fiber lasers are becoming increasingly prevalent due to their superior efficiency and cost-effectiveness. Software advancements enable seamless integration with automated manufacturing processes, improving overall efficiency and traceability. The development of compact and user-friendly laser marking systems expands the market reach to smaller businesses. These developments cater to the evolving demands of various end-user industries and contribute to the overall market growth.
Report Scope & Segmentation Analysis
This report segments the Industrial Laser Marking market across three key dimensions:
- By End-user Industry: Healthcare, Automotive, Electronics, Machine Tools, Packaging, Other End-User Industries (Each segment’s market size and growth projections are detailed in the full report, with analysis of competitive dynamics.)
- By Equipment: Fiber Laser, CO2 Laser, Solid State Laser, Other Equipment (Market shares and growth forecasts for each laser type are provided, highlighting their respective strengths and weaknesses.)
- By Offering: Hardware, Software (The report analyzes market size and growth potential for both hardware and software components, highlighting trends in software integration and automation.)
Key Drivers of Industrial Laser Marking Industry Growth
Several factors are driving the growth of the Industrial Laser Marking industry:
- Technological advancements: Improvements in laser technology, such as higher power and precision, are enabling more efficient and versatile marking solutions.
- Increased automation: The adoption of automation across industries drives demand for automated laser marking systems.
- Stringent regulations: Growing regulatory requirements for product traceability and serialization are making laser marking mandatory in many sectors.
Challenges in the Industrial Laser Marking Industry Sector
The industry faces some challenges, including:
- High initial investment costs: Acquiring advanced laser marking systems can be expensive, posing a barrier for some businesses.
- Supply chain disruptions: Global supply chain issues can impact the availability of components and affect production timelines.
- Intense competition: The presence of several established players creates a competitive landscape requiring ongoing innovation and cost optimization.
Emerging Opportunities in Industrial Laser Marking Industry
Emerging trends present significant opportunities for growth:
- Growing demand in emerging markets: Expanding manufacturing activities in developing countries are creating new avenues for growth.
- Advancements in laser materials processing: New laser technologies and materials processing techniques will create more sophisticated marking and other solutions.
- Increasing focus on sustainability: The use of laser marking in eco-friendly manufacturing processes is becoming more prevalent, offering new opportunities for manufacturers.
Leading Players in the Industrial Laser Marking Industry Market
- Keyence Corporation
- Coherent Corporation
- Videojet Technologies Inc
- Han's Laser Group
- Novanta Inc
- TRUMPF Group
- Gravotech Group
- IPG Photonics Corporation
- Epilog Corporation
- Mecco Partners LLC
Key Developments in Industrial Laser Marking Industry Industry
- May 2023: Norlase secured USD 11 Million in funding following FDA clearance and CE mark approval for its ECHO pattern laser, boosting production capacity for laser treatments.
- March 2023: Cajo Technologies received funding from Nefco to advance its laser marking technology for enhanced traceability in the circular economy, impacting packaging, paper, metal, and other industries.
Strategic Outlook for Industrial Laser Marking Industry Market
The Industrial Laser Marking industry is poised for continued growth, driven by technological advancements, increasing automation, and rising demand for product traceability. The focus on developing sustainable and efficient marking solutions presents significant growth opportunities. Expanding into emerging markets and leveraging strategic partnerships will be crucial for companies to capitalize on the industry's potential.
Industrial Laser Marking Industry Segmentation
-
1. Equipment
- 1.1. Fiber Laser
- 1.2. CO2 Laser
- 1.3. Solid State Laser
- 1.4. Other Equipment
-
2. Offering
- 2.1. Hardware
- 2.2. Software
-
3. End-user Industry
- 3.1. Healthcare
- 3.2. Automotive
- 3.3. Electronics
- 3.4. Machine Tools
- 3.5. Packaging
- 3.6. Other End-User Industries
Industrial Laser Marking Industry Segmentation By Geography
- 1. North America
- 2. Europe
- 3. Asia Pacific
- 4. Rest of the World
Industrial Laser Marking Industry REPORT HIGHLIGHTS
| Aspects | Details |
|---|---|
| Study Period | 2019-2033 |
| Base Year | 2024 |
| Estimated Year | 2025 |
| Forecast Period | 2025-2033 |
| Historical Period | 2019-2024 |
| Growth Rate | CAGR of 5.80% from 2019-2033 |
| Segmentation |
|
Table of Contents
- 1. Introduction
- 1.1. Research Scope
- 1.2. Market Segmentation
- 1.3. Research Methodology
- 1.4. Definitions and Assumptions
- 2. Executive Summary
- 2.1. Introduction
- 3. Market Dynamics
- 3.1. Introduction
- 3.2. Market Drivers
- 3.2.1. Increasing Applications in Various End-User Industries; Increased Investment in R&D leading to better Functionality
- 3.3. Market Restrains
- 3.3.1. ; Complexities Associated with the Design
- 3.4. Market Trends
- 3.4.1. Machine Tools to be the Largest End User
- 4. Market Factor Analysis
- 4.1. Porters Five Forces
- 4.2. Supply/Value Chain
- 4.3. PESTEL analysis
- 4.4. Market Entropy
- 4.5. Patent/Trademark Analysis
- 5. Global Industrial Laser Marking Industry Analysis, Insights and Forecast, 2019-2031
- 5.1. Market Analysis, Insights and Forecast - by Equipment
- 5.1.1. Fiber Laser
- 5.1.2. CO2 Laser
- 5.1.3. Solid State Laser
- 5.1.4. Other Equipment
- 5.2. Market Analysis, Insights and Forecast - by Offering
- 5.2.1. Hardware
- 5.2.2. Software
- 5.3. Market Analysis, Insights and Forecast - by End-user Industry
- 5.3.1. Healthcare
- 5.3.2. Automotive
- 5.3.3. Electronics
- 5.3.4. Machine Tools
- 5.3.5. Packaging
- 5.3.6. Other End-User Industries
- 5.4. Market Analysis, Insights and Forecast - by Region
- 5.4.1. North America
- 5.4.2. Europe
- 5.4.3. Asia Pacific
- 5.4.4. Rest of the World
- 5.1. Market Analysis, Insights and Forecast - by Equipment
- 6. North America Industrial Laser Marking Industry Analysis, Insights and Forecast, 2019-2031
- 6.1. Market Analysis, Insights and Forecast - by Equipment
- 6.1.1. Fiber Laser
- 6.1.2. CO2 Laser
- 6.1.3. Solid State Laser
- 6.1.4. Other Equipment
- 6.2. Market Analysis, Insights and Forecast - by Offering
- 6.2.1. Hardware
- 6.2.2. Software
- 6.3. Market Analysis, Insights and Forecast - by End-user Industry
- 6.3.1. Healthcare
- 6.3.2. Automotive
- 6.3.3. Electronics
- 6.3.4. Machine Tools
- 6.3.5. Packaging
- 6.3.6. Other End-User Industries
- 6.1. Market Analysis, Insights and Forecast - by Equipment
- 7. Europe Industrial Laser Marking Industry Analysis, Insights and Forecast, 2019-2031
- 7.1. Market Analysis, Insights and Forecast - by Equipment
- 7.1.1. Fiber Laser
- 7.1.2. CO2 Laser
- 7.1.3. Solid State Laser
- 7.1.4. Other Equipment
- 7.2. Market Analysis, Insights and Forecast - by Offering
- 7.2.1. Hardware
- 7.2.2. Software
- 7.3. Market Analysis, Insights and Forecast - by End-user Industry
- 7.3.1. Healthcare
- 7.3.2. Automotive
- 7.3.3. Electronics
- 7.3.4. Machine Tools
- 7.3.5. Packaging
- 7.3.6. Other End-User Industries
- 7.1. Market Analysis, Insights and Forecast - by Equipment
- 8. Asia Pacific Industrial Laser Marking Industry Analysis, Insights and Forecast, 2019-2031
- 8.1. Market Analysis, Insights and Forecast - by Equipment
- 8.1.1. Fiber Laser
- 8.1.2. CO2 Laser
- 8.1.3. Solid State Laser
- 8.1.4. Other Equipment
- 8.2. Market Analysis, Insights and Forecast - by Offering
- 8.2.1. Hardware
- 8.2.2. Software
- 8.3. Market Analysis, Insights and Forecast - by End-user Industry
- 8.3.1. Healthcare
- 8.3.2. Automotive
- 8.3.3. Electronics
- 8.3.4. Machine Tools
- 8.3.5. Packaging
- 8.3.6. Other End-User Industries
- 8.1. Market Analysis, Insights and Forecast - by Equipment
- 9. Rest of the World Industrial Laser Marking Industry Analysis, Insights and Forecast, 2019-2031
- 9.1. Market Analysis, Insights and Forecast - by Equipment
- 9.1.1. Fiber Laser
- 9.1.2. CO2 Laser
- 9.1.3. Solid State Laser
- 9.1.4. Other Equipment
- 9.2. Market Analysis, Insights and Forecast - by Offering
- 9.2.1. Hardware
- 9.2.2. Software
- 9.3. Market Analysis, Insights and Forecast - by End-user Industry
- 9.3.1. Healthcare
- 9.3.2. Automotive
- 9.3.3. Electronics
- 9.3.4. Machine Tools
- 9.3.5. Packaging
- 9.3.6. Other End-User Industries
- 9.1. Market Analysis, Insights and Forecast - by Equipment
- 10. North America Industrial Laser Marking Industry Analysis, Insights and Forecast, 2019-2031
- 10.1. Market Analysis, Insights and Forecast - By Country/Sub-region
- 10.1.1 United States
- 10.1.2 Canada
- 10.1.3 Mexico
- 11. Europe Industrial Laser Marking Industry Analysis, Insights and Forecast, 2019-2031
- 11.1. Market Analysis, Insights and Forecast - By Country/Sub-region
- 11.1.1 Germany
- 11.1.2 United Kingdom
- 11.1.3 France
- 11.1.4 Spain
- 11.1.5 Italy
- 11.1.6 Spain
- 11.1.7 Belgium
- 11.1.8 Netherland
- 11.1.9 Nordics
- 11.1.10 Rest of Europe
- 12. Asia Pacific Industrial Laser Marking Industry Analysis, Insights and Forecast, 2019-2031
- 12.1. Market Analysis, Insights and Forecast - By Country/Sub-region
- 12.1.1 China
- 12.1.2 Japan
- 12.1.3 India
- 12.1.4 South Korea
- 12.1.5 Southeast Asia
- 12.1.6 Australia
- 12.1.7 Indonesia
- 12.1.8 Phillipes
- 12.1.9 Singapore
- 12.1.10 Thailandc
- 12.1.11 Rest of Asia Pacific
- 13. South America Industrial Laser Marking Industry Analysis, Insights and Forecast, 2019-2031
- 13.1. Market Analysis, Insights and Forecast - By Country/Sub-region
- 13.1.1 Brazil
- 13.1.2 Argentina
- 13.1.3 Peru
- 13.1.4 Chile
- 13.1.5 Colombia
- 13.1.6 Ecuador
- 13.1.7 Venezuela
- 13.1.8 Rest of South America
- 14. North America Industrial Laser Marking Industry Analysis, Insights and Forecast, 2019-2031
- 14.1. Market Analysis, Insights and Forecast - By Country/Sub-region
- 14.1.1 United States
- 14.1.2 Canada
- 14.1.3 Mexico
- 15. MEA Industrial Laser Marking Industry Analysis, Insights and Forecast, 2019-2031
- 15.1. Market Analysis, Insights and Forecast - By Country/Sub-region
- 15.1.1 United Arab Emirates
- 15.1.2 Saudi Arabia
- 15.1.3 South Africa
- 15.1.4 Rest of Middle East and Africa
- 16. Competitive Analysis
- 16.1. Global Market Share Analysis 2024
- 16.2. Company Profiles
- 16.2.1 Keyence Corporation
- 16.2.1.1. Overview
- 16.2.1.2. Products
- 16.2.1.3. SWOT Analysis
- 16.2.1.4. Recent Developments
- 16.2.1.5. Financials (Based on Availability)
- 16.2.2 Coherent Corporation
- 16.2.2.1. Overview
- 16.2.2.2. Products
- 16.2.2.3. SWOT Analysis
- 16.2.2.4. Recent Developments
- 16.2.2.5. Financials (Based on Availability)
- 16.2.3 Videojet Technologies Inc
- 16.2.3.1. Overview
- 16.2.3.2. Products
- 16.2.3.3. SWOT Analysis
- 16.2.3.4. Recent Developments
- 16.2.3.5. Financials (Based on Availability)
- 16.2.4 Han's Laser Group
- 16.2.4.1. Overview
- 16.2.4.2. Products
- 16.2.4.3. SWOT Analysis
- 16.2.4.4. Recent Developments
- 16.2.4.5. Financials (Based on Availability)
- 16.2.5 Novanta Inc
- 16.2.5.1. Overview
- 16.2.5.2. Products
- 16.2.5.3. SWOT Analysis
- 16.2.5.4. Recent Developments
- 16.2.5.5. Financials (Based on Availability)
- 16.2.6 TRUMPF Group
- 16.2.6.1. Overview
- 16.2.6.2. Products
- 16.2.6.3. SWOT Analysis
- 16.2.6.4. Recent Developments
- 16.2.6.5. Financials (Based on Availability)
- 16.2.7 Gravotech Group
- 16.2.7.1. Overview
- 16.2.7.2. Products
- 16.2.7.3. SWOT Analysis
- 16.2.7.4. Recent Developments
- 16.2.7.5. Financials (Based on Availability)
- 16.2.8 IPG Photonics Corporation
- 16.2.8.1. Overview
- 16.2.8.2. Products
- 16.2.8.3. SWOT Analysis
- 16.2.8.4. Recent Developments
- 16.2.8.5. Financials (Based on Availability)
- 16.2.9 Epilog Corporation
- 16.2.9.1. Overview
- 16.2.9.2. Products
- 16.2.9.3. SWOT Analysis
- 16.2.9.4. Recent Developments
- 16.2.9.5. Financials (Based on Availability)
- 16.2.10 Mecco Partners LLC
- 16.2.10.1. Overview
- 16.2.10.2. Products
- 16.2.10.3. SWOT Analysis
- 16.2.10.4. Recent Developments
- 16.2.10.5. Financials (Based on Availability)
- 16.2.1 Keyence Corporation
List of Figures
- Figure 1: Global Industrial Laser Marking Industry Revenue Breakdown (Million, %) by Region 2024 & 2032
- Figure 2: North America Industrial Laser Marking Industry Revenue (Million), by Country 2024 & 2032
- Figure 3: North America Industrial Laser Marking Industry Revenue Share (%), by Country 2024 & 2032
- Figure 4: Europe Industrial Laser Marking Industry Revenue (Million), by Country 2024 & 2032
- Figure 5: Europe Industrial Laser Marking Industry Revenue Share (%), by Country 2024 & 2032
- Figure 6: Asia Pacific Industrial Laser Marking Industry Revenue (Million), by Country 2024 & 2032
- Figure 7: Asia Pacific Industrial Laser Marking Industry Revenue Share (%), by Country 2024 & 2032
- Figure 8: South America Industrial Laser Marking Industry Revenue (Million), by Country 2024 & 2032
- Figure 9: South America Industrial Laser Marking Industry Revenue Share (%), by Country 2024 & 2032
- Figure 10: North America Industrial Laser Marking Industry Revenue (Million), by Country 2024 & 2032
- Figure 11: North America Industrial Laser Marking Industry Revenue Share (%), by Country 2024 & 2032
- Figure 12: MEA Industrial Laser Marking Industry Revenue (Million), by Country 2024 & 2032
- Figure 13: MEA Industrial Laser Marking Industry Revenue Share (%), by Country 2024 & 2032
- Figure 14: North America Industrial Laser Marking Industry Revenue (Million), by Equipment 2024 & 2032
- Figure 15: North America Industrial Laser Marking Industry Revenue Share (%), by Equipment 2024 & 2032
- Figure 16: North America Industrial Laser Marking Industry Revenue (Million), by Offering 2024 & 2032
- Figure 17: North America Industrial Laser Marking Industry Revenue Share (%), by Offering 2024 & 2032
- Figure 18: North America Industrial Laser Marking Industry Revenue (Million), by End-user Industry 2024 & 2032
- Figure 19: North America Industrial Laser Marking Industry Revenue Share (%), by End-user Industry 2024 & 2032
- Figure 20: North America Industrial Laser Marking Industry Revenue (Million), by Country 2024 & 2032
- Figure 21: North America Industrial Laser Marking Industry Revenue Share (%), by Country 2024 & 2032
- Figure 22: Europe Industrial Laser Marking Industry Revenue (Million), by Equipment 2024 & 2032
- Figure 23: Europe Industrial Laser Marking Industry Revenue Share (%), by Equipment 2024 & 2032
- Figure 24: Europe Industrial Laser Marking Industry Revenue (Million), by Offering 2024 & 2032
- Figure 25: Europe Industrial Laser Marking Industry Revenue Share (%), by Offering 2024 & 2032
- Figure 26: Europe Industrial Laser Marking Industry Revenue (Million), by End-user Industry 2024 & 2032
- Figure 27: Europe Industrial Laser Marking Industry Revenue Share (%), by End-user Industry 2024 & 2032
- Figure 28: Europe Industrial Laser Marking Industry Revenue (Million), by Country 2024 & 2032
- Figure 29: Europe Industrial Laser Marking Industry Revenue Share (%), by Country 2024 & 2032
- Figure 30: Asia Pacific Industrial Laser Marking Industry Revenue (Million), by Equipment 2024 & 2032
- Figure 31: Asia Pacific Industrial Laser Marking Industry Revenue Share (%), by Equipment 2024 & 2032
- Figure 32: Asia Pacific Industrial Laser Marking Industry Revenue (Million), by Offering 2024 & 2032
- Figure 33: Asia Pacific Industrial Laser Marking Industry Revenue Share (%), by Offering 2024 & 2032
- Figure 34: Asia Pacific Industrial Laser Marking Industry Revenue (Million), by End-user Industry 2024 & 2032
- Figure 35: Asia Pacific Industrial Laser Marking Industry Revenue Share (%), by End-user Industry 2024 & 2032
- Figure 36: Asia Pacific Industrial Laser Marking Industry Revenue (Million), by Country 2024 & 2032
- Figure 37: Asia Pacific Industrial Laser Marking Industry Revenue Share (%), by Country 2024 & 2032
- Figure 38: Rest of the World Industrial Laser Marking Industry Revenue (Million), by Equipment 2024 & 2032
- Figure 39: Rest of the World Industrial Laser Marking Industry Revenue Share (%), by Equipment 2024 & 2032
- Figure 40: Rest of the World Industrial Laser Marking Industry Revenue (Million), by Offering 2024 & 2032
- Figure 41: Rest of the World Industrial Laser Marking Industry Revenue Share (%), by Offering 2024 & 2032
- Figure 42: Rest of the World Industrial Laser Marking Industry Revenue (Million), by End-user Industry 2024 & 2032
- Figure 43: Rest of the World Industrial Laser Marking Industry Revenue Share (%), by End-user Industry 2024 & 2032
- Figure 44: Rest of the World Industrial Laser Marking Industry Revenue (Million), by Country 2024 & 2032
- Figure 45: Rest of the World Industrial Laser Marking Industry Revenue Share (%), by Country 2024 & 2032
List of Tables
- Table 1: Global Industrial Laser Marking Industry Revenue Million Forecast, by Region 2019 & 2032
- Table 2: Global Industrial Laser Marking Industry Revenue Million Forecast, by Equipment 2019 & 2032
- Table 3: Global Industrial Laser Marking Industry Revenue Million Forecast, by Offering 2019 & 2032
- Table 4: Global Industrial Laser Marking Industry Revenue Million Forecast, by End-user Industry 2019 & 2032
- Table 5: Global Industrial Laser Marking Industry Revenue Million Forecast, by Region 2019 & 2032
- Table 6: Global Industrial Laser Marking Industry Revenue Million Forecast, by Country 2019 & 2032
- Table 7: United States Industrial Laser Marking Industry Revenue (Million) Forecast, by Application 2019 & 2032
- Table 8: Canada Industrial Laser Marking Industry Revenue (Million) Forecast, by Application 2019 & 2032
- Table 9: Mexico Industrial Laser Marking Industry Revenue (Million) Forecast, by Application 2019 & 2032
- Table 10: Global Industrial Laser Marking Industry Revenue Million Forecast, by Country 2019 & 2032
- Table 11: Germany Industrial Laser Marking Industry Revenue (Million) Forecast, by Application 2019 & 2032
- Table 12: United Kingdom Industrial Laser Marking Industry Revenue (Million) Forecast, by Application 2019 & 2032
- Table 13: France Industrial Laser Marking Industry Revenue (Million) Forecast, by Application 2019 & 2032
- Table 14: Spain Industrial Laser Marking Industry Revenue (Million) Forecast, by Application 2019 & 2032
- Table 15: Italy Industrial Laser Marking Industry Revenue (Million) Forecast, by Application 2019 & 2032
- Table 16: Spain Industrial Laser Marking Industry Revenue (Million) Forecast, by Application 2019 & 2032
- Table 17: Belgium Industrial Laser Marking Industry Revenue (Million) Forecast, by Application 2019 & 2032
- Table 18: Netherland Industrial Laser Marking Industry Revenue (Million) Forecast, by Application 2019 & 2032
- Table 19: Nordics Industrial Laser Marking Industry Revenue (Million) Forecast, by Application 2019 & 2032
- Table 20: Rest of Europe Industrial Laser Marking Industry Revenue (Million) Forecast, by Application 2019 & 2032
- Table 21: Global Industrial Laser Marking Industry Revenue Million Forecast, by Country 2019 & 2032
- Table 22: China Industrial Laser Marking Industry Revenue (Million) Forecast, by Application 2019 & 2032
- Table 23: Japan Industrial Laser Marking Industry Revenue (Million) Forecast, by Application 2019 & 2032
- Table 24: India Industrial Laser Marking Industry Revenue (Million) Forecast, by Application 2019 & 2032
- Table 25: South Korea Industrial Laser Marking Industry Revenue (Million) Forecast, by Application 2019 & 2032
- Table 26: Southeast Asia Industrial Laser Marking Industry Revenue (Million) Forecast, by Application 2019 & 2032
- Table 27: Australia Industrial Laser Marking Industry Revenue (Million) Forecast, by Application 2019 & 2032
- Table 28: Indonesia Industrial Laser Marking Industry Revenue (Million) Forecast, by Application 2019 & 2032
- Table 29: Phillipes Industrial Laser Marking Industry Revenue (Million) Forecast, by Application 2019 & 2032
- Table 30: Singapore Industrial Laser Marking Industry Revenue (Million) Forecast, by Application 2019 & 2032
- Table 31: Thailandc Industrial Laser Marking Industry Revenue (Million) Forecast, by Application 2019 & 2032
- Table 32: Rest of Asia Pacific Industrial Laser Marking Industry Revenue (Million) Forecast, by Application 2019 & 2032
- Table 33: Global Industrial Laser Marking Industry Revenue Million Forecast, by Country 2019 & 2032
- Table 34: Brazil Industrial Laser Marking Industry Revenue (Million) Forecast, by Application 2019 & 2032
- Table 35: Argentina Industrial Laser Marking Industry Revenue (Million) Forecast, by Application 2019 & 2032
- Table 36: Peru Industrial Laser Marking Industry Revenue (Million) Forecast, by Application 2019 & 2032
- Table 37: Chile Industrial Laser Marking Industry Revenue (Million) Forecast, by Application 2019 & 2032
- Table 38: Colombia Industrial Laser Marking Industry Revenue (Million) Forecast, by Application 2019 & 2032
- Table 39: Ecuador Industrial Laser Marking Industry Revenue (Million) Forecast, by Application 2019 & 2032
- Table 40: Venezuela Industrial Laser Marking Industry Revenue (Million) Forecast, by Application 2019 & 2032
- Table 41: Rest of South America Industrial Laser Marking Industry Revenue (Million) Forecast, by Application 2019 & 2032
- Table 42: Global Industrial Laser Marking Industry Revenue Million Forecast, by Country 2019 & 2032
- Table 43: United States Industrial Laser Marking Industry Revenue (Million) Forecast, by Application 2019 & 2032
- Table 44: Canada Industrial Laser Marking Industry Revenue (Million) Forecast, by Application 2019 & 2032
- Table 45: Mexico Industrial Laser Marking Industry Revenue (Million) Forecast, by Application 2019 & 2032
- Table 46: Global Industrial Laser Marking Industry Revenue Million Forecast, by Country 2019 & 2032
- Table 47: United Arab Emirates Industrial Laser Marking Industry Revenue (Million) Forecast, by Application 2019 & 2032
- Table 48: Saudi Arabia Industrial Laser Marking Industry Revenue (Million) Forecast, by Application 2019 & 2032
- Table 49: South Africa Industrial Laser Marking Industry Revenue (Million) Forecast, by Application 2019 & 2032
- Table 50: Rest of Middle East and Africa Industrial Laser Marking Industry Revenue (Million) Forecast, by Application 2019 & 2032
- Table 51: Global Industrial Laser Marking Industry Revenue Million Forecast, by Equipment 2019 & 2032
- Table 52: Global Industrial Laser Marking Industry Revenue Million Forecast, by Offering 2019 & 2032
- Table 53: Global Industrial Laser Marking Industry Revenue Million Forecast, by End-user Industry 2019 & 2032
- Table 54: Global Industrial Laser Marking Industry Revenue Million Forecast, by Country 2019 & 2032
- Table 55: Global Industrial Laser Marking Industry Revenue Million Forecast, by Equipment 2019 & 2032
- Table 56: Global Industrial Laser Marking Industry Revenue Million Forecast, by Offering 2019 & 2032
- Table 57: Global Industrial Laser Marking Industry Revenue Million Forecast, by End-user Industry 2019 & 2032
- Table 58: Global Industrial Laser Marking Industry Revenue Million Forecast, by Country 2019 & 2032
- Table 59: Global Industrial Laser Marking Industry Revenue Million Forecast, by Equipment 2019 & 2032
- Table 60: Global Industrial Laser Marking Industry Revenue Million Forecast, by Offering 2019 & 2032
- Table 61: Global Industrial Laser Marking Industry Revenue Million Forecast, by End-user Industry 2019 & 2032
- Table 62: Global Industrial Laser Marking Industry Revenue Million Forecast, by Country 2019 & 2032
- Table 63: Global Industrial Laser Marking Industry Revenue Million Forecast, by Equipment 2019 & 2032
- Table 64: Global Industrial Laser Marking Industry Revenue Million Forecast, by Offering 2019 & 2032
- Table 65: Global Industrial Laser Marking Industry Revenue Million Forecast, by End-user Industry 2019 & 2032
- Table 66: Global Industrial Laser Marking Industry Revenue Million Forecast, by Country 2019 & 2032
Frequently Asked Questions
1. What is the projected Compound Annual Growth Rate (CAGR) of the Industrial Laser Marking Industry?
The projected CAGR is approximately 5.80%.
2. Which companies are prominent players in the Industrial Laser Marking Industry?
Key companies in the market include Keyence Corporation, Coherent Corporation, Videojet Technologies Inc, Han's Laser Group, Novanta Inc, TRUMPF Group, Gravotech Group, IPG Photonics Corporation, Epilog Corporation, Mecco Partners LLC.
3. What are the main segments of the Industrial Laser Marking Industry?
The market segments include Equipment, Offering, End-user Industry.
4. Can you provide details about the market size?
The market size is estimated to be USD 3.91 Million as of 2022.
5. What are some drivers contributing to market growth?
Increasing Applications in Various End-User Industries; Increased Investment in R&D leading to better Functionality.
6. What are the notable trends driving market growth?
Machine Tools to be the Largest End User.
7. Are there any restraints impacting market growth?
; Complexities Associated with the Design.
8. Can you provide examples of recent developments in the market?
May 2023 - Norlase announced that it completed the most significant investment round. The funding was led by London-based firm West Hill Capital, which raised USD 11 million. According to the company, the funding comes on the heels of the FDA clearance and CE mark approval of its pattern laser (ECHO). Norlase can also ramp up production for the Laser pattern and its other cutting-edge laser treatment solutions if funding is available. In the face of a global shortage of eye surgeons and growing patient numbers because of an epidemic increase in diabetes and age, this is critical.
9. What pricing options are available for accessing the report?
Pricing options include single-user, multi-user, and enterprise licenses priced at USD 4750, USD 5250, and USD 8750 respectively.
10. Is the market size provided in terms of value or volume?
The market size is provided in terms of value, measured in Million.
11. Are there any specific market keywords associated with the report?
Yes, the market keyword associated with the report is "Industrial Laser Marking Industry," which aids in identifying and referencing the specific market segment covered.
12. How do I determine which pricing option suits my needs best?
The pricing options vary based on user requirements and access needs. Individual users may opt for single-user licenses, while businesses requiring broader access may choose multi-user or enterprise licenses for cost-effective access to the report.
13. Are there any additional resources or data provided in the Industrial Laser Marking Industry report?
While the report offers comprehensive insights, it's advisable to review the specific contents or supplementary materials provided to ascertain if additional resources or data are available.
14. How can I stay updated on further developments or reports in the Industrial Laser Marking Industry?
To stay informed about further developments, trends, and reports in the Industrial Laser Marking Industry, consider subscribing to industry newsletters, following relevant companies and organizations, or regularly checking reputable industry news sources and publications.
Methodology
Step 1 - Identification of Relevant Samples Size from Population Database


Step 2 - Approaches for Defining Global Market Size (Value, Volume* & Price*)

Note*: In applicable scenarios
Step 3 - Data Sources
Primary Research
- Web Analytics
- Survey Reports
- Research Institute
- Latest Research Reports
- Opinion Leaders
Secondary Research
- Annual Reports
- White Paper
- Latest Press Release
- Industry Association
- Paid Database
- Investor Presentations

Step 4 - Data Triangulation
Involves using different sources of information in order to increase the validity of a study
These sources are likely to be stakeholders in a program - participants, other researchers, program staff, other community members, and so on.
Then we put all data in single framework & apply various statistical tools to find out the dynamic on the market.
During the analysis stage, feedback from the stakeholder groups would be compared to determine areas of agreement as well as areas of divergence


