

Key Insights
The global industrial pumps market is projected to reach $48.2 billion by 2025, with an anticipated compound annual growth rate (CAGR) of 4.75% from 2025 to 2033. This significant expansion is primarily driven by escalating demand for high-efficiency pumping solutions across key sectors like oil & gas, water & wastewater treatment, and chemicals. Global infrastructure development, particularly in emerging economies, further bolsters market prospects. Advancements in smart pump technology, offering enhanced monitoring and control, are improving operational efficiency and reducing costs, thereby stimulating adoption. Additionally, stringent environmental regulations are compelling industries to embrace sustainable and energy-efficient pumping solutions. The market segmentation by pump type and end-user industry presents diverse growth avenues. While North America and Europe currently dominate, the Asia-Pacific region is expected to witness rapid expansion due to robust industrialization and infrastructure initiatives.
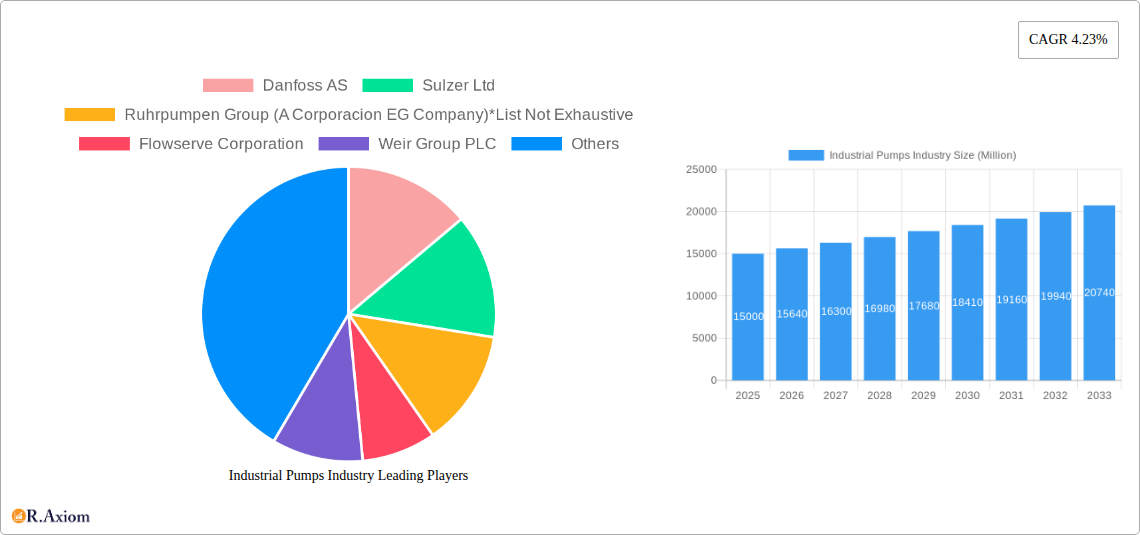
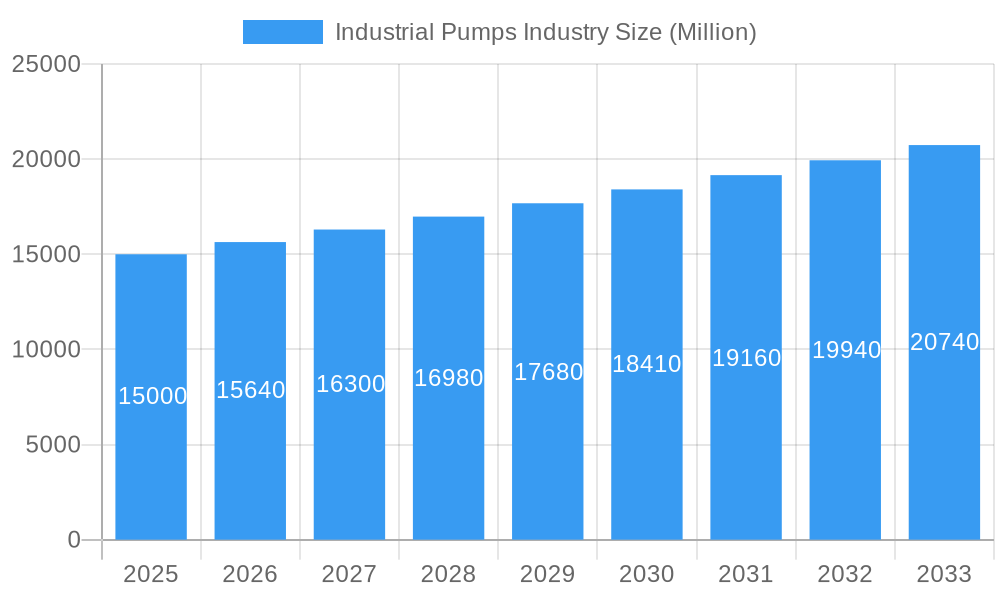
Industrial Pumps Industry Market Size (In Billion)
Market growth is tempered by challenges such as volatile raw material prices, impacting manufacturing costs. The substantial initial investment required for advanced pumping technologies may hinder adoption by smaller enterprises. Global economic uncertainties and geopolitical risks also pose indirect threats to market expansion. Despite these constraints, the long-term market outlook remains optimistic, driven by the persistent need for reliable and efficient pumping systems across various industries. The competitive environment features established global entities and specialized regional players focused on innovation and strategic collaborations.
Industrial Pumps Industry Company Market Share
Industrial Pumps Industry: A Comprehensive Market Report (2019-2033)
This in-depth report provides a comprehensive analysis of the global industrial pumps market, encompassing market size, segmentation, key players, growth drivers, challenges, and future outlook. The study period covers 2019-2033, with 2025 as the base and estimated year. The report leverages extensive primary and secondary research to deliver actionable insights for industry stakeholders, including manufacturers, investors, and end-users. The total market size is projected to reach xx Million by 2033.
Industrial Pumps Industry Market Concentration & Innovation
The global industrial pumps market is characterized by a moderately concentrated landscape with several major players holding significant market share. Companies like Danfoss AS, Sulzer Ltd, Ruhrpumpen Group, Flowserve Corporation, Weir Group PLC, and Xylem Inc dominate the market, collectively accounting for an estimated xx% market share in 2025. However, the market also includes numerous smaller players, creating a dynamic competitive environment.
Innovation within the sector is driven by several factors:
- Technological advancements: The development of energy-efficient pumps, smart pumps with advanced monitoring capabilities, and pumps designed for handling increasingly challenging fluids (e.g., corrosive chemicals, high-temperature liquids) are key innovation drivers.
- Stringent environmental regulations: Growing environmental concerns are leading to stricter emission standards and a demand for more sustainable pump technologies. This pushes manufacturers to develop eco-friendly pumps and reduce their carbon footprint.
- Industry 4.0 adoption: The integration of digital technologies, such as IoT and AI, is transforming pump operations, allowing for predictive maintenance and improved efficiency.
Mergers and acquisitions (M&A) play a significant role in shaping the market landscape. In recent years, deal values have averaged xx Million annually, with acquisitions often focusing on expanding product portfolios, geographic reach, or technological capabilities. Examples include the acquisition of [insert example M&A deal if data is available, otherwise use "xx"].
Industrial Pumps Industry Industry Trends & Insights
The industrial pumps market is experiencing robust growth, driven by several key factors. The Compound Annual Growth Rate (CAGR) is projected to be xx% during the forecast period (2025-2033). Increased industrialization in developing economies, rising demand from various end-user industries, and the growing adoption of advanced pump technologies are major contributors to this growth.
Technological advancements, particularly in areas like materials science and digitalization, are significantly impacting the market. The introduction of high-performance materials capable of withstanding harsh operating conditions has expanded the application range of industrial pumps. Furthermore, the integration of smart technologies allows for remote monitoring, predictive maintenance, and optimized operational efficiency, reducing downtime and improving overall productivity.
Consumer preferences are shifting towards energy-efficient and environmentally friendly pumps. This trend is pushing manufacturers to focus on developing sustainable solutions and reducing the environmental footprint of their products. Market penetration of energy-efficient pumps is projected to reach xx% by 2033. The competitive landscape is highly dynamic, with existing players continuously innovating and new entrants emerging. The market witnesses constant competition based on price, quality, performance, and technological advancements.
Dominant Markets & Segments in Industrial Pumps Industry
The Oil and Gas segment is currently the largest end-user industry for industrial pumps, driven by high demand for pumps in oil extraction, refining, and transportation. The Water and Wastewater segment is experiencing rapid growth due to increasing investments in water infrastructure projects globally. Within pump types, Centrifugal pumps dominate the market due to their versatility, efficiency, and relatively lower cost.
- Key Drivers for Oil and Gas: Exploration and production activities, pipeline networks, and refinery operations.
- Key Drivers for Water and Wastewater: Municipal water treatment plants, industrial wastewater treatment, irrigation systems.
- Key Drivers for Centrifugal Pumps: High efficiency, low maintenance, and suitability for various applications.
While the US and China are currently leading in terms of market size, rapidly developing regions such as India and Southeast Asia present significant growth opportunities. Economic policies promoting industrial development and infrastructure investments are key drivers in these regions.
Industrial Pumps Industry Product Developments
Recent product innovations focus on improving energy efficiency, increasing reliability, and enhancing operational flexibility. Smart pumps with advanced monitoring and control systems are gaining traction, enabling predictive maintenance and optimized performance. The development of pumps capable of handling increasingly challenging fluids, such as corrosive chemicals and high-temperature liquids, is also driving innovation. These advancements address the needs of various industries, particularly those with stringent environmental regulations or operating in harsh conditions.
Report Scope & Segmentation Analysis
This report segments the industrial pumps market based on end-user industry (Oil and Gas, Water and Wastewater, Chemicals and Petrochemicals, Mining, Power Generation, Other End-user Industries) and pump type (Centrifugal Pump, Reciprocating Pump, Rotary Pump, Other Pump Types). Each segment's growth projections, market size, and competitive dynamics are analyzed in detail. Growth in each segment varies depending on factors such as infrastructural development, technological adoption and industry-specific regulatory changes. The report provides detailed market sizing and forecasts for each segment throughout the study period. Competitive dynamics vary depending on technological specialization and market penetration across various segments.
Key Drivers of Industrial Pumps Industry Growth
Several factors fuel the growth of the industrial pumps market. These include:
- Rising industrialization: The expansion of various industries globally drives the demand for industrial pumps.
- Infrastructure development: Investments in water infrastructure, oil & gas pipelines, and power generation facilities significantly impact pump demand.
- Technological advancements: The development of efficient and reliable pumps caters to the needs of demanding applications.
- Government regulations: Stringent environmental regulations drive adoption of energy-efficient and sustainable pumps.
Challenges in the Industrial Pumps Industry Sector
The industrial pumps industry faces several challenges:
- Supply chain disruptions: Global supply chain volatility impacting raw material availability and production costs.
- Intense competition: Competition among established players and new entrants leads to pricing pressures.
- Fluctuations in commodity prices: Raw material price volatility directly impacts production costs and profitability.
- Stringent regulations: Meeting stringent environmental and safety regulations increases compliance costs. Estimated cost impact is xx Million annually.
Emerging Opportunities in Industrial Pumps Industry
Several opportunities are emerging within the industrial pumps sector:
- Growth in renewable energy: The rise of renewable energy sources, particularly solar and wind power, creates demand for pumps in associated infrastructure.
- Smart pump technology: The adoption of IoT and AI in pump systems enhances efficiency and reduces operational costs.
- Expansion into emerging markets: Developing economies offer significant growth potential for industrial pump manufacturers.
- Demand for sustainable solutions: Growing environmental consciousness pushes demand for energy-efficient and eco-friendly pumps.
Leading Players in the Industrial Pumps Industry Market
- Danfoss AS
- Sulzer Ltd
- Ruhrpumpen Group (A Corporacion EG Company)
- Flowserve Corporation
- Weir Group PLC
- Xylem Inc
- SPP Pumps Inc
- Clyde Union Inc
- Schlumberger Ltd
- Ebara Corp
- ITT Inc
- Grundfos Holding AS
- Dover Corporation
- SPX Flow Inc
- Baker Hughes Company
- Wilo Mather & Platt Pumps Pvt Ltd
- KSB AG
- General Electric Company
Key Developments in Industrial Pumps Industry Industry
- February 2023: EBARA Corporation successfully developed one of the world's first liquid hydrogen booster pumps for hydrogen power generation. This development reflects the growing interest and investment in hydrogen technologies.
- January 2023: Sulzer launched an updated submersible recirculation pump with a 20% improvement in hydraulic efficiency. This highlights the ongoing focus on energy efficiency and performance optimization within the industry.
- June 2022: Flowserve Corporation secured a contract to supply pumps for liquid immersion cooling technology. This signifies the expansion of industrial pump applications into new and emerging technological fields.
Strategic Outlook for Industrial Pumps Industry Market
The industrial pumps market is poised for continued growth, driven by long-term trends in industrialization, infrastructure development, and technological innovation. The focus on sustainability and energy efficiency will continue to shape product development and market dynamics. Opportunities exist in emerging markets and in the integration of smart technologies. This positive outlook indicates significant potential for growth and investment within the sector over the next decade.
Industrial Pumps Industry Segmentation
-
1. Type
- 1.1. Centrifugal Pump
- 1.2. Reciprocating Pump
- 1.3. Rotary Pump
- 1.4. Other Pump Types
-
2. End-user Industry
- 2.1. Oil and Gas
- 2.2. Water and Wastewater
- 2.3. Chemicals and Petrochemicals
- 2.4. Mining
- 2.5. Power Generation
- 2.6. Other End-user Industries
Industrial Pumps Industry Segmentation By Geography
-
1. North America
- 1.1. United States of America
- 1.2. Canada
- 1.3. Rest of the North America
-
2. Asia Pacific
- 2.1. India
- 2.2. China
- 2.3. South Korea
- 2.4. Rest of the Asia Pacific
-
3. Europe
- 3.1. Germany
- 3.2. United Kingdom
- 3.3. France
- 3.4. Italy
- 3.5. Rest of the Europe
-
4. South America
- 4.1. Brazil
- 4.2. Argentina
- 4.3. Rest of the South America
-
5. Middle East and Africa
- 5.1. United Arab Emirates
- 5.2. Saudi Arabia
- 5.3. Iraq
- 5.4. Rest of the Middle East and Africa
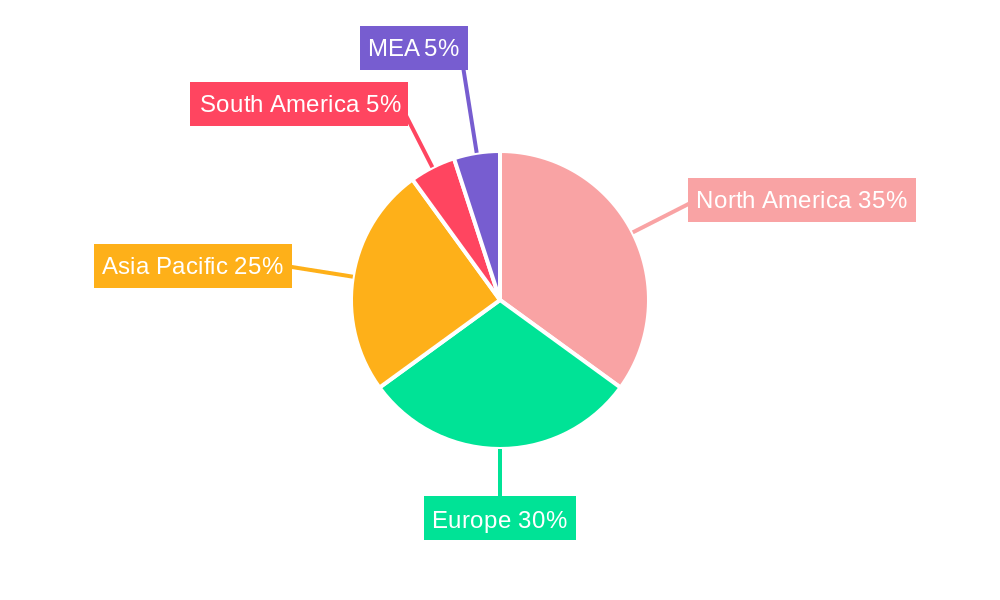
Industrial Pumps Industry Regional Market Share
Geographic Coverage of Industrial Pumps Industry
Industrial Pumps Industry REPORT HIGHLIGHTS
| Aspects | Details |
|---|---|
| Study Period | 2020-2034 |
| Base Year | 2025 |
| Estimated Year | 2026 |
| Forecast Period | 2026-2034 |
| Historical Period | 2020-2025 |
| Growth Rate | CAGR of 4.75% from 2020-2034 |
| Segmentation |
|
Table of Contents
- 1. Introduction
- 1.1. Research Scope
- 1.2. Market Segmentation
- 1.3. Research Objective
- 1.4. Definitions and Assumptions
- 2. Executive Summary
- 2.1. Market Snapshot
- 3. Market Dynamics
- 3.1. Market Drivers
- 3.2. Market Restrains
- 3.3. Market Trends
- 3.4. Market Opportunities
- 4. Market Factor Analysis
- 4.1. Porters Five Forces
- 4.1.1. Bargaining Power of Suppliers
- 4.1.2. Bargaining Power of Buyers
- 4.1.3. Threat of New Entrants
- 4.1.4. Threat of Substitutes
- 4.1.5. Competitive Rivalry
- 4.2. PESTEL analysis
- 4.3. BCG Analysis
- 4.3.1. Stars (High Growth, High Market Share)
- 4.3.2. Cash Cows (Low Growth, High Market Share)
- 4.3.3. Question Mark (High Growth, Low Market Share)
- 4.3.4. Dogs (Low Growth, Low Market Share)
- 4.4. Ansoff Matrix Analysis
- 4.5. Supply Chain Analysis
- 4.6. Regulatory Landscape
- 4.7. Current Market Potential and Opportunity Assessment (TAM–SAM–SOM Framework)
- 4.8. RAX Analyst Note
- 4.1. Porters Five Forces
- 5. Market Analysis, Insights and Forecast 2021-2033
- 5.1. Market Analysis, Insights and Forecast - by Type
- 5.1.1. Centrifugal Pump
- 5.1.2. Reciprocating Pump
- 5.1.3. Rotary Pump
- 5.1.4. Other Pump Types
- 5.2. Market Analysis, Insights and Forecast - by End-user Industry
- 5.2.1. Oil and Gas
- 5.2.2. Water and Wastewater
- 5.2.3. Chemicals and Petrochemicals
- 5.2.4. Mining
- 5.2.5. Power Generation
- 5.2.6. Other End-user Industries
- 5.3. Market Analysis, Insights and Forecast - by Region
- 5.3.1. North America
- 5.3.2. Asia Pacific
- 5.3.3. Europe
- 5.3.4. South America
- 5.3.5. Middle East and Africa
- 5.1. Market Analysis, Insights and Forecast - by Type
- 6. Global Industrial Pumps Industry Analysis, Insights and Forecast, 2021-2033
- 6.1. Market Analysis, Insights and Forecast - by Type
- 6.1.1. Centrifugal Pump
- 6.1.2. Reciprocating Pump
- 6.1.3. Rotary Pump
- 6.1.4. Other Pump Types
- 6.2. Market Analysis, Insights and Forecast - by End-user Industry
- 6.2.1. Oil and Gas
- 6.2.2. Water and Wastewater
- 6.2.3. Chemicals and Petrochemicals
- 6.2.4. Mining
- 6.2.5. Power Generation
- 6.2.6. Other End-user Industries
- 6.1. Market Analysis, Insights and Forecast - by Type
- 7. North America Industrial Pumps Industry Analysis, Insights and Forecast, 2020-2032
- 7.1. Market Analysis, Insights and Forecast - by Type
- 7.1.1. Centrifugal Pump
- 7.1.2. Reciprocating Pump
- 7.1.3. Rotary Pump
- 7.1.4. Other Pump Types
- 7.2. Market Analysis, Insights and Forecast - by End-user Industry
- 7.2.1. Oil and Gas
- 7.2.2. Water and Wastewater
- 7.2.3. Chemicals and Petrochemicals
- 7.2.4. Mining
- 7.2.5. Power Generation
- 7.2.6. Other End-user Industries
- 7.1. Market Analysis, Insights and Forecast - by Type
- 8. Asia Pacific Industrial Pumps Industry Analysis, Insights and Forecast, 2020-2032
- 8.1. Market Analysis, Insights and Forecast - by Type
- 8.1.1. Centrifugal Pump
- 8.1.2. Reciprocating Pump
- 8.1.3. Rotary Pump
- 8.1.4. Other Pump Types
- 8.2. Market Analysis, Insights and Forecast - by End-user Industry
- 8.2.1. Oil and Gas
- 8.2.2. Water and Wastewater
- 8.2.3. Chemicals and Petrochemicals
- 8.2.4. Mining
- 8.2.5. Power Generation
- 8.2.6. Other End-user Industries
- 8.1. Market Analysis, Insights and Forecast - by Type
- 9. Europe Industrial Pumps Industry Analysis, Insights and Forecast, 2020-2032
- 9.1. Market Analysis, Insights and Forecast - by Type
- 9.1.1. Centrifugal Pump
- 9.1.2. Reciprocating Pump
- 9.1.3. Rotary Pump
- 9.1.4. Other Pump Types
- 9.2. Market Analysis, Insights and Forecast - by End-user Industry
- 9.2.1. Oil and Gas
- 9.2.2. Water and Wastewater
- 9.2.3. Chemicals and Petrochemicals
- 9.2.4. Mining
- 9.2.5. Power Generation
- 9.2.6. Other End-user Industries
- 9.1. Market Analysis, Insights and Forecast - by Type
- 10. South America Industrial Pumps Industry Analysis, Insights and Forecast, 2020-2032
- 10.1. Market Analysis, Insights and Forecast - by Type
- 10.1.1. Centrifugal Pump
- 10.1.2. Reciprocating Pump
- 10.1.3. Rotary Pump
- 10.1.4. Other Pump Types
- 10.2. Market Analysis, Insights and Forecast - by End-user Industry
- 10.2.1. Oil and Gas
- 10.2.2. Water and Wastewater
- 10.2.3. Chemicals and Petrochemicals
- 10.2.4. Mining
- 10.2.5. Power Generation
- 10.2.6. Other End-user Industries
- 10.1. Market Analysis, Insights and Forecast - by Type
- 11. Middle East and Africa Industrial Pumps Industry Analysis, Insights and Forecast, 2020-2032
- 11.1. Market Analysis, Insights and Forecast - by Type
- 11.1.1. Centrifugal Pump
- 11.1.2. Reciprocating Pump
- 11.1.3. Rotary Pump
- 11.1.4. Other Pump Types
- 11.2. Market Analysis, Insights and Forecast - by End-user Industry
- 11.2.1. Oil and Gas
- 11.2.2. Water and Wastewater
- 11.2.3. Chemicals and Petrochemicals
- 11.2.4. Mining
- 11.2.5. Power Generation
- 11.2.6. Other End-user Industries
- 11.1. Market Analysis, Insights and Forecast - by Type
- 12. Competitive Analysis
- 12.1. Company Profiles
- 12.1.1 Danfoss AS
- 12.1.1.1. Company Overview
- 12.1.1.2. Products
- 12.1.1.3. Company Financials
- 12.1.1.4. SWOT Analysis
- 12.1.2 Sulzer Ltd
- 12.1.2.1. Company Overview
- 12.1.2.2. Products
- 12.1.2.3. Company Financials
- 12.1.2.4. SWOT Analysis
- 12.1.3 Ruhrpumpen Group (A Corporacion EG Company)*List Not Exhaustive
- 12.1.3.1. Company Overview
- 12.1.3.2. Products
- 12.1.3.3. Company Financials
- 12.1.3.4. SWOT Analysis
- 12.1.4 Flowserve Corporation
- 12.1.4.1. Company Overview
- 12.1.4.2. Products
- 12.1.4.3. Company Financials
- 12.1.4.4. SWOT Analysis
- 12.1.5 Weir Group PLC
- 12.1.5.1. Company Overview
- 12.1.5.2. Products
- 12.1.5.3. Company Financials
- 12.1.5.4. SWOT Analysis
- 12.1.6 Xylem Inc
- 12.1.6.1. Company Overview
- 12.1.6.2. Products
- 12.1.6.3. Company Financials
- 12.1.6.4. SWOT Analysis
- 12.1.7 SPP Pumps Inc
- 12.1.7.1. Company Overview
- 12.1.7.2. Products
- 12.1.7.3. Company Financials
- 12.1.7.4. SWOT Analysis
- 12.1.8 Clyde Union Inc
- 12.1.8.1. Company Overview
- 12.1.8.2. Products
- 12.1.8.3. Company Financials
- 12.1.8.4. SWOT Analysis
- 12.1.9 Schlumberger Ltd
- 12.1.9.1. Company Overview
- 12.1.9.2. Products
- 12.1.9.3. Company Financials
- 12.1.9.4. SWOT Analysis
- 12.1.10 Ebara Corp
- 12.1.10.1. Company Overview
- 12.1.10.2. Products
- 12.1.10.3. Company Financials
- 12.1.10.4. SWOT Analysis
- 12.1.11 ITT Inc
- 12.1.11.1. Company Overview
- 12.1.11.2. Products
- 12.1.11.3. Company Financials
- 12.1.11.4. SWOT Analysis
- 12.1.12 Grundfos Holding AS
- 12.1.12.1. Company Overview
- 12.1.12.2. Products
- 12.1.12.3. Company Financials
- 12.1.12.4. SWOT Analysis
- 12.1.13 Dover Corporation
- 12.1.13.1. Company Overview
- 12.1.13.2. Products
- 12.1.13.3. Company Financials
- 12.1.13.4. SWOT Analysis
- 12.1.14 SPX Flow Inc
- 12.1.14.1. Company Overview
- 12.1.14.2. Products
- 12.1.14.3. Company Financials
- 12.1.14.4. SWOT Analysis
- 12.1.15 Baker Hughes Company
- 12.1.15.1. Company Overview
- 12.1.15.2. Products
- 12.1.15.3. Company Financials
- 12.1.15.4. SWOT Analysis
- 12.1.16 Wilo Mather & Platt Pumps Pvt Ltd
- 12.1.16.1. Company Overview
- 12.1.16.2. Products
- 12.1.16.3. Company Financials
- 12.1.16.4. SWOT Analysis
- 12.1.17 KSB AG
- 12.1.17.1. Company Overview
- 12.1.17.2. Products
- 12.1.17.3. Company Financials
- 12.1.17.4. SWOT Analysis
- 12.1.18 General Electric Company
- 12.1.18.1. Company Overview
- 12.1.18.2. Products
- 12.1.18.3. Company Financials
- 12.1.18.4. SWOT Analysis
- 12.1.1 Danfoss AS
- 12.2. Market Entropy
- 12.2.1 Company's Key Areas Served
- 12.2.2 Recent Developments
- 12.3. Company Market Share Analysis 2025
- 12.3.1 Top 5 Companies Market Share Analysis
- 12.3.2 Top 3 Companies Market Share Analysis
- 12.4. List of Potential Customers
- 13. Research Methodology
List of Figures
- Figure 1: Global Industrial Pumps Industry Revenue Breakdown (billion, %) by Region 2025 & 2033
- Figure 2: Global Industrial Pumps Industry Volume Breakdown (K Unit, %) by Region 2025 & 2033
- Figure 3: North America Industrial Pumps Industry Revenue (billion), by Type 2025 & 2033
- Figure 4: North America Industrial Pumps Industry Volume (K Unit), by Type 2025 & 2033
- Figure 5: North America Industrial Pumps Industry Revenue Share (%), by Type 2025 & 2033
- Figure 6: North America Industrial Pumps Industry Volume Share (%), by Type 2025 & 2033
- Figure 7: North America Industrial Pumps Industry Revenue (billion), by End-user Industry 2025 & 2033
- Figure 8: North America Industrial Pumps Industry Volume (K Unit), by End-user Industry 2025 & 2033
- Figure 9: North America Industrial Pumps Industry Revenue Share (%), by End-user Industry 2025 & 2033
- Figure 10: North America Industrial Pumps Industry Volume Share (%), by End-user Industry 2025 & 2033
- Figure 11: North America Industrial Pumps Industry Revenue (billion), by Country 2025 & 2033
- Figure 12: North America Industrial Pumps Industry Volume (K Unit), by Country 2025 & 2033
- Figure 13: North America Industrial Pumps Industry Revenue Share (%), by Country 2025 & 2033
- Figure 14: North America Industrial Pumps Industry Volume Share (%), by Country 2025 & 2033
- Figure 15: Asia Pacific Industrial Pumps Industry Revenue (billion), by Type 2025 & 2033
- Figure 16: Asia Pacific Industrial Pumps Industry Volume (K Unit), by Type 2025 & 2033
- Figure 17: Asia Pacific Industrial Pumps Industry Revenue Share (%), by Type 2025 & 2033
- Figure 18: Asia Pacific Industrial Pumps Industry Volume Share (%), by Type 2025 & 2033
- Figure 19: Asia Pacific Industrial Pumps Industry Revenue (billion), by End-user Industry 2025 & 2033
- Figure 20: Asia Pacific Industrial Pumps Industry Volume (K Unit), by End-user Industry 2025 & 2033
- Figure 21: Asia Pacific Industrial Pumps Industry Revenue Share (%), by End-user Industry 2025 & 2033
- Figure 22: Asia Pacific Industrial Pumps Industry Volume Share (%), by End-user Industry 2025 & 2033
- Figure 23: Asia Pacific Industrial Pumps Industry Revenue (billion), by Country 2025 & 2033
- Figure 24: Asia Pacific Industrial Pumps Industry Volume (K Unit), by Country 2025 & 2033
- Figure 25: Asia Pacific Industrial Pumps Industry Revenue Share (%), by Country 2025 & 2033
- Figure 26: Asia Pacific Industrial Pumps Industry Volume Share (%), by Country 2025 & 2033
- Figure 27: Europe Industrial Pumps Industry Revenue (billion), by Type 2025 & 2033
- Figure 28: Europe Industrial Pumps Industry Volume (K Unit), by Type 2025 & 2033
- Figure 29: Europe Industrial Pumps Industry Revenue Share (%), by Type 2025 & 2033
- Figure 30: Europe Industrial Pumps Industry Volume Share (%), by Type 2025 & 2033
- Figure 31: Europe Industrial Pumps Industry Revenue (billion), by End-user Industry 2025 & 2033
- Figure 32: Europe Industrial Pumps Industry Volume (K Unit), by End-user Industry 2025 & 2033
- Figure 33: Europe Industrial Pumps Industry Revenue Share (%), by End-user Industry 2025 & 2033
- Figure 34: Europe Industrial Pumps Industry Volume Share (%), by End-user Industry 2025 & 2033
- Figure 35: Europe Industrial Pumps Industry Revenue (billion), by Country 2025 & 2033
- Figure 36: Europe Industrial Pumps Industry Volume (K Unit), by Country 2025 & 2033
- Figure 37: Europe Industrial Pumps Industry Revenue Share (%), by Country 2025 & 2033
- Figure 38: Europe Industrial Pumps Industry Volume Share (%), by Country 2025 & 2033
- Figure 39: South America Industrial Pumps Industry Revenue (billion), by Type 2025 & 2033
- Figure 40: South America Industrial Pumps Industry Volume (K Unit), by Type 2025 & 2033
- Figure 41: South America Industrial Pumps Industry Revenue Share (%), by Type 2025 & 2033
- Figure 42: South America Industrial Pumps Industry Volume Share (%), by Type 2025 & 2033
- Figure 43: South America Industrial Pumps Industry Revenue (billion), by End-user Industry 2025 & 2033
- Figure 44: South America Industrial Pumps Industry Volume (K Unit), by End-user Industry 2025 & 2033
- Figure 45: South America Industrial Pumps Industry Revenue Share (%), by End-user Industry 2025 & 2033
- Figure 46: South America Industrial Pumps Industry Volume Share (%), by End-user Industry 2025 & 2033
- Figure 47: South America Industrial Pumps Industry Revenue (billion), by Country 2025 & 2033
- Figure 48: South America Industrial Pumps Industry Volume (K Unit), by Country 2025 & 2033
- Figure 49: South America Industrial Pumps Industry Revenue Share (%), by Country 2025 & 2033
- Figure 50: South America Industrial Pumps Industry Volume Share (%), by Country 2025 & 2033
- Figure 51: Middle East and Africa Industrial Pumps Industry Revenue (billion), by Type 2025 & 2033
- Figure 52: Middle East and Africa Industrial Pumps Industry Volume (K Unit), by Type 2025 & 2033
- Figure 53: Middle East and Africa Industrial Pumps Industry Revenue Share (%), by Type 2025 & 2033
- Figure 54: Middle East and Africa Industrial Pumps Industry Volume Share (%), by Type 2025 & 2033
- Figure 55: Middle East and Africa Industrial Pumps Industry Revenue (billion), by End-user Industry 2025 & 2033
- Figure 56: Middle East and Africa Industrial Pumps Industry Volume (K Unit), by End-user Industry 2025 & 2033
- Figure 57: Middle East and Africa Industrial Pumps Industry Revenue Share (%), by End-user Industry 2025 & 2033
- Figure 58: Middle East and Africa Industrial Pumps Industry Volume Share (%), by End-user Industry 2025 & 2033
- Figure 59: Middle East and Africa Industrial Pumps Industry Revenue (billion), by Country 2025 & 2033
- Figure 60: Middle East and Africa Industrial Pumps Industry Volume (K Unit), by Country 2025 & 2033
- Figure 61: Middle East and Africa Industrial Pumps Industry Revenue Share (%), by Country 2025 & 2033
- Figure 62: Middle East and Africa Industrial Pumps Industry Volume Share (%), by Country 2025 & 2033
List of Tables
- Table 1: Global Industrial Pumps Industry Revenue billion Forecast, by Type 2020 & 2033
- Table 2: Global Industrial Pumps Industry Volume K Unit Forecast, by Type 2020 & 2033
- Table 3: Global Industrial Pumps Industry Revenue billion Forecast, by End-user Industry 2020 & 2033
- Table 4: Global Industrial Pumps Industry Volume K Unit Forecast, by End-user Industry 2020 & 2033
- Table 5: Global Industrial Pumps Industry Revenue billion Forecast, by Region 2020 & 2033
- Table 6: Global Industrial Pumps Industry Volume K Unit Forecast, by Region 2020 & 2033
- Table 7: Global Industrial Pumps Industry Revenue billion Forecast, by Type 2020 & 2033
- Table 8: Global Industrial Pumps Industry Volume K Unit Forecast, by Type 2020 & 2033
- Table 9: Global Industrial Pumps Industry Revenue billion Forecast, by End-user Industry 2020 & 2033
- Table 10: Global Industrial Pumps Industry Volume K Unit Forecast, by End-user Industry 2020 & 2033
- Table 11: Global Industrial Pumps Industry Revenue billion Forecast, by Country 2020 & 2033
- Table 12: Global Industrial Pumps Industry Volume K Unit Forecast, by Country 2020 & 2033
- Table 13: United States of America Industrial Pumps Industry Revenue (billion) Forecast, by Application 2020 & 2033
- Table 14: United States of America Industrial Pumps Industry Volume (K Unit) Forecast, by Application 2020 & 2033
- Table 15: Canada Industrial Pumps Industry Revenue (billion) Forecast, by Application 2020 & 2033
- Table 16: Canada Industrial Pumps Industry Volume (K Unit) Forecast, by Application 2020 & 2033
- Table 17: Rest of the North America Industrial Pumps Industry Revenue (billion) Forecast, by Application 2020 & 2033
- Table 18: Rest of the North America Industrial Pumps Industry Volume (K Unit) Forecast, by Application 2020 & 2033
- Table 19: Global Industrial Pumps Industry Revenue billion Forecast, by Type 2020 & 2033
- Table 20: Global Industrial Pumps Industry Volume K Unit Forecast, by Type 2020 & 2033
- Table 21: Global Industrial Pumps Industry Revenue billion Forecast, by End-user Industry 2020 & 2033
- Table 22: Global Industrial Pumps Industry Volume K Unit Forecast, by End-user Industry 2020 & 2033
- Table 23: Global Industrial Pumps Industry Revenue billion Forecast, by Country 2020 & 2033
- Table 24: Global Industrial Pumps Industry Volume K Unit Forecast, by Country 2020 & 2033
- Table 25: India Industrial Pumps Industry Revenue (billion) Forecast, by Application 2020 & 2033
- Table 26: India Industrial Pumps Industry Volume (K Unit) Forecast, by Application 2020 & 2033
- Table 27: China Industrial Pumps Industry Revenue (billion) Forecast, by Application 2020 & 2033
- Table 28: China Industrial Pumps Industry Volume (K Unit) Forecast, by Application 2020 & 2033
- Table 29: South Korea Industrial Pumps Industry Revenue (billion) Forecast, by Application 2020 & 2033
- Table 30: South Korea Industrial Pumps Industry Volume (K Unit) Forecast, by Application 2020 & 2033
- Table 31: Rest of the Asia Pacific Industrial Pumps Industry Revenue (billion) Forecast, by Application 2020 & 2033
- Table 32: Rest of the Asia Pacific Industrial Pumps Industry Volume (K Unit) Forecast, by Application 2020 & 2033
- Table 33: Global Industrial Pumps Industry Revenue billion Forecast, by Type 2020 & 2033
- Table 34: Global Industrial Pumps Industry Volume K Unit Forecast, by Type 2020 & 2033
- Table 35: Global Industrial Pumps Industry Revenue billion Forecast, by End-user Industry 2020 & 2033
- Table 36: Global Industrial Pumps Industry Volume K Unit Forecast, by End-user Industry 2020 & 2033
- Table 37: Global Industrial Pumps Industry Revenue billion Forecast, by Country 2020 & 2033
- Table 38: Global Industrial Pumps Industry Volume K Unit Forecast, by Country 2020 & 2033
- Table 39: Germany Industrial Pumps Industry Revenue (billion) Forecast, by Application 2020 & 2033
- Table 40: Germany Industrial Pumps Industry Volume (K Unit) Forecast, by Application 2020 & 2033
- Table 41: United Kingdom Industrial Pumps Industry Revenue (billion) Forecast, by Application 2020 & 2033
- Table 42: United Kingdom Industrial Pumps Industry Volume (K Unit) Forecast, by Application 2020 & 2033
- Table 43: France Industrial Pumps Industry Revenue (billion) Forecast, by Application 2020 & 2033
- Table 44: France Industrial Pumps Industry Volume (K Unit) Forecast, by Application 2020 & 2033
- Table 45: Italy Industrial Pumps Industry Revenue (billion) Forecast, by Application 2020 & 2033
- Table 46: Italy Industrial Pumps Industry Volume (K Unit) Forecast, by Application 2020 & 2033
- Table 47: Rest of the Europe Industrial Pumps Industry Revenue (billion) Forecast, by Application 2020 & 2033
- Table 48: Rest of the Europe Industrial Pumps Industry Volume (K Unit) Forecast, by Application 2020 & 2033
- Table 49: Global Industrial Pumps Industry Revenue billion Forecast, by Type 2020 & 2033
- Table 50: Global Industrial Pumps Industry Volume K Unit Forecast, by Type 2020 & 2033
- Table 51: Global Industrial Pumps Industry Revenue billion Forecast, by End-user Industry 2020 & 2033
- Table 52: Global Industrial Pumps Industry Volume K Unit Forecast, by End-user Industry 2020 & 2033
- Table 53: Global Industrial Pumps Industry Revenue billion Forecast, by Country 2020 & 2033
- Table 54: Global Industrial Pumps Industry Volume K Unit Forecast, by Country 2020 & 2033
- Table 55: Brazil Industrial Pumps Industry Revenue (billion) Forecast, by Application 2020 & 2033
- Table 56: Brazil Industrial Pumps Industry Volume (K Unit) Forecast, by Application 2020 & 2033
- Table 57: Argentina Industrial Pumps Industry Revenue (billion) Forecast, by Application 2020 & 2033
- Table 58: Argentina Industrial Pumps Industry Volume (K Unit) Forecast, by Application 2020 & 2033
- Table 59: Rest of the South America Industrial Pumps Industry Revenue (billion) Forecast, by Application 2020 & 2033
- Table 60: Rest of the South America Industrial Pumps Industry Volume (K Unit) Forecast, by Application 2020 & 2033
- Table 61: Global Industrial Pumps Industry Revenue billion Forecast, by Type 2020 & 2033
- Table 62: Global Industrial Pumps Industry Volume K Unit Forecast, by Type 2020 & 2033
- Table 63: Global Industrial Pumps Industry Revenue billion Forecast, by End-user Industry 2020 & 2033
- Table 64: Global Industrial Pumps Industry Volume K Unit Forecast, by End-user Industry 2020 & 2033
- Table 65: Global Industrial Pumps Industry Revenue billion Forecast, by Country 2020 & 2033
- Table 66: Global Industrial Pumps Industry Volume K Unit Forecast, by Country 2020 & 2033
- Table 67: United Arab Emirates Industrial Pumps Industry Revenue (billion) Forecast, by Application 2020 & 2033
- Table 68: United Arab Emirates Industrial Pumps Industry Volume (K Unit) Forecast, by Application 2020 & 2033
- Table 69: Saudi Arabia Industrial Pumps Industry Revenue (billion) Forecast, by Application 2020 & 2033
- Table 70: Saudi Arabia Industrial Pumps Industry Volume (K Unit) Forecast, by Application 2020 & 2033
- Table 71: Iraq Industrial Pumps Industry Revenue (billion) Forecast, by Application 2020 & 2033
- Table 72: Iraq Industrial Pumps Industry Volume (K Unit) Forecast, by Application 2020 & 2033
- Table 73: Rest of the Middle East and Africa Industrial Pumps Industry Revenue (billion) Forecast, by Application 2020 & 2033
- Table 74: Rest of the Middle East and Africa Industrial Pumps Industry Volume (K Unit) Forecast, by Application 2020 & 2033
Frequently Asked Questions
1. What is the projected Compound Annual Growth Rate (CAGR) of the Industrial Pumps Industry?
The projected CAGR is approximately 4.75%.
2. Which companies are prominent players in the Industrial Pumps Industry?
Key companies in the market include Danfoss AS, Sulzer Ltd, Ruhrpumpen Group (A Corporacion EG Company)*List Not Exhaustive, Flowserve Corporation, Weir Group PLC, Xylem Inc, SPP Pumps Inc, Clyde Union Inc, Schlumberger Ltd, Ebara Corp, ITT Inc, Grundfos Holding AS, Dover Corporation, SPX Flow Inc, Baker Hughes Company, Wilo Mather & Platt Pumps Pvt Ltd, KSB AG, General Electric Company.
3. What are the main segments of the Industrial Pumps Industry?
The market segments include Type, End-user Industry.
4. Can you provide details about the market size?
The market size is estimated to be USD 48.2 billion as of 2022.
5. What are some drivers contributing to market growth?
Increasing Petrochemical Industries In Middle East & African Region4.; Increasing Industrialization Across the World.
6. What are the notable trends driving market growth?
Centrifugal Pumps to Have a Significant Demand.
7. Are there any restraints impacting market growth?
Stringent Government Regulations and Policies to Reduce Carbon Emissions.
8. Can you provide examples of recent developments in the market?
February 2023: EBARA Corporation successfully developed one of the world's first liquid hydrogen booster pumps for hydrogen power generation, consistent with the global expansion of the hydrogen market.
9. What pricing options are available for accessing the report?
Pricing options include single-user, multi-user, and enterprise licenses priced at USD 4750, USD 5250, and USD 8750 respectively.
10. Is the market size provided in terms of value or volume?
The market size is provided in terms of value, measured in billion and volume, measured in K Unit.
11. Are there any specific market keywords associated with the report?
Yes, the market keyword associated with the report is "Industrial Pumps Industry," which aids in identifying and referencing the specific market segment covered.
12. How do I determine which pricing option suits my needs best?
The pricing options vary based on user requirements and access needs. Individual users may opt for single-user licenses, while businesses requiring broader access may choose multi-user or enterprise licenses for cost-effective access to the report.
13. Are there any additional resources or data provided in the Industrial Pumps Industry report?
While the report offers comprehensive insights, it's advisable to review the specific contents or supplementary materials provided to ascertain if additional resources or data are available.
14. How can I stay updated on further developments or reports in the Industrial Pumps Industry?
To stay informed about further developments, trends, and reports in the Industrial Pumps Industry, consider subscribing to industry newsletters, following relevant companies and organizations, or regularly checking reputable industry news sources and publications.
Methodology
Step 1 - Identification of Relevant Samples Size from Population Database


Step 2 - Approaches for Defining Global Market Size (Value, Volume* & Price*)

Note*: In applicable scenarios
Step 3 - Data Sources
Primary Research
- Web Analytics
- Survey Reports
- Research Institute
- Latest Research Reports
- Opinion Leaders
Secondary Research
- Annual Reports
- White Paper
- Latest Press Release
- Industry Association
- Paid Database
- Investor Presentations

Step 4 - Data Triangulation
Involves using different sources of information in order to increase the validity of a study
These sources are likely to be stakeholders in a program - participants, other researchers, program staff, other community members, and so on.
Then we put all data in single framework & apply various statistical tools to find out the dynamic on the market.
During the analysis stage, feedback from the stakeholder groups would be compared to determine areas of agreement as well as areas of divergence