
Key Insights
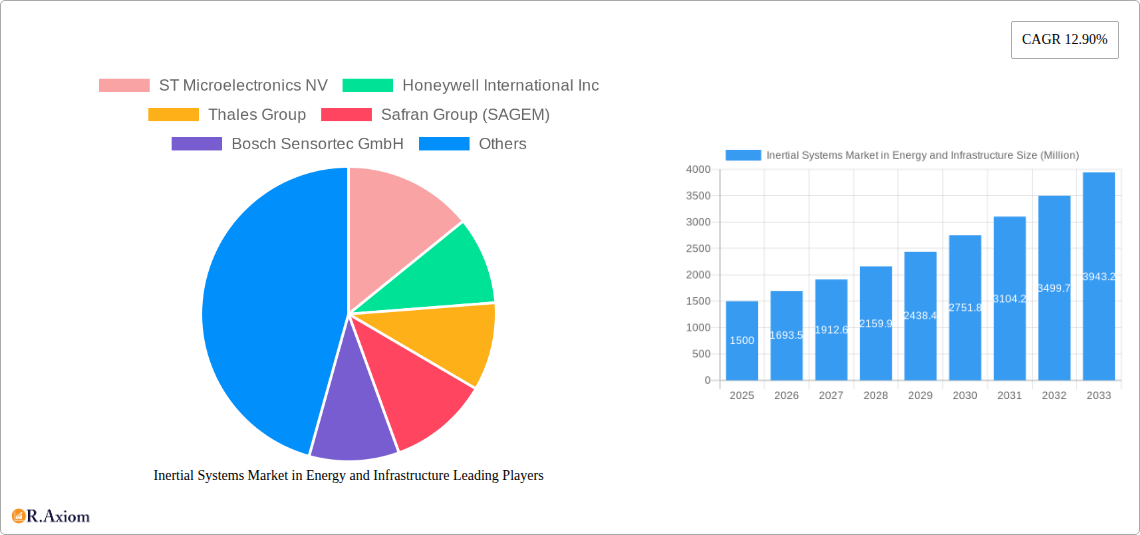
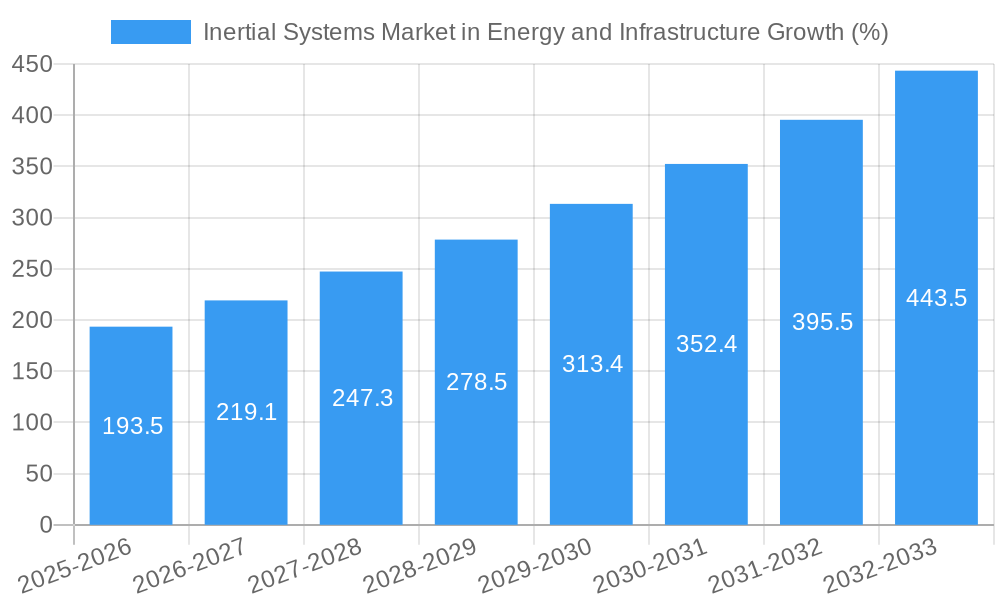
The Inertial Systems market within the energy and infrastructure sectors is experiencing robust growth, projected to reach a substantial size by 2033. A Compound Annual Growth Rate (CAGR) of 12.90% from 2025-2033 indicates significant market expansion driven by several key factors. The increasing adoption of automation and robotics in energy exploration, renewable energy deployment, and smart infrastructure development fuels demand for precise positioning and motion sensing capabilities provided by inertial systems. Furthermore, the rising need for enhanced safety and operational efficiency in these sectors is compelling the integration of advanced inertial measurement units (IMUs) and attitude and heading reference systems (AHRS) into various applications, from oil and gas drilling platforms to power grids and smart building systems. Standalone accelerometers and gyroscopes remain important components, but the market is witnessing a shift towards integrated solutions offering superior performance and reduced size. Geographically, North America and Europe currently hold significant market shares due to early adoption of advanced technologies and robust infrastructure. However, rapid industrialization and infrastructure development in the Asia-Pacific region are expected to drive substantial growth in the coming years.
The competitive landscape is characterized by a mix of established players like STMicroelectronics, Honeywell, and Thales, alongside specialized sensor manufacturers. These companies are continuously investing in research and development to improve the accuracy, reliability, and cost-effectiveness of their inertial systems. Future market growth will be influenced by the ongoing advancements in sensor technology, miniaturization, and improved data processing capabilities. The rising demand for high-precision inertial navigation systems in autonomous vehicles and drones within these sectors will further bolster market expansion. While potential restraints include high initial investment costs for advanced systems and the need for skilled workforce for implementation, the long-term benefits in terms of safety, efficiency, and cost savings are expected to outweigh these challenges, ensuring continued growth of the inertial systems market in energy and infrastructure.
Inertial Systems Market in Energy and Infrastructure: A Comprehensive Report (2019-2033)
This comprehensive report provides an in-depth analysis of the Inertial Systems market within the Energy and Infrastructure sectors, offering invaluable insights for stakeholders seeking to navigate this dynamic landscape. Covering the period from 2019 to 2033, with a focus on 2025, this report meticulously examines market trends, competitive dynamics, and future growth potential. The study encompasses detailed segmentation by component (standalone and integrated systems), industry (energy and infrastructure), and region (North America, Europe, and Asia-Pacific).
Inertial Systems Market in Energy and Infrastructure Market Concentration & Innovation
This section analyzes the level of market concentration, identifying key players and their respective market shares. We assess the role of innovation, including new product developments and technological advancements, in shaping market dynamics. Regulatory frameworks impacting the industry are examined, along with the influence of substitute products and evolving end-user trends. The analysis includes a review of significant mergers and acquisitions (M&A) activities, quantifying deal values where possible to understand their impact on market consolidation.
- Market Concentration: The market is moderately concentrated, with the top five players holding approximately xx% of the market share in 2025. This concentration is expected to xx slightly by 2033.
- Innovation Drivers: Miniaturization, enhanced accuracy, and lower power consumption are key drivers. The development of advanced algorithms and sensor fusion techniques is also significant.
- Regulatory Frameworks: Compliance with safety and environmental standards significantly influences product design and market access. Specific regulations vary by region.
- Product Substitutes: GPS and other navigation systems offer some level of substitution, but inertial systems remain crucial for specific applications requiring high accuracy and reliability.
- M&A Activities: Significant M&A activity was observed between 2019 and 2024, with total deal values estimated at approximately xx Million. These activities have impacted market consolidation and competitive landscapes. Further consolidation is anticipated in the forecast period.
Inertial Systems Market in Energy and Infrastructure Industry Trends & Insights
This section delves into the key trends shaping the Inertial Systems market in the energy and infrastructure sectors. We examine market growth drivers, technological disruptions, evolving consumer preferences, and the competitive landscape. Specific metrics like compound annual growth rate (CAGR) and market penetration are provided to quantify these trends. The analysis considers factors such as increasing demand for automation, improved infrastructure monitoring, and the rising adoption of renewable energy sources. The market is expected to experience a CAGR of xx% during the forecast period (2025-2033). Market penetration within the infrastructure sector is projected to increase from xx% in 2025 to xx% by 2033.
Dominant Markets & Segments in Inertial Systems Market in Energy and Infrastructure
This section identifies the leading regions, countries, and segments within the Inertial Systems market. A detailed dominance analysis is provided, focusing on key drivers of growth within each segment.
Leading Region: Asia-Pacific is projected to be the dominant region, driven by significant infrastructure development and investment in renewable energy projects.
Leading Component Segment: Integrated systems (IMUs and AHRS) are expected to dominate the market due to their enhanced functionality and higher value proposition.
Leading Industry Segment: The infrastructure segment is poised for significant growth, driven by increasing demand for precise positioning and monitoring in various applications.
Key Drivers for Asia-Pacific Dominance:
- Rapid urbanization and infrastructure development.
- Growing investments in renewable energy projects.
- Favorable government policies and incentives.
Key Drivers for Integrated Systems Dominance:
- Superior performance and accuracy compared to standalone components.
- Integration of multiple sensors for enhanced functionality.
- Growing demand for advanced navigation and control systems.
Key Drivers for Infrastructure Segment Dominance:
- Increasing need for precise asset monitoring and management.
- Growing adoption of smart city initiatives.
- Development of sophisticated infrastructure monitoring systems.
Inertial Systems Market in Energy and Infrastructure Product Developments
Recent product innovations have focused on miniaturization, improved accuracy, and reduced power consumption. New applications are emerging in areas such as drone navigation, robotics, and precision agriculture. The market is witnessing increased competition, with companies focusing on differentiation through enhanced features and improved performance. Technological advancements, such as the use of MEMS technology and advanced sensor fusion algorithms, are driving market growth.
Report Scope & Segmentation Analysis
This report segments the Inertial Systems market by component (Standalone: Accelerometers, Gyroscopes; Integrated: IMUs, AHRS), industry (Energy, Infrastructure), and region (North America, Europe, Asia-Pacific). Each segment's growth projections, market sizes, and competitive dynamics are analyzed. The report provides a detailed overview of each segment's current market size and future growth potential. The competitive dynamics within each segment are also discussed, highlighting key players and their market strategies.
Key Drivers of Inertial Systems Market in Energy and Infrastructure Growth
Several factors drive market growth, including increasing demand for precise positioning and navigation systems in various applications, the rising adoption of automation in energy and infrastructure sectors, and technological advancements leading to smaller, more efficient, and accurate inertial systems. Government regulations mandating improved safety and monitoring are also contributing factors. The growth of renewable energy projects, particularly offshore wind farms, significantly increases demand for precise positioning and monitoring systems.
Challenges in the Inertial Systems Market in Energy and Infrastructure Sector
The market faces challenges including the high cost of advanced inertial systems, potential supply chain disruptions affecting the availability of key components, and intense competition from established players. Strict regulatory compliance requirements can also increase development costs and time to market. The dependence on specific raw materials and their price volatility also pose significant challenges.
Emerging Opportunities in Inertial Systems Market in Energy and Infrastructure
Emerging opportunities exist in the growing adoption of autonomous vehicles, drones, and robotics. New applications in smart grids and precision agriculture are also creating significant growth potential. Further advancements in sensor fusion technologies and the development of highly integrated systems will create new opportunities for market expansion.
Leading Players in the Inertial Systems Market in Energy and Infrastructure Market
- STMicroelectronics NV
- Honeywell International Inc
- Thales Group
- Safran Group (SAGEM)
- Bosch Sensortec GmbH
- Vector NAV Technologies
- Invensense Inc
- Silicon Sensing Systems Ltd
- Analog Devices Inc
- Northrop Grumman Corporation
Key Developments in Inertial Systems Market in Energy and Infrastructure Industry
- January 2023: STMicroelectronics announced a new generation of IMUs with enhanced performance.
- June 2022: Honeywell launched a new AHRS system for the offshore wind energy sector.
- October 2021: Bosch Sensortec acquired a smaller sensor company, expanding its product portfolio. (Further details regarding the acquired company are not available.)
- (Add more developments with dates as they become available)
Strategic Outlook for Inertial Systems Market in Energy and Infrastructure Market
The Inertial Systems market in the energy and infrastructure sectors is poised for significant growth, driven by technological advancements, increasing demand for automation, and the expansion of renewable energy projects. Companies focusing on innovation, strategic partnerships, and global expansion will be best positioned to capture market share and drive future growth. Further technological developments in areas such as AI-powered sensor fusion and improved power efficiency will shape the future of the market.
Inertial Systems Market in Energy and Infrastructure Segmentation
-
1. Component
- 1.1. Standalone (Accelerometers Gyroscope)
- 1.2. Integrat
Inertial Systems Market in Energy and Infrastructure Segmentation By Geography
- 1. North America
- 2. Europe
- 3. Asia Pacific
- 4. Latin America
- 5. Middle East and Africa

Inertial Systems Market in Energy and Infrastructure REPORT HIGHLIGHTS
| Aspects | Details |
|---|---|
| Study Period | 2019-2033 |
| Base Year | 2024 |
| Estimated Year | 2025 |
| Forecast Period | 2025-2033 |
| Historical Period | 2019-2024 |
| Growth Rate | CAGR of 12.90% from 2019-2033 |
| Segmentation |
|
Table of Contents
- 1. Introduction
- 1.1. Research Scope
- 1.2. Market Segmentation
- 1.3. Research Methodology
- 1.4. Definitions and Assumptions
- 2. Executive Summary
- 2.1. Introduction
- 3. Market Dynamics
- 3.1. Introduction
- 3.2. Market Drivers
- 3.2.1. ; Emergence of MEMS Technology; Increasing Applications Based on Motion Sensing
- 3.3. Market Restrains
- 3.3.1. ; Integration Drift Error
- 3.4. Market Trends
- 3.4.1. MEMs to Hold Significant Market Growth in the Oil and Gas Sector
- 4. Market Factor Analysis
- 4.1. Porters Five Forces
- 4.2. Supply/Value Chain
- 4.3. PESTEL analysis
- 4.4. Market Entropy
- 4.5. Patent/Trademark Analysis
- 5. Global Inertial Systems Market in Energy and Infrastructure Analysis, Insights and Forecast, 2019-2031
- 5.1. Market Analysis, Insights and Forecast - by Component
- 5.1.1. Standalone (Accelerometers Gyroscope)
- 5.1.2. Integrat
- 5.2. Market Analysis, Insights and Forecast - by Region
- 5.2.1. North America
- 5.2.2. Europe
- 5.2.3. Asia Pacific
- 5.2.4. Latin America
- 5.2.5. Middle East and Africa
- 5.1. Market Analysis, Insights and Forecast - by Component
- 6. North America Inertial Systems Market in Energy and Infrastructure Analysis, Insights and Forecast, 2019-2031
- 6.1. Market Analysis, Insights and Forecast - by Component
- 6.1.1. Standalone (Accelerometers Gyroscope)
- 6.1.2. Integrat
- 6.1. Market Analysis, Insights and Forecast - by Component
- 7. Europe Inertial Systems Market in Energy and Infrastructure Analysis, Insights and Forecast, 2019-2031
- 7.1. Market Analysis, Insights and Forecast - by Component
- 7.1.1. Standalone (Accelerometers Gyroscope)
- 7.1.2. Integrat
- 7.1. Market Analysis, Insights and Forecast - by Component
- 8. Asia Pacific Inertial Systems Market in Energy and Infrastructure Analysis, Insights and Forecast, 2019-2031
- 8.1. Market Analysis, Insights and Forecast - by Component
- 8.1.1. Standalone (Accelerometers Gyroscope)
- 8.1.2. Integrat
- 8.1. Market Analysis, Insights and Forecast - by Component
- 9. Latin America Inertial Systems Market in Energy and Infrastructure Analysis, Insights and Forecast, 2019-2031
- 9.1. Market Analysis, Insights and Forecast - by Component
- 9.1.1. Standalone (Accelerometers Gyroscope)
- 9.1.2. Integrat
- 9.1. Market Analysis, Insights and Forecast - by Component
- 10. Middle East and Africa Inertial Systems Market in Energy and Infrastructure Analysis, Insights and Forecast, 2019-2031
- 10.1. Market Analysis, Insights and Forecast - by Component
- 10.1.1. Standalone (Accelerometers Gyroscope)
- 10.1.2. Integrat
- 10.1. Market Analysis, Insights and Forecast - by Component
- 11. North America Inertial Systems Market in Energy and Infrastructure Analysis, Insights and Forecast, 2019-2031
- 11.1. Market Analysis, Insights and Forecast - By Country/Sub-region
- 11.1.1 United States
- 11.1.2 Canada
- 11.1.3 Mexico
- 12. Europe Inertial Systems Market in Energy and Infrastructure Analysis, Insights and Forecast, 2019-2031
- 12.1. Market Analysis, Insights and Forecast - By Country/Sub-region
- 12.1.1 Germany
- 12.1.2 United Kingdom
- 12.1.3 France
- 12.1.4 Spain
- 12.1.5 Italy
- 12.1.6 Spain
- 12.1.7 Belgium
- 12.1.8 Netherland
- 12.1.9 Nordics
- 12.1.10 Rest of Europe
- 13. Asia Pacific Inertial Systems Market in Energy and Infrastructure Analysis, Insights and Forecast, 2019-2031
- 13.1. Market Analysis, Insights and Forecast - By Country/Sub-region
- 13.1.1 China
- 13.1.2 Japan
- 13.1.3 India
- 13.1.4 South Korea
- 13.1.5 Southeast Asia
- 13.1.6 Australia
- 13.1.7 Indonesia
- 13.1.8 Phillipes
- 13.1.9 Singapore
- 13.1.10 Thailandc
- 13.1.11 Rest of Asia Pacific
- 14. South America Inertial Systems Market in Energy and Infrastructure Analysis, Insights and Forecast, 2019-2031
- 14.1. Market Analysis, Insights and Forecast - By Country/Sub-region
- 14.1.1 Brazil
- 14.1.2 Argentina
- 14.1.3 Peru
- 14.1.4 Chile
- 14.1.5 Colombia
- 14.1.6 Ecuador
- 14.1.7 Venezuela
- 14.1.8 Rest of South America
- 15. MEA Inertial Systems Market in Energy and Infrastructure Analysis, Insights and Forecast, 2019-2031
- 15.1. Market Analysis, Insights and Forecast - By Country/Sub-region
- 15.1.1 United Arab Emirates
- 15.1.2 Saudi Arabia
- 15.1.3 South Africa
- 15.1.4 Rest of Middle East and Africa
- 16. Competitive Analysis
- 16.1. Global Market Share Analysis 2024
- 16.2. Company Profiles
- 16.2.1 ST Microelectronics NV
- 16.2.1.1. Overview
- 16.2.1.2. Products
- 16.2.1.3. SWOT Analysis
- 16.2.1.4. Recent Developments
- 16.2.1.5. Financials (Based on Availability)
- 16.2.2 Honeywell International Inc
- 16.2.2.1. Overview
- 16.2.2.2. Products
- 16.2.2.3. SWOT Analysis
- 16.2.2.4. Recent Developments
- 16.2.2.5. Financials (Based on Availability)
- 16.2.3 Thales Group
- 16.2.3.1. Overview
- 16.2.3.2. Products
- 16.2.3.3. SWOT Analysis
- 16.2.3.4. Recent Developments
- 16.2.3.5. Financials (Based on Availability)
- 16.2.4 Safran Group (SAGEM)
- 16.2.4.1. Overview
- 16.2.4.2. Products
- 16.2.4.3. SWOT Analysis
- 16.2.4.4. Recent Developments
- 16.2.4.5. Financials (Based on Availability)
- 16.2.5 Bosch Sensortec GmbH
- 16.2.5.1. Overview
- 16.2.5.2. Products
- 16.2.5.3. SWOT Analysis
- 16.2.5.4. Recent Developments
- 16.2.5.5. Financials (Based on Availability)
- 16.2.6 Vector NAV Technologies
- 16.2.6.1. Overview
- 16.2.6.2. Products
- 16.2.6.3. SWOT Analysis
- 16.2.6.4. Recent Developments
- 16.2.6.5. Financials (Based on Availability)
- 16.2.7 Invensense Inc
- 16.2.7.1. Overview
- 16.2.7.2. Products
- 16.2.7.3. SWOT Analysis
- 16.2.7.4. Recent Developments
- 16.2.7.5. Financials (Based on Availability)
- 16.2.8 Silicon Sensing Systems Ltd
- 16.2.8.1. Overview
- 16.2.8.2. Products
- 16.2.8.3. SWOT Analysis
- 16.2.8.4. Recent Developments
- 16.2.8.5. Financials (Based on Availability)
- 16.2.9 Analog Devices Inc
- 16.2.9.1. Overview
- 16.2.9.2. Products
- 16.2.9.3. SWOT Analysis
- 16.2.9.4. Recent Developments
- 16.2.9.5. Financials (Based on Availability)
- 16.2.10 Northrop Grumman Corporation
- 16.2.10.1. Overview
- 16.2.10.2. Products
- 16.2.10.3. SWOT Analysis
- 16.2.10.4. Recent Developments
- 16.2.10.5. Financials (Based on Availability)
- 16.2.1 ST Microelectronics NV
List of Figures
- Figure 1: Global Inertial Systems Market in Energy and Infrastructure Revenue Breakdown (Million, %) by Region 2024 & 2032
- Figure 2: North America Inertial Systems Market in Energy and Infrastructure Revenue (Million), by Country 2024 & 2032
- Figure 3: North America Inertial Systems Market in Energy and Infrastructure Revenue Share (%), by Country 2024 & 2032
- Figure 4: Europe Inertial Systems Market in Energy and Infrastructure Revenue (Million), by Country 2024 & 2032
- Figure 5: Europe Inertial Systems Market in Energy and Infrastructure Revenue Share (%), by Country 2024 & 2032
- Figure 6: Asia Pacific Inertial Systems Market in Energy and Infrastructure Revenue (Million), by Country 2024 & 2032
- Figure 7: Asia Pacific Inertial Systems Market in Energy and Infrastructure Revenue Share (%), by Country 2024 & 2032
- Figure 8: South America Inertial Systems Market in Energy and Infrastructure Revenue (Million), by Country 2024 & 2032
- Figure 9: South America Inertial Systems Market in Energy and Infrastructure Revenue Share (%), by Country 2024 & 2032
- Figure 10: MEA Inertial Systems Market in Energy and Infrastructure Revenue (Million), by Country 2024 & 2032
- Figure 11: MEA Inertial Systems Market in Energy and Infrastructure Revenue Share (%), by Country 2024 & 2032
- Figure 12: North America Inertial Systems Market in Energy and Infrastructure Revenue (Million), by Component 2024 & 2032
- Figure 13: North America Inertial Systems Market in Energy and Infrastructure Revenue Share (%), by Component 2024 & 2032
- Figure 14: North America Inertial Systems Market in Energy and Infrastructure Revenue (Million), by Country 2024 & 2032
- Figure 15: North America Inertial Systems Market in Energy and Infrastructure Revenue Share (%), by Country 2024 & 2032
- Figure 16: Europe Inertial Systems Market in Energy and Infrastructure Revenue (Million), by Component 2024 & 2032
- Figure 17: Europe Inertial Systems Market in Energy and Infrastructure Revenue Share (%), by Component 2024 & 2032
- Figure 18: Europe Inertial Systems Market in Energy and Infrastructure Revenue (Million), by Country 2024 & 2032
- Figure 19: Europe Inertial Systems Market in Energy and Infrastructure Revenue Share (%), by Country 2024 & 2032
- Figure 20: Asia Pacific Inertial Systems Market in Energy and Infrastructure Revenue (Million), by Component 2024 & 2032
- Figure 21: Asia Pacific Inertial Systems Market in Energy and Infrastructure Revenue Share (%), by Component 2024 & 2032
- Figure 22: Asia Pacific Inertial Systems Market in Energy and Infrastructure Revenue (Million), by Country 2024 & 2032
- Figure 23: Asia Pacific Inertial Systems Market in Energy and Infrastructure Revenue Share (%), by Country 2024 & 2032
- Figure 24: Latin America Inertial Systems Market in Energy and Infrastructure Revenue (Million), by Component 2024 & 2032
- Figure 25: Latin America Inertial Systems Market in Energy and Infrastructure Revenue Share (%), by Component 2024 & 2032
- Figure 26: Latin America Inertial Systems Market in Energy and Infrastructure Revenue (Million), by Country 2024 & 2032
- Figure 27: Latin America Inertial Systems Market in Energy and Infrastructure Revenue Share (%), by Country 2024 & 2032
- Figure 28: Middle East and Africa Inertial Systems Market in Energy and Infrastructure Revenue (Million), by Component 2024 & 2032
- Figure 29: Middle East and Africa Inertial Systems Market in Energy and Infrastructure Revenue Share (%), by Component 2024 & 2032
- Figure 30: Middle East and Africa Inertial Systems Market in Energy and Infrastructure Revenue (Million), by Country 2024 & 2032
- Figure 31: Middle East and Africa Inertial Systems Market in Energy and Infrastructure Revenue Share (%), by Country 2024 & 2032
List of Tables
- Table 1: Global Inertial Systems Market in Energy and Infrastructure Revenue Million Forecast, by Region 2019 & 2032
- Table 2: Global Inertial Systems Market in Energy and Infrastructure Revenue Million Forecast, by Component 2019 & 2032
- Table 3: Global Inertial Systems Market in Energy and Infrastructure Revenue Million Forecast, by Region 2019 & 2032
- Table 4: Global Inertial Systems Market in Energy and Infrastructure Revenue Million Forecast, by Country 2019 & 2032
- Table 5: United States Inertial Systems Market in Energy and Infrastructure Revenue (Million) Forecast, by Application 2019 & 2032
- Table 6: Canada Inertial Systems Market in Energy and Infrastructure Revenue (Million) Forecast, by Application 2019 & 2032
- Table 7: Mexico Inertial Systems Market in Energy and Infrastructure Revenue (Million) Forecast, by Application 2019 & 2032
- Table 8: Global Inertial Systems Market in Energy and Infrastructure Revenue Million Forecast, by Country 2019 & 2032
- Table 9: Germany Inertial Systems Market in Energy and Infrastructure Revenue (Million) Forecast, by Application 2019 & 2032
- Table 10: United Kingdom Inertial Systems Market in Energy and Infrastructure Revenue (Million) Forecast, by Application 2019 & 2032
- Table 11: France Inertial Systems Market in Energy and Infrastructure Revenue (Million) Forecast, by Application 2019 & 2032
- Table 12: Spain Inertial Systems Market in Energy and Infrastructure Revenue (Million) Forecast, by Application 2019 & 2032
- Table 13: Italy Inertial Systems Market in Energy and Infrastructure Revenue (Million) Forecast, by Application 2019 & 2032
- Table 14: Spain Inertial Systems Market in Energy and Infrastructure Revenue (Million) Forecast, by Application 2019 & 2032
- Table 15: Belgium Inertial Systems Market in Energy and Infrastructure Revenue (Million) Forecast, by Application 2019 & 2032
- Table 16: Netherland Inertial Systems Market in Energy and Infrastructure Revenue (Million) Forecast, by Application 2019 & 2032
- Table 17: Nordics Inertial Systems Market in Energy and Infrastructure Revenue (Million) Forecast, by Application 2019 & 2032
- Table 18: Rest of Europe Inertial Systems Market in Energy and Infrastructure Revenue (Million) Forecast, by Application 2019 & 2032
- Table 19: Global Inertial Systems Market in Energy and Infrastructure Revenue Million Forecast, by Country 2019 & 2032
- Table 20: China Inertial Systems Market in Energy and Infrastructure Revenue (Million) Forecast, by Application 2019 & 2032
- Table 21: Japan Inertial Systems Market in Energy and Infrastructure Revenue (Million) Forecast, by Application 2019 & 2032
- Table 22: India Inertial Systems Market in Energy and Infrastructure Revenue (Million) Forecast, by Application 2019 & 2032
- Table 23: South Korea Inertial Systems Market in Energy and Infrastructure Revenue (Million) Forecast, by Application 2019 & 2032
- Table 24: Southeast Asia Inertial Systems Market in Energy and Infrastructure Revenue (Million) Forecast, by Application 2019 & 2032
- Table 25: Australia Inertial Systems Market in Energy and Infrastructure Revenue (Million) Forecast, by Application 2019 & 2032
- Table 26: Indonesia Inertial Systems Market in Energy and Infrastructure Revenue (Million) Forecast, by Application 2019 & 2032
- Table 27: Phillipes Inertial Systems Market in Energy and Infrastructure Revenue (Million) Forecast, by Application 2019 & 2032
- Table 28: Singapore Inertial Systems Market in Energy and Infrastructure Revenue (Million) Forecast, by Application 2019 & 2032
- Table 29: Thailandc Inertial Systems Market in Energy and Infrastructure Revenue (Million) Forecast, by Application 2019 & 2032
- Table 30: Rest of Asia Pacific Inertial Systems Market in Energy and Infrastructure Revenue (Million) Forecast, by Application 2019 & 2032
- Table 31: Global Inertial Systems Market in Energy and Infrastructure Revenue Million Forecast, by Country 2019 & 2032
- Table 32: Brazil Inertial Systems Market in Energy and Infrastructure Revenue (Million) Forecast, by Application 2019 & 2032
- Table 33: Argentina Inertial Systems Market in Energy and Infrastructure Revenue (Million) Forecast, by Application 2019 & 2032
- Table 34: Peru Inertial Systems Market in Energy and Infrastructure Revenue (Million) Forecast, by Application 2019 & 2032
- Table 35: Chile Inertial Systems Market in Energy and Infrastructure Revenue (Million) Forecast, by Application 2019 & 2032
- Table 36: Colombia Inertial Systems Market in Energy and Infrastructure Revenue (Million) Forecast, by Application 2019 & 2032
- Table 37: Ecuador Inertial Systems Market in Energy and Infrastructure Revenue (Million) Forecast, by Application 2019 & 2032
- Table 38: Venezuela Inertial Systems Market in Energy and Infrastructure Revenue (Million) Forecast, by Application 2019 & 2032
- Table 39: Rest of South America Inertial Systems Market in Energy and Infrastructure Revenue (Million) Forecast, by Application 2019 & 2032
- Table 40: Global Inertial Systems Market in Energy and Infrastructure Revenue Million Forecast, by Country 2019 & 2032
- Table 41: United Arab Emirates Inertial Systems Market in Energy and Infrastructure Revenue (Million) Forecast, by Application 2019 & 2032
- Table 42: Saudi Arabia Inertial Systems Market in Energy and Infrastructure Revenue (Million) Forecast, by Application 2019 & 2032
- Table 43: South Africa Inertial Systems Market in Energy and Infrastructure Revenue (Million) Forecast, by Application 2019 & 2032
- Table 44: Rest of Middle East and Africa Inertial Systems Market in Energy and Infrastructure Revenue (Million) Forecast, by Application 2019 & 2032
- Table 45: Global Inertial Systems Market in Energy and Infrastructure Revenue Million Forecast, by Component 2019 & 2032
- Table 46: Global Inertial Systems Market in Energy and Infrastructure Revenue Million Forecast, by Country 2019 & 2032
- Table 47: Global Inertial Systems Market in Energy and Infrastructure Revenue Million Forecast, by Component 2019 & 2032
- Table 48: Global Inertial Systems Market in Energy and Infrastructure Revenue Million Forecast, by Country 2019 & 2032
- Table 49: Global Inertial Systems Market in Energy and Infrastructure Revenue Million Forecast, by Component 2019 & 2032
- Table 50: Global Inertial Systems Market in Energy and Infrastructure Revenue Million Forecast, by Country 2019 & 2032
- Table 51: Global Inertial Systems Market in Energy and Infrastructure Revenue Million Forecast, by Component 2019 & 2032
- Table 52: Global Inertial Systems Market in Energy and Infrastructure Revenue Million Forecast, by Country 2019 & 2032
- Table 53: Global Inertial Systems Market in Energy and Infrastructure Revenue Million Forecast, by Component 2019 & 2032
- Table 54: Global Inertial Systems Market in Energy and Infrastructure Revenue Million Forecast, by Country 2019 & 2032
Frequently Asked Questions
1. What is the projected Compound Annual Growth Rate (CAGR) of the Inertial Systems Market in Energy and Infrastructure?
The projected CAGR is approximately 12.90%.
2. Which companies are prominent players in the Inertial Systems Market in Energy and Infrastructure?
Key companies in the market include ST Microelectronics NV, Honeywell International Inc, Thales Group, Safran Group (SAGEM), Bosch Sensortec GmbH, Vector NAV Technologies, Invensense Inc, Silicon Sensing Systems Ltd, Analog Devices Inc, Northrop Grumman Corporation.
3. What are the main segments of the Inertial Systems Market in Energy and Infrastructure?
The market segments include Component.
4. Can you provide details about the market size?
The market size is estimated to be USD XX Million as of 2022.
5. What are some drivers contributing to market growth?
; Emergence of MEMS Technology; Increasing Applications Based on Motion Sensing.
6. What are the notable trends driving market growth?
MEMs to Hold Significant Market Growth in the Oil and Gas Sector.
7. Are there any restraints impacting market growth?
; Integration Drift Error.
8. Can you provide examples of recent developments in the market?
N/A
9. What pricing options are available for accessing the report?
Pricing options include single-user, multi-user, and enterprise licenses priced at USD 4750, USD 5250, and USD 8750 respectively.
10. Is the market size provided in terms of value or volume?
The market size is provided in terms of value, measured in Million.
11. Are there any specific market keywords associated with the report?
Yes, the market keyword associated with the report is "Inertial Systems Market in Energy and Infrastructure," which aids in identifying and referencing the specific market segment covered.
12. How do I determine which pricing option suits my needs best?
The pricing options vary based on user requirements and access needs. Individual users may opt for single-user licenses, while businesses requiring broader access may choose multi-user or enterprise licenses for cost-effective access to the report.
13. Are there any additional resources or data provided in the Inertial Systems Market in Energy and Infrastructure report?
While the report offers comprehensive insights, it's advisable to review the specific contents or supplementary materials provided to ascertain if additional resources or data are available.
14. How can I stay updated on further developments or reports in the Inertial Systems Market in Energy and Infrastructure?
To stay informed about further developments, trends, and reports in the Inertial Systems Market in Energy and Infrastructure, consider subscribing to industry newsletters, following relevant companies and organizations, or regularly checking reputable industry news sources and publications.
Methodology
Step 1 - Identification of Relevant Samples Size from Population Database


Step 2 - Approaches for Defining Global Market Size (Value, Volume* & Price*)

Note*: In applicable scenarios
Step 3 - Data Sources
Primary Research
- Web Analytics
- Survey Reports
- Research Institute
- Latest Research Reports
- Opinion Leaders
Secondary Research
- Annual Reports
- White Paper
- Latest Press Release
- Industry Association
- Paid Database
- Investor Presentations

Step 4 - Data Triangulation
Involves using different sources of information in order to increase the validity of a study
These sources are likely to be stakeholders in a program - participants, other researchers, program staff, other community members, and so on.
Then we put all data in single framework & apply various statistical tools to find out the dynamic on the market.
During the analysis stage, feedback from the stakeholder groups would be compared to determine areas of agreement as well as areas of divergence


