
Key Insights
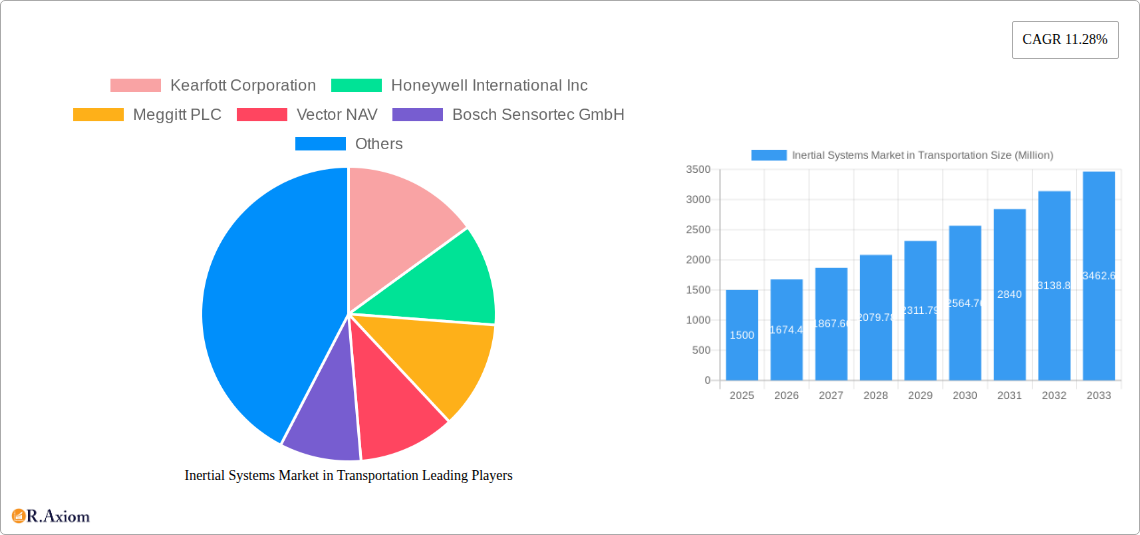
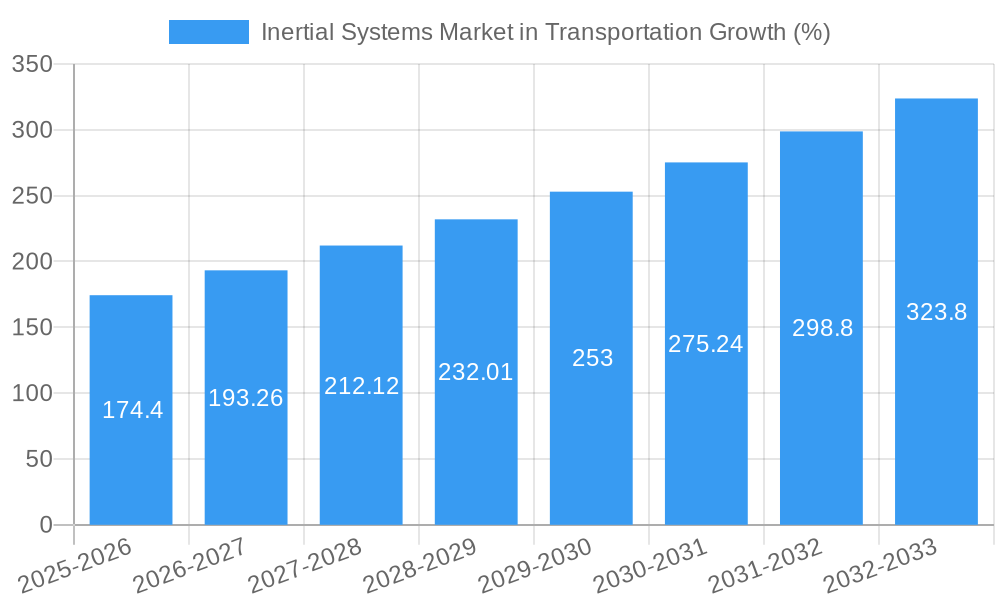
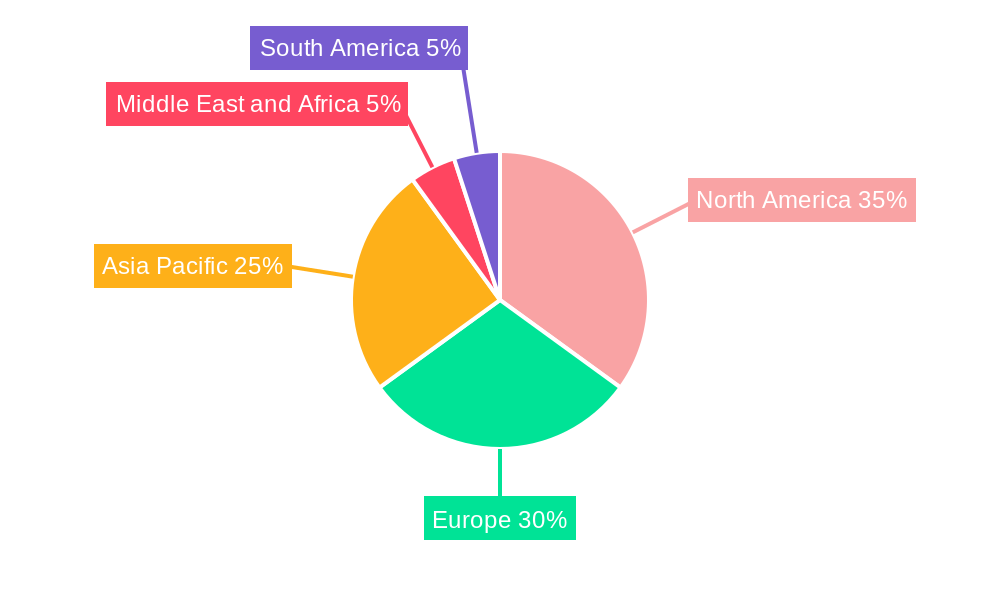
The Inertial Systems Market in Transportation is experiencing robust growth, driven by the increasing adoption of autonomous vehicles, drones, and advanced driver-assistance systems (ADAS). The market, valued at approximately $XX million in 2025, is projected to achieve a Compound Annual Growth Rate (CAGR) of 11.28% from 2025 to 2033. This expansion is fueled by several key factors. The automotive sector is a major contributor, with Original Equipment Manufacturers (OEMs) and Tier 1 suppliers integrating inertial systems for precise navigation, stability control, and collision avoidance. The burgeoning drone industry further fuels demand, requiring highly accurate and reliable inertial measurement units (IMUs) and inertial navigation systems (INS) for stable flight and autonomous operation. Furthermore, the rising demand for improved safety and efficiency in industrial and commercial applications, such as logistics and robotics, is driving the adoption of these systems across various sectors. The market is segmented by component (accelerometers, gyroscopes, IMUs, INS, other components), application (autonomous vehicles, drones, industrial/commercial applications, other applications), and end-user (automotive OEMs, Tier 1 suppliers, other end-users). The regional distribution reveals significant market presence in North America and Europe, with Asia-Pacific exhibiting rapid growth potential due to expanding manufacturing and technological advancements.
While significant growth is expected, the market faces certain challenges. High initial investment costs for advanced inertial systems can act as a restraint for some applications, particularly in developing economies. Furthermore, the complexity of integrating these systems into existing vehicle architectures and the need for robust testing and validation processes can slow down wider adoption. However, ongoing technological advancements, such as the development of miniaturized, low-cost, and high-performance inertial sensors, are expected to mitigate these challenges and further stimulate market growth in the forecast period. The competitive landscape is characterized by a mix of established players and emerging technology companies, leading to innovation and price competition, which benefits end-users.
Inertial Systems Market in Transportation: A Comprehensive Report (2019-2033)
This comprehensive report provides a detailed analysis of the Inertial Systems market in the Transportation sector, offering invaluable insights for industry stakeholders, investors, and strategic decision-makers. The report covers the period from 2019 to 2033, with 2025 serving as the base and estimated year. It meticulously examines market size, growth drivers, challenges, opportunities, and key players, providing a holistic understanding of this dynamic market. The report utilizes a robust methodology and incorporates current market data to deliver actionable insights and reliable forecasts. The total market size is projected to reach xx Million by 2033.
Inertial Systems Market in Transportation Market Concentration & Innovation
The Inertial Systems market in transportation exhibits a moderately concentrated landscape, with several established players holding significant market share. Key players such as Honeywell International Inc. and Bosch Sensortec GmbH command substantial market presence due to their extensive product portfolios and technological expertise. However, the market also accommodates smaller, specialized companies focusing on niche applications or advanced technologies. The market share of the top 5 players is estimated at xx%.
Innovation Drivers: The market is driven by continuous advancements in sensor technology, particularly in miniaturization, enhanced accuracy, and reduced power consumption. The development of MEMS (Microelectromechanical Systems)-based inertial sensors has significantly contributed to cost reduction and increased integration capabilities.
Regulatory Frameworks: Stringent safety regulations and standards governing autonomous vehicles and other transportation applications are shaping the demand for high-precision and reliable inertial systems. Compliance with these regulations is crucial for market entry and sustained growth.
Product Substitutes: While inertial systems are currently the dominant technology for many applications, alternative navigation technologies like GPS and vision-based systems are emerging. However, inertial systems offer advantages in GPS-denied environments, making them irreplaceable in certain applications.
End-User Trends: The increasing adoption of autonomous vehicles, drones, and advanced driver-assistance systems (ADAS) is a major driver of market growth. Automotive OEMs and Tier 1 suppliers are actively incorporating inertial systems into their products to enhance safety, performance, and efficiency.
M&A Activities: Recent mergers and acquisitions, such as Inertial Labs’ acquisition of Memsense in December 2021, demonstrate the ongoing consolidation within the market. These activities aim to expand product portfolios, enhance technological capabilities, and strengthen market positions. The total value of M&A deals in the last 5 years is estimated at xx Million.
Inertial Systems Market in Transportation Industry Trends & Insights
The Inertial Systems market in transportation is experiencing robust growth, driven by several key factors. The global market is projected to grow at a CAGR of xx% during the forecast period (2025-2033). Technological advancements, such as the development of more accurate and reliable inertial sensors, are significantly contributing to market expansion. The increasing demand for autonomous vehicles and drones presents lucrative opportunities for market players. Consumer preferences are shifting towards vehicles with advanced safety features, further fueling demand for high-performance inertial systems. However, competitive dynamics remain intense, with established players and emerging companies vying for market share. The market penetration of MEMS-based inertial sensors is estimated to be xx%.
Dominant Markets & Segments in Inertial Systems Market in Transportation
Dominant Regions/Countries: North America and Europe currently hold the largest market share due to the high adoption of advanced transportation technologies and robust automotive industries. The Asia-Pacific region is expected to exhibit significant growth in the coming years, driven by the expanding automotive sector and increasing investments in infrastructure.
Dominant Segments:
Component: IMUs (Inertial Measurement Units) and INS (Inertial Navigation Systems) are the dominant segments, owing to their widespread use in various applications. Accelerometers and gyroscopes, as essential components of IMUs and INS, also hold significant market shares.
Application: Autonomous vehicles are projected to be the fastest-growing application segment, followed by drones. The growing demand for enhanced navigation accuracy and safety features in these applications is fueling the market.
End-user: Automotive OEMs and Tier 1 suppliers are the primary end-users, accounting for a large portion of market demand. Other end-users include industrial and commercial entities employing navigation and positioning systems.
Key Drivers by Segment:
- Autonomous Vehicles: Demand driven by the increasing adoption of autonomous driving technologies and the need for precise navigation and localization.
- Drones: Fueled by the expansion of drone applications across various sectors, including delivery, surveillance, and aerial photography.
- Automotive OEMs: Driven by the need to incorporate advanced safety and performance features in vehicles.
Inertial Systems Market in Transportation Product Developments
Recent advancements focus on developing smaller, lighter, and more energy-efficient inertial sensors with enhanced accuracy and robustness. The integration of advanced algorithms and sensor fusion techniques is improving the overall performance and reliability of inertial navigation systems. The market is witnessing the introduction of next-generation inertial sensors with significantly improved accuracy compared to existing products, as exemplified by Honeywell's recent developments. These improvements enable the development of more sophisticated and capable applications for autonomous vehicles and other high-precision navigation systems.
Report Scope & Segmentation Analysis
This report segments the Inertial Systems market in transportation across components (Accelerometer, Gyroscope, IMU, INS, Other Components), applications (Autonomous vehicles, Drones, Industrial and commercial applications, Other applications), and end-users (Automotive OEMs, Tier 1 suppliers, other end-users). Each segment is analyzed in terms of market size, growth projections, and competitive dynamics. The report provides detailed insights into the performance of each segment and identifies key growth opportunities. For instance, the autonomous vehicle segment is projected to exhibit high growth, driven by advancements in autonomous driving technology.
Key Drivers of Inertial Systems Market in Transportation Growth
Several factors drive the growth of the Inertial Systems market in transportation. These include:
- Technological advancements: Continuous improvements in sensor technology, leading to higher accuracy, smaller size, and reduced power consumption.
- Government regulations: Stringent safety regulations mandating the use of advanced navigation systems in vehicles.
- Rising demand for autonomous vehicles: The rapid expansion of the autonomous vehicle market is creating significant demand for high-performance inertial systems.
- Growth of the drone industry: The increasing adoption of drones in various sectors drives demand for reliable and accurate navigation systems.
Challenges in the Inertial Systems Market in Transportation Sector
The market faces several challenges, including:
- High cost of development and manufacturing: Advanced inertial systems can be expensive to develop and produce, limiting their accessibility to certain market segments.
- Supply chain disruptions: Disruptions in the supply chain can impact the availability of components and affect production timelines.
- Intense competition: The market is highly competitive, with several established and emerging players vying for market share.
- Technological limitations: While advancements are ongoing, limitations in accuracy and robustness remain in certain applications.
Emerging Opportunities in Inertial Systems Market in Transportation
Several emerging opportunities exist in the market:
- Integration with other sensor technologies: The integration of inertial systems with other sensor technologies, such as GPS and cameras, can enhance navigation accuracy and reliability.
- Development of new applications: The development of new applications for inertial systems, such as in robotics and precision agriculture, offers growth potential.
- Expansion in emerging markets: Developing economies are presenting new opportunities for market expansion, driven by rising transportation infrastructure development.
Leading Players in the Inertial Systems Market in Transportation Market
- Kearfott Corporation
- Honeywell International Inc
- Meggitt PLC
- Vector NAV
- Bosch Sensortec GmbH
- Rockwell Collins
- KVH Industries Inc
- Invensense Inc
- Epson Europe Electronic
- Thames Group
- ST Microelectronics
- Silicon Sensing Systems Ltd
- Ixblue
- Analog Devices Inc
- Northrop Grumman Corporation
- Safran Group
- UTC Aerospace Systems
Key Developments in Inertial Systems Market in Transportation Industry
- January 2021: Honeywell, with DARPA funding, develops next-generation inertial sensors exceeding the accuracy of its HG1930 IMU by more than an order of magnitude.
- December 2021: Inertial Labs acquires Memsense, accelerating the development of breakthrough technologies for autonomous vehicles and GPS-denied navigation.
Strategic Outlook for Inertial Systems Market in Transportation Market
The future of the Inertial Systems market in transportation looks promising. Continued advancements in sensor technology, increasing demand for autonomous vehicles and drones, and the expansion of applications across various sectors will drive market growth. The integration of inertial systems with other sensor technologies and the development of sophisticated algorithms will enhance navigation accuracy and reliability, further expanding market opportunities. The market is poised for substantial growth, driven by technological innovation and the adoption of advanced transportation technologies.
Inertial Systems Market in Transportation Segmentation
-
1. Component
- 1.1. Accelerometer
- 1.2. Gyroscope
- 1.3. Inertial Measurement Systems (IMU)
- 1.4. Inertial Navigation Systems (INS)
- 1.5. Other Components
Inertial Systems Market in Transportation Segmentation By Geography
- 1. North America
- 2. Europe
- 3. Asia Pacific
- 4. Latin America
- 5. Middle East and Africa
Inertial Systems Market in Transportation REPORT HIGHLIGHTS
| Aspects | Details |
|---|---|
| Study Period | 2019-2033 |
| Base Year | 2024 |
| Estimated Year | 2025 |
| Forecast Period | 2025-2033 |
| Historical Period | 2019-2024 |
| Growth Rate | CAGR of 11.28% from 2019-2033 |
| Segmentation |
|
Table of Contents
- 1. Introduction
- 1.1. Research Scope
- 1.2. Market Segmentation
- 1.3. Research Methodology
- 1.4. Definitions and Assumptions
- 2. Executive Summary
- 2.1. Introduction
- 3. Market Dynamics
- 3.1. Introduction
- 3.2. Market Drivers
- 3.2.1. Emergence of MEMS Technology; Rapid Rise of Unmanned Vehicles in Both Defense and Civilian Applications
- 3.3. Market Restrains
- 3.3.1. Integration Drift Error is a Major Concern in Navigation Systems
- 3.4. Market Trends
- 3.4.1. Rise in Demand for Automotive MEMS in the Market
- 4. Market Factor Analysis
- 4.1. Porters Five Forces
- 4.2. Supply/Value Chain
- 4.3. PESTEL analysis
- 4.4. Market Entropy
- 4.5. Patent/Trademark Analysis
- 5. Global Inertial Systems Market in Transportation Analysis, Insights and Forecast, 2019-2031
- 5.1. Market Analysis, Insights and Forecast - by Component
- 5.1.1. Accelerometer
- 5.1.2. Gyroscope
- 5.1.3. Inertial Measurement Systems (IMU)
- 5.1.4. Inertial Navigation Systems (INS)
- 5.1.5. Other Components
- 5.2. Market Analysis, Insights and Forecast - by Region
- 5.2.1. North America
- 5.2.2. Europe
- 5.2.3. Asia Pacific
- 5.2.4. Latin America
- 5.2.5. Middle East and Africa
- 5.1. Market Analysis, Insights and Forecast - by Component
- 6. North America Inertial Systems Market in Transportation Analysis, Insights and Forecast, 2019-2031
- 6.1. Market Analysis, Insights and Forecast - by Component
- 6.1.1. Accelerometer
- 6.1.2. Gyroscope
- 6.1.3. Inertial Measurement Systems (IMU)
- 6.1.4. Inertial Navigation Systems (INS)
- 6.1.5. Other Components
- 6.1. Market Analysis, Insights and Forecast - by Component
- 7. Europe Inertial Systems Market in Transportation Analysis, Insights and Forecast, 2019-2031
- 7.1. Market Analysis, Insights and Forecast - by Component
- 7.1.1. Accelerometer
- 7.1.2. Gyroscope
- 7.1.3. Inertial Measurement Systems (IMU)
- 7.1.4. Inertial Navigation Systems (INS)
- 7.1.5. Other Components
- 7.1. Market Analysis, Insights and Forecast - by Component
- 8. Asia Pacific Inertial Systems Market in Transportation Analysis, Insights and Forecast, 2019-2031
- 8.1. Market Analysis, Insights and Forecast - by Component
- 8.1.1. Accelerometer
- 8.1.2. Gyroscope
- 8.1.3. Inertial Measurement Systems (IMU)
- 8.1.4. Inertial Navigation Systems (INS)
- 8.1.5. Other Components
- 8.1. Market Analysis, Insights and Forecast - by Component
- 9. Latin America Inertial Systems Market in Transportation Analysis, Insights and Forecast, 2019-2031
- 9.1. Market Analysis, Insights and Forecast - by Component
- 9.1.1. Accelerometer
- 9.1.2. Gyroscope
- 9.1.3. Inertial Measurement Systems (IMU)
- 9.1.4. Inertial Navigation Systems (INS)
- 9.1.5. Other Components
- 9.1. Market Analysis, Insights and Forecast - by Component
- 10. Middle East and Africa Inertial Systems Market in Transportation Analysis, Insights and Forecast, 2019-2031
- 10.1. Market Analysis, Insights and Forecast - by Component
- 10.1.1. Accelerometer
- 10.1.2. Gyroscope
- 10.1.3. Inertial Measurement Systems (IMU)
- 10.1.4. Inertial Navigation Systems (INS)
- 10.1.5. Other Components
- 10.1. Market Analysis, Insights and Forecast - by Component
- 11. North America Inertial Systems Market in Transportation Analysis, Insights and Forecast, 2019-2031
- 11.1. Market Analysis, Insights and Forecast - By Country/Sub-region
- 11.1.1 United States
- 11.1.2 Canada
- 11.1.3 Mexico
- 11.1.4 Rest of North America
- 12. Europe Inertial Systems Market in Transportation Analysis, Insights and Forecast, 2019-2031
- 12.1. Market Analysis, Insights and Forecast - By Country/Sub-region
- 12.1.1 Germany
- 12.1.2 France
- 12.1.3 Italy
- 12.1.4 United Kingdom
- 12.1.5 Netherlands
- 12.1.6 Sweden
- 12.1.7 Rest of Europe
- 13. Asia Pacific Inertial Systems Market in Transportation Analysis, Insights and Forecast, 2019-2031
- 13.1. Market Analysis, Insights and Forecast - By Country/Sub-region
- 13.1.1 China
- 13.1.2 India
- 13.1.3 Japan
- 13.1.4 ASEAN Countries
- 13.1.5 Rest of Asia Pacific
- 14. Middle East and Africa Inertial Systems Market in Transportation Analysis, Insights and Forecast, 2019-2031
- 14.1. Market Analysis, Insights and Forecast - By Country/Sub-region
- 14.1.1 GCC
- 14.1.2 South Africa
- 14.1.3 Rest of Middle East and Africa
- 15. South America Inertial Systems Market in Transportation Analysis, Insights and Forecast, 2019-2031
- 15.1. Market Analysis, Insights and Forecast - By Country/Sub-region
- 15.1.1 Brazil
- 15.1.2 Argentina
- 15.1.3 Rest of South America
- 16. Competitive Analysis
- 16.1. Global Market Share Analysis 2024
- 16.2. Company Profiles
- 16.2.1 Kearfott Corporation
- 16.2.1.1. Overview
- 16.2.1.2. Products
- 16.2.1.3. SWOT Analysis
- 16.2.1.4. Recent Developments
- 16.2.1.5. Financials (Based on Availability)
- 16.2.2 Honeywell International Inc
- 16.2.2.1. Overview
- 16.2.2.2. Products
- 16.2.2.3. SWOT Analysis
- 16.2.2.4. Recent Developments
- 16.2.2.5. Financials (Based on Availability)
- 16.2.3 Meggitt PLC
- 16.2.3.1. Overview
- 16.2.3.2. Products
- 16.2.3.3. SWOT Analysis
- 16.2.3.4. Recent Developments
- 16.2.3.5. Financials (Based on Availability)
- 16.2.4 Vector NAV
- 16.2.4.1. Overview
- 16.2.4.2. Products
- 16.2.4.3. SWOT Analysis
- 16.2.4.4. Recent Developments
- 16.2.4.5. Financials (Based on Availability)
- 16.2.5 Bosch Sensortec GmbH
- 16.2.5.1. Overview
- 16.2.5.2. Products
- 16.2.5.3. SWOT Analysis
- 16.2.5.4. Recent Developments
- 16.2.5.5. Financials (Based on Availability)
- 16.2.6 Rockwell Collins
- 16.2.6.1. Overview
- 16.2.6.2. Products
- 16.2.6.3. SWOT Analysis
- 16.2.6.4. Recent Developments
- 16.2.6.5. Financials (Based on Availability)
- 16.2.7 KVH Industries Inc
- 16.2.7.1. Overview
- 16.2.7.2. Products
- 16.2.7.3. SWOT Analysis
- 16.2.7.4. Recent Developments
- 16.2.7.5. Financials (Based on Availability)
- 16.2.8 Invensense Inc
- 16.2.8.1. Overview
- 16.2.8.2. Products
- 16.2.8.3. SWOT Analysis
- 16.2.8.4. Recent Developments
- 16.2.8.5. Financials (Based on Availability)
- 16.2.9 Epson Europe Electronic
- 16.2.9.1. Overview
- 16.2.9.2. Products
- 16.2.9.3. SWOT Analysis
- 16.2.9.4. Recent Developments
- 16.2.9.5. Financials (Based on Availability)
- 16.2.10 Thames Group
- 16.2.10.1. Overview
- 16.2.10.2. Products
- 16.2.10.3. SWOT Analysis
- 16.2.10.4. Recent Developments
- 16.2.10.5. Financials (Based on Availability)
- 16.2.11 ST Microelectronics
- 16.2.11.1. Overview
- 16.2.11.2. Products
- 16.2.11.3. SWOT Analysis
- 16.2.11.4. Recent Developments
- 16.2.11.5. Financials (Based on Availability)
- 16.2.12 Silicon Sensing Systems Ltd
- 16.2.12.1. Overview
- 16.2.12.2. Products
- 16.2.12.3. SWOT Analysis
- 16.2.12.4. Recent Developments
- 16.2.12.5. Financials (Based on Availability)
- 16.2.13 Ixbluesas
- 16.2.13.1. Overview
- 16.2.13.2. Products
- 16.2.13.3. SWOT Analysis
- 16.2.13.4. Recent Developments
- 16.2.13.5. Financials (Based on Availability)
- 16.2.14 Analog Devices Inc
- 16.2.14.1. Overview
- 16.2.14.2. Products
- 16.2.14.3. SWOT Analysis
- 16.2.14.4. Recent Developments
- 16.2.14.5. Financials (Based on Availability)
- 16.2.15 Northrop Grumman Corporation
- 16.2.15.1. Overview
- 16.2.15.2. Products
- 16.2.15.3. SWOT Analysis
- 16.2.15.4. Recent Developments
- 16.2.15.5. Financials (Based on Availability)
- 16.2.16 Safran Group
- 16.2.16.1. Overview
- 16.2.16.2. Products
- 16.2.16.3. SWOT Analysis
- 16.2.16.4. Recent Developments
- 16.2.16.5. Financials (Based on Availability)
- 16.2.17 UTC Aerospace Systems
- 16.2.17.1. Overview
- 16.2.17.2. Products
- 16.2.17.3. SWOT Analysis
- 16.2.17.4. Recent Developments
- 16.2.17.5. Financials (Based on Availability)
- 16.2.1 Kearfott Corporation
List of Figures
- Figure 1: Global Inertial Systems Market in Transportation Revenue Breakdown (Million, %) by Region 2024 & 2032
- Figure 2: North America Inertial Systems Market in Transportation Revenue (Million), by Country 2024 & 2032
- Figure 3: North America Inertial Systems Market in Transportation Revenue Share (%), by Country 2024 & 2032
- Figure 4: Europe Inertial Systems Market in Transportation Revenue (Million), by Country 2024 & 2032
- Figure 5: Europe Inertial Systems Market in Transportation Revenue Share (%), by Country 2024 & 2032
- Figure 6: Asia Pacific Inertial Systems Market in Transportation Revenue (Million), by Country 2024 & 2032
- Figure 7: Asia Pacific Inertial Systems Market in Transportation Revenue Share (%), by Country 2024 & 2032
- Figure 8: Middle East and Africa Inertial Systems Market in Transportation Revenue (Million), by Country 2024 & 2032
- Figure 9: Middle East and Africa Inertial Systems Market in Transportation Revenue Share (%), by Country 2024 & 2032
- Figure 10: South America Inertial Systems Market in Transportation Revenue (Million), by Country 2024 & 2032
- Figure 11: South America Inertial Systems Market in Transportation Revenue Share (%), by Country 2024 & 2032
- Figure 12: North America Inertial Systems Market in Transportation Revenue (Million), by Component 2024 & 2032
- Figure 13: North America Inertial Systems Market in Transportation Revenue Share (%), by Component 2024 & 2032
- Figure 14: North America Inertial Systems Market in Transportation Revenue (Million), by Country 2024 & 2032
- Figure 15: North America Inertial Systems Market in Transportation Revenue Share (%), by Country 2024 & 2032
- Figure 16: Europe Inertial Systems Market in Transportation Revenue (Million), by Component 2024 & 2032
- Figure 17: Europe Inertial Systems Market in Transportation Revenue Share (%), by Component 2024 & 2032
- Figure 18: Europe Inertial Systems Market in Transportation Revenue (Million), by Country 2024 & 2032
- Figure 19: Europe Inertial Systems Market in Transportation Revenue Share (%), by Country 2024 & 2032
- Figure 20: Asia Pacific Inertial Systems Market in Transportation Revenue (Million), by Component 2024 & 2032
- Figure 21: Asia Pacific Inertial Systems Market in Transportation Revenue Share (%), by Component 2024 & 2032
- Figure 22: Asia Pacific Inertial Systems Market in Transportation Revenue (Million), by Country 2024 & 2032
- Figure 23: Asia Pacific Inertial Systems Market in Transportation Revenue Share (%), by Country 2024 & 2032
- Figure 24: Latin America Inertial Systems Market in Transportation Revenue (Million), by Component 2024 & 2032
- Figure 25: Latin America Inertial Systems Market in Transportation Revenue Share (%), by Component 2024 & 2032
- Figure 26: Latin America Inertial Systems Market in Transportation Revenue (Million), by Country 2024 & 2032
- Figure 27: Latin America Inertial Systems Market in Transportation Revenue Share (%), by Country 2024 & 2032
- Figure 28: Middle East and Africa Inertial Systems Market in Transportation Revenue (Million), by Component 2024 & 2032
- Figure 29: Middle East and Africa Inertial Systems Market in Transportation Revenue Share (%), by Component 2024 & 2032
- Figure 30: Middle East and Africa Inertial Systems Market in Transportation Revenue (Million), by Country 2024 & 2032
- Figure 31: Middle East and Africa Inertial Systems Market in Transportation Revenue Share (%), by Country 2024 & 2032
List of Tables
- Table 1: Global Inertial Systems Market in Transportation Revenue Million Forecast, by Region 2019 & 2032
- Table 2: Global Inertial Systems Market in Transportation Revenue Million Forecast, by Component 2019 & 2032
- Table 3: Global Inertial Systems Market in Transportation Revenue Million Forecast, by Region 2019 & 2032
- Table 4: Global Inertial Systems Market in Transportation Revenue Million Forecast, by Country 2019 & 2032
- Table 5: United States Inertial Systems Market in Transportation Revenue (Million) Forecast, by Application 2019 & 2032
- Table 6: Canada Inertial Systems Market in Transportation Revenue (Million) Forecast, by Application 2019 & 2032
- Table 7: Mexico Inertial Systems Market in Transportation Revenue (Million) Forecast, by Application 2019 & 2032
- Table 8: Rest of North America Inertial Systems Market in Transportation Revenue (Million) Forecast, by Application 2019 & 2032
- Table 9: Global Inertial Systems Market in Transportation Revenue Million Forecast, by Country 2019 & 2032
- Table 10: Germany Inertial Systems Market in Transportation Revenue (Million) Forecast, by Application 2019 & 2032
- Table 11: France Inertial Systems Market in Transportation Revenue (Million) Forecast, by Application 2019 & 2032
- Table 12: Italy Inertial Systems Market in Transportation Revenue (Million) Forecast, by Application 2019 & 2032
- Table 13: United Kingdom Inertial Systems Market in Transportation Revenue (Million) Forecast, by Application 2019 & 2032
- Table 14: Netherlands Inertial Systems Market in Transportation Revenue (Million) Forecast, by Application 2019 & 2032
- Table 15: Sweden Inertial Systems Market in Transportation Revenue (Million) Forecast, by Application 2019 & 2032
- Table 16: Rest of Europe Inertial Systems Market in Transportation Revenue (Million) Forecast, by Application 2019 & 2032
- Table 17: Global Inertial Systems Market in Transportation Revenue Million Forecast, by Country 2019 & 2032
- Table 18: China Inertial Systems Market in Transportation Revenue (Million) Forecast, by Application 2019 & 2032
- Table 19: India Inertial Systems Market in Transportation Revenue (Million) Forecast, by Application 2019 & 2032
- Table 20: Japan Inertial Systems Market in Transportation Revenue (Million) Forecast, by Application 2019 & 2032
- Table 21: ASEAN Countries Inertial Systems Market in Transportation Revenue (Million) Forecast, by Application 2019 & 2032
- Table 22: Rest of Asia Pacific Inertial Systems Market in Transportation Revenue (Million) Forecast, by Application 2019 & 2032
- Table 23: Global Inertial Systems Market in Transportation Revenue Million Forecast, by Country 2019 & 2032
- Table 24: GCC Inertial Systems Market in Transportation Revenue (Million) Forecast, by Application 2019 & 2032
- Table 25: South Africa Inertial Systems Market in Transportation Revenue (Million) Forecast, by Application 2019 & 2032
- Table 26: Rest of Middle East and Africa Inertial Systems Market in Transportation Revenue (Million) Forecast, by Application 2019 & 2032
- Table 27: Global Inertial Systems Market in Transportation Revenue Million Forecast, by Country 2019 & 2032
- Table 28: Brazil Inertial Systems Market in Transportation Revenue (Million) Forecast, by Application 2019 & 2032
- Table 29: Argentina Inertial Systems Market in Transportation Revenue (Million) Forecast, by Application 2019 & 2032
- Table 30: Rest of South America Inertial Systems Market in Transportation Revenue (Million) Forecast, by Application 2019 & 2032
- Table 31: Global Inertial Systems Market in Transportation Revenue Million Forecast, by Component 2019 & 2032
- Table 32: Global Inertial Systems Market in Transportation Revenue Million Forecast, by Country 2019 & 2032
- Table 33: Global Inertial Systems Market in Transportation Revenue Million Forecast, by Component 2019 & 2032
- Table 34: Global Inertial Systems Market in Transportation Revenue Million Forecast, by Country 2019 & 2032
- Table 35: Global Inertial Systems Market in Transportation Revenue Million Forecast, by Component 2019 & 2032
- Table 36: Global Inertial Systems Market in Transportation Revenue Million Forecast, by Country 2019 & 2032
- Table 37: Global Inertial Systems Market in Transportation Revenue Million Forecast, by Component 2019 & 2032
- Table 38: Global Inertial Systems Market in Transportation Revenue Million Forecast, by Country 2019 & 2032
- Table 39: Global Inertial Systems Market in Transportation Revenue Million Forecast, by Component 2019 & 2032
- Table 40: Global Inertial Systems Market in Transportation Revenue Million Forecast, by Country 2019 & 2032
Frequently Asked Questions
1. What is the projected Compound Annual Growth Rate (CAGR) of the Inertial Systems Market in Transportation?
The projected CAGR is approximately 11.28%.
2. Which companies are prominent players in the Inertial Systems Market in Transportation?
Key companies in the market include Kearfott Corporation, Honeywell International Inc, Meggitt PLC, Vector NAV, Bosch Sensortec GmbH, Rockwell Collins, KVH Industries Inc, Invensense Inc, Epson Europe Electronic, Thames Group, ST Microelectronics, Silicon Sensing Systems Ltd, Ixbluesas, Analog Devices Inc, Northrop Grumman Corporation, Safran Group, UTC Aerospace Systems.
3. What are the main segments of the Inertial Systems Market in Transportation?
The market segments include Component.
4. Can you provide details about the market size?
The market size is estimated to be USD XX Million as of 2022.
5. What are some drivers contributing to market growth?
Emergence of MEMS Technology; Rapid Rise of Unmanned Vehicles in Both Defense and Civilian Applications.
6. What are the notable trends driving market growth?
Rise in Demand for Automotive MEMS in the Market.
7. Are there any restraints impacting market growth?
Integration Drift Error is a Major Concern in Navigation Systems.
8. Can you provide examples of recent developments in the market?
January 2021- Honeywell, with funding from the U.S. Defense Advanced Research Projects Agency (DARPA), is creating the next generation of inertial sensor technology that will be used in both commercial and defense navigation applications. Recently, Honeywell labs have shown the new sensors to be greater than an order of magnitude more accurate than Honeywell's HG1930 inertial measurement unit (IMU) product, a tactical-grade product with more than 150,000 units currently in use.
9. What pricing options are available for accessing the report?
Pricing options include single-user, multi-user, and enterprise licenses priced at USD 3800, USD 4500, and USD 5800 respectively.
10. Is the market size provided in terms of value or volume?
The market size is provided in terms of value, measured in Million.
11. Are there any specific market keywords associated with the report?
Yes, the market keyword associated with the report is "Inertial Systems Market in Transportation," which aids in identifying and referencing the specific market segment covered.
12. How do I determine which pricing option suits my needs best?
The pricing options vary based on user requirements and access needs. Individual users may opt for single-user licenses, while businesses requiring broader access may choose multi-user or enterprise licenses for cost-effective access to the report.
13. Are there any additional resources or data provided in the Inertial Systems Market in Transportation report?
While the report offers comprehensive insights, it's advisable to review the specific contents or supplementary materials provided to ascertain if additional resources or data are available.
14. How can I stay updated on further developments or reports in the Inertial Systems Market in Transportation?
To stay informed about further developments, trends, and reports in the Inertial Systems Market in Transportation, consider subscribing to industry newsletters, following relevant companies and organizations, or regularly checking reputable industry news sources and publications.
Methodology
Step 1 - Identification of Relevant Samples Size from Population Database


Step 2 - Approaches for Defining Global Market Size (Value, Volume* & Price*)

Note*: In applicable scenarios
Step 3 - Data Sources
Primary Research
- Web Analytics
- Survey Reports
- Research Institute
- Latest Research Reports
- Opinion Leaders
Secondary Research
- Annual Reports
- White Paper
- Latest Press Release
- Industry Association
- Paid Database
- Investor Presentations

Step 4 - Data Triangulation
Involves using different sources of information in order to increase the validity of a study
These sources are likely to be stakeholders in a program - participants, other researchers, program staff, other community members, and so on.
Then we put all data in single framework & apply various statistical tools to find out the dynamic on the market.
During the analysis stage, feedback from the stakeholder groups would be compared to determine areas of agreement as well as areas of divergence


