

Key Insights
The global Integrated Well Services market is poised for significant expansion, projected to reach $6424 million by 2025, with a robust Compound Annual Growth Rate (CAGR) of 6.1% anticipated over the forecast period. This growth trajectory is primarily fueled by an increasing demand for enhanced oil recovery (EOR) techniques and the persistent need for efficient well completions in both onshore and offshore environments. As the energy sector navigates the complexities of maintaining production from mature fields and exploring new reserves, integrated well services offer a comprehensive, cost-effective solution by bundling various essential services such as drilling, completion, stimulation, and production optimization. The growing emphasis on operational efficiency, safety, and environmental compliance within the oil and gas industry further bolsters the adoption of these integrated service models, allowing operators to streamline operations and reduce overall project timelines and expenses.
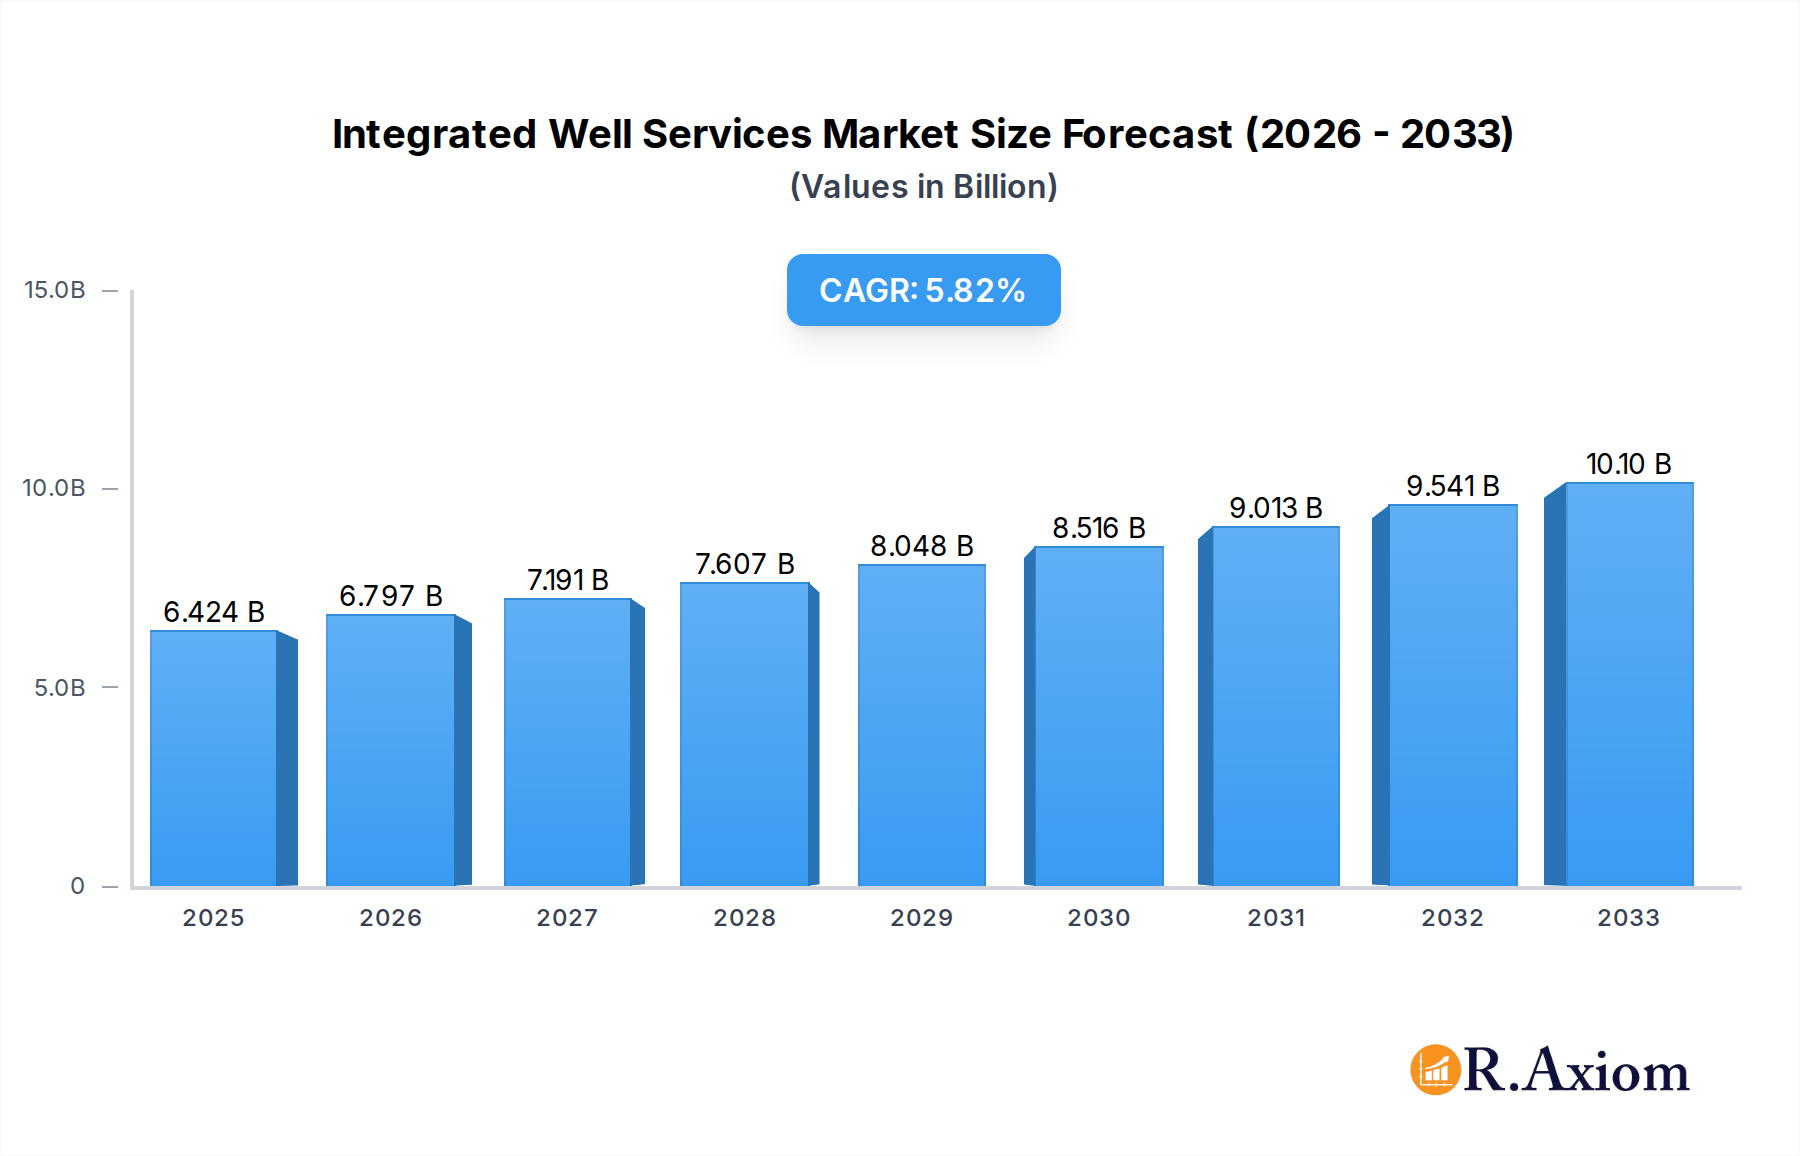
Integrated Well Services Market Size (In Billion)
The market segmentation reveals a balanced demand across different applications, with onshore operations representing a substantial portion, alongside growing contributions from offshore activities. The distinction between conventional and unconventional resource extraction also highlights the adaptability of integrated well services to diverse geological formations and production challenges. Key market drivers include the rising global energy demand, technological advancements in drilling and completion technologies, and strategic investments by major oil and gas companies to sustain and augment their production capabilities. While the market benefits from these factors, potential restraints such as fluctuating oil prices and stringent environmental regulations could pose challenges. However, the inherent efficiency and value proposition of integrated well services are expected to navigate these obstacles, ensuring sustained market development through 2033.

Integrated Well Services Company Market Share
Comprehensive Report: Integrated Well Services Market Analysis 2019-2033
This in-depth report provides a definitive analysis of the global Integrated Well Services market, projecting a robust growth trajectory from 2019 to 2033. With a base year of 2025, this study meticulously examines market dynamics, key players, technological advancements, and future opportunities within the industry. The report is an essential resource for stakeholders seeking to understand market concentration, innovation drivers, regulatory landscapes, evolving end-user trends, and strategic merger and acquisition activities shaping the integrated well services sector. It delves into the intricate interplay of market forces, technological disruptions, and shifting consumer preferences that are driving significant market penetration. Furthermore, the report highlights dominant markets and segments, pinpointing leading regions, countries, and specific applications, including onshore and offshore operations, as well as conventional and unconventional well types. This detailed segmentation ensures a granular understanding of market opportunities and challenges.
Integrated Well Services Market Concentration & Innovation
The global Integrated Well Services market exhibits a moderate to high concentration, with several key players dominating significant market shares. Leading entities such as Schlumberger Limited, Halliburton, Baker Hughes, and Weatherford International command substantial portions of the market due to their extensive service portfolios, technological prowess, and global operational footprints. Innovation remains a critical differentiator, with companies heavily investing in research and development to enhance drilling efficiency, optimize production, and reduce operational costs. Key innovation drivers include advancements in digital technologies, such as artificial intelligence (AI) and the Internet of Things (IoT), for real-time data analytics and predictive maintenance, as well as the development of advanced materials and techniques for challenging well environments. The regulatory framework, largely influenced by environmental protection mandates and safety standards, plays a crucial role in guiding service development and deployment, particularly for offshore and unconventional operations. The threat of product substitutes is relatively low in the core integrated well services, but advancements in alternative energy extraction methods or new drilling technologies could pose long-term challenges. End-user trends are leaning towards a greater demand for comprehensive, end-to-end solutions that streamline operations and reduce project timelines. Merger and acquisition (M&A) activities have been significant, with strategic consolidations aimed at expanding service offerings, gaining market access, and achieving economies of scale. Notable M&A deals, with an estimated value in the range of several hundred million to over a billion dollars, have reshaped the competitive landscape, enabling companies to offer a more holistic suite of services. For example, the acquisition of smaller, specialized technology providers by larger integrated service companies has bolstered their capabilities in niche areas. The market share of the top five players is estimated to be around 65% of the total market value.
Integrated Well Services Industry Trends & Insights
The Integrated Well Services industry is experiencing a period of dynamic growth, fueled by a confluence of factors including increasing global energy demand, technological advancements, and evolving operational strategies. The market is projected to grow at a Compound Annual Growth Rate (CAGR) of approximately 4.5% over the forecast period of 2025–2033. This growth is primarily driven by the escalating need for efficient and cost-effective oil and gas extraction, especially in mature fields requiring enhanced recovery techniques and in regions with complex geological formations. Technological disruptions are at the forefront of this evolution. The integration of digital solutions, including AI-powered predictive analytics for equipment failure, advanced downhole sensing technologies, and automated drilling systems, is revolutionizing operational efficiency and safety. For instance, the implementation of digital twins for well planning and monitoring is becoming increasingly prevalent, allowing for better visualization and real-time adjustments. These innovations are not only improving drilling success rates but also significantly reducing non-productive time (NPT).
Consumer preferences are shifting towards service providers who can offer a seamless, integrated package of solutions, thereby reducing the complexity of managing multiple vendors. This demand for integrated services spans the entire well lifecycle, from exploration and drilling to completion, production, and abandonment. Companies offering comprehensive solutions are gaining a competitive edge by simplifying project management for operators and ensuring greater accountability. The competitive dynamics within the market are intense, characterized by strategic partnerships, technological innovation races, and M&A activities aimed at consolidating market share and expanding service portfolios. The increasing focus on environmental sustainability and regulatory compliance is also shaping industry trends, pushing companies to develop and adopt greener technologies and practices, such as reduced water usage in hydraulic fracturing and lower emissions in operational activities. Market penetration is deepening as new regions adopt sophisticated integrated well services and as existing markets witness increased adoption of advanced technologies. The global market size is projected to reach over $150 billion by 2033, with significant contributions from both onshore and offshore segments.
Dominant Markets & Segments in Integrated Well Services
The global Integrated Well Services market is characterized by the dominance of specific regions and segments, driven by diverse economic policies, existing infrastructure, and geological resource distribution.
Onshore Dominance
The Onshore application segment represents the largest and most influential part of the integrated well services market. This dominance is primarily attributed to several key drivers:
- Vast Resource Base: Many of the world's major oil and gas reserves are located onshore, necessitating extensive drilling and production activities. Countries with significant shale gas and tight oil reserves, such as the United States, China, and Argentina, are major contributors to onshore well services demand.
- Infrastructure Development: Mature onshore basins often have well-established logistical networks and support infrastructure, making it easier and more cost-effective to deploy integrated well services compared to challenging offshore environments.
- Economic Policies: Government incentives, such as tax breaks and production-linked subsidies, encourage domestic exploration and production, thereby boosting demand for onshore services. For example, policies supporting energy independence in major consuming nations directly translate to increased onshore activity.
- Technological Advancements: Innovations in horizontal drilling and hydraulic fracturing have unlocked vast unconventional onshore resources, further solidifying the segment's importance. The ability to access previously uneconomical reserves has created sustained demand for integrated drilling, completion, and stimulation services.
The onshore segment benefits from higher drilling activity volumes and a more consistent demand cycle, making it a stable revenue generator for service companies. The market size for onshore integrated well services is estimated to be over $100 billion by 2033.
Offshore Segment Growth
While onshore dominates, the Offshore segment is a critical and rapidly evolving area, characterized by high-value projects and significant technological innovation.
- Deepwater and Ultra-Deepwater Exploration: The continued exploration and development of deepwater and ultra-deepwater fields, particularly in regions like the Gulf of Mexico, the North Sea, Brazil, and West Africa, are major growth drivers. These complex environments require highly specialized and integrated services.
- Technological Sophistication: Offshore operations demand advanced technologies for drilling in harsh environments, subsea completions, and floating production systems. This includes the integration of remotely operated vehicles (ROVs), subsea processing, and advanced reservoir management techniques.
- High Potential Reserves: Many of the world's remaining undeveloped hydrocarbon reserves are located offshore, making this segment crucial for future energy supply. The economic viability of these projects often hinges on the efficiency and effectiveness of integrated well services.
- Regulatory Frameworks: Stringent safety and environmental regulations in offshore operations necessitate comprehensive, well-managed service packages, often provided by integrated service providers to ensure compliance and minimize risks.
The offshore segment, though smaller in terms of the number of wells drilled compared to onshore, represents a significant portion of the market value due to the higher cost and complexity of each project. The market size for offshore integrated well services is projected to reach approximately $50 billion by 2033.
Conventional vs. Unconventional Dominance
The distinction between Conventional and Unconventional well types also segments the market significantly.
- Conventional Wells: These have historically formed the backbone of the oil and gas industry. While many mature conventional fields require mature production and well intervention services, new conventional discoveries continue to emerge, particularly in frontier regions. Integrated services for conventional wells often focus on optimizing production from existing reservoirs and efficiently developing new, less complex discoveries.
- Unconventional Wells: The rise of unconventional resources, such as shale oil and gas, has dramatically reshaped the market. Unconventional wells, characterized by horizontal drilling and hydraulic fracturing, demand highly specialized and integrated services from drilling and completion to stimulation and production optimization. This segment has seen substantial growth and innovation, driving demand for advanced technologies and comprehensive service packages. The market share of unconventional well services is growing at a faster pace than conventional services.
The market size for conventional well services is estimated to be around $80 billion by 2033, while the unconventional segment is projected to reach approximately $70 billion by 2033, with a higher growth rate.
Integrated Well Services Product Developments
Product development in Integrated Well Services is heavily focused on enhancing efficiency, safety, and environmental performance. Innovations include advanced drilling fluids that improve wellbore stability and reduce environmental impact, intelligent completion systems that allow for real-time reservoir monitoring and control, and advanced artificial lift technologies that optimize production from mature wells. The integration of digital solutions, such as AI-driven operational planning and predictive maintenance software, provides significant competitive advantages by minimizing downtime and reducing costs. Furthermore, companies are developing specialized equipment and techniques for challenging environments, including deepwater offshore and high-pressure, high-temperature (HPHT) wells. The market fit for these developments is strong, driven by operators' continuous pursuit of cost reduction and production maximization.
Report Scope & Segmentation Analysis
This report provides a comprehensive analysis of the Integrated Well Services market, covering the period from 2019 to 2033, with a base year of 2025. The market is segmented based on Application, Type, and Region.
Application Segmentation:
- Onshore: This segment includes all well services performed on land-based operations. Projections indicate continued strong growth, driven by ongoing exploration and production activities, particularly in North America and Asia. The market size is estimated to be over $100 billion by 2033, with a CAGR of approximately 4.0%.
- Offshore: This segment encompasses all well services conducted in marine environments, including shallow and deepwater operations. It is characterized by high-value projects and significant technological investment. The market size is projected to reach approximately $50 billion by 2033, with a CAGR of around 5.0%, driven by deepwater exploration.
Type Segmentation:
- Conventional: This segment covers traditional oil and gas wells. While mature, it still represents a substantial market share, focusing on optimization and incremental production. The market size is estimated at $80 billion by 2033, with a CAGR of approximately 3.5%.
- Unconventional: This segment includes services for shale gas, tight oil, and other unconventional resources. It is the fastest-growing segment due to technological advancements like horizontal drilling and hydraulic fracturing. The market size is projected to reach $70 billion by 2033, with a CAGR of over 5.5%.
- Others: This category includes specialized services not fitting into conventional or unconventional categories, such as geothermal or CO2 sequestration wells, representing a smaller but emerging segment with potential for future growth.
Key Drivers of Integrated Well Services Growth
The growth of the Integrated Well Services market is propelled by several key factors. Technological advancements, particularly in digital solutions like AI, machine learning, and IoT, are enhancing operational efficiency, predictive maintenance, and safety protocols, driving adoption across onshore and offshore operations. Increasing global energy demand, coupled with the need to access complex and unconventional reserves, is a primary economic driver, necessitating sophisticated drilling and completion techniques. Furthermore, favorable regulatory frameworks in certain regions, aimed at boosting domestic energy production and ensuring environmental compliance, create a conducive environment for service providers. The pursuit of cost optimization by oil and gas operators is also a significant catalyst, as integrated services offer economies of scale and streamlined project management.
Challenges in the Integrated Well Services Sector
Despite robust growth, the Integrated Well Services sector faces several challenges. Stringent regulatory hurdles, especially concerning environmental protection and safety standards in offshore operations, can increase compliance costs and operational complexity. Supply chain disruptions and geopolitical instability can impact the availability of essential materials and equipment, leading to project delays and cost overruns. Volatile commodity prices pose an inherent risk, as lower oil and gas prices can lead to reduced exploration and production budgets, consequently impacting demand for well services. Intense competition from both established players and emerging regional service providers can put pressure on profit margins. The need for continuous investment in expensive technology and skilled labor also presents a financial challenge.
Emerging Opportunities in Integrated Well Services
The Integrated Well Services market is ripe with emerging opportunities. The increasing focus on decarbonization and energy transition is creating demand for services related to carbon capture, utilization, and storage (CCUS) wells, as well as geothermal energy extraction. The digitalization of operations continues to offer significant opportunities for innovation in areas like AI-powered reservoir analysis, automated drilling, and remote operational monitoring. The development of new frontiers in exploration, such as ultra-deepwater and Arctic regions, requires specialized, integrated solutions that offer significant growth potential. Furthermore, the growing emphasis on well integrity and decommissioning services as mature fields are phased out presents a long-term opportunity for service providers.
Leading Players in the Integrated Well Services Market
- Baker Hughes
- Weatherford International
- Schlumberger Limited
- Superior Energy Services
- Transocean Limited
- Halliburton
- Anton Oilfield Services
- Petroking Oilfield Services
- Shandong Rongxing Petroleum Engineering Co., Ltd.
- Jerry Energy Services Co., Ltd.
- Zhongman Petroleum
Key Developments in Integrated Well Services Industry
- January 2024: Schlumberger Limited announced a strategic partnership with a leading technology firm to develop AI-driven solutions for enhanced reservoir characterization, aiming to improve drilling accuracy by 15%.
- November 2023: Baker Hughes launched a new suite of advanced drilling fluid additives designed to reduce environmental impact and improve wellbore stability in unconventional plays.
- September 2023: Halliburton completed a significant acquisition of a specialized completion technology company, expanding its portfolio for unconventional well completions, valued at approximately $300 million.
- July 2023: Weatherford International announced the successful deployment of its automated drilling control system on a major offshore project, reducing drilling time by 20%.
- April 2023: Transocean Limited secured new long-term contracts for its ultra-deepwater drillships, signaling continued investment in offshore exploration in the Gulf of Mexico.
- February 2023: Superior Energy Services announced the divestiture of its non-core assets, focusing on its integrated well intervention and completion services.
- December 2022: Anton Oilfield Services expanded its operations into a new market in Southeast Asia, focusing on providing integrated drilling and completion services.
- October 2022: Petroking Oilfield Services announced a technological breakthrough in sand control technologies for offshore wells.
- August 2022: Shandong Rongxing Petroleum Engineering Co., Ltd. reported a significant increase in its market share for onshore drilling services in its domestic market.
- June 2022: Jerry Energy Services Co., Ltd. partnered with a research institution to develop next-generation downhole sensing technologies.
- March 2022: Zhongman Petroleum announced the successful completion of a challenging high-pressure, high-temperature (HPHT) well using its integrated drilling services.
- January 2021: Global regulatory bodies introduced enhanced safety protocols for offshore well construction, driving demand for integrated service providers capable of meeting stringent compliance requirements.
Strategic Outlook for Integrated Well Services Market
The strategic outlook for the Integrated Well Services market remains exceptionally positive, driven by sustained global energy demand and ongoing technological innovation. Future growth will be significantly influenced by the industry's ability to adapt to the energy transition, with opportunities emerging in CCUS and geothermal services. The continued digitalization of operations will be a critical growth catalyst, enhancing efficiency and predictive capabilities. Companies that can offer comprehensive, technologically advanced, and environmentally responsible solutions across both onshore and offshore segments, while effectively managing volatile market conditions and regulatory landscapes, are poised for sustained success and market leadership. Strategic alliances and M&A will continue to be important for expanding service portfolios and market reach.
Integrated Well Services Segmentation
-
1. Application
- 1.1. Onshore
- 1.2. Offshore
-
2. Type
- 2.1. Conventional
- 2.2. Unconventional
- 2.3. Others
Integrated Well Services Segmentation By Geography
-
1. North America
- 1.1. United States
- 1.2. Canada
- 1.3. Mexico
-
2. South America
- 2.1. Brazil
- 2.2. Argentina
- 2.3. Rest of South America
-
3. Europe
- 3.1. United Kingdom
- 3.2. Germany
- 3.3. France
- 3.4. Italy
- 3.5. Spain
- 3.6. Russia
- 3.7. Benelux
- 3.8. Nordics
- 3.9. Rest of Europe
-
4. Middle East & Africa
- 4.1. Turkey
- 4.2. Israel
- 4.3. GCC
- 4.4. North Africa
- 4.5. South Africa
- 4.6. Rest of Middle East & Africa
-
5. Asia Pacific
- 5.1. China
- 5.2. India
- 5.3. Japan
- 5.4. South Korea
- 5.5. ASEAN
- 5.6. Oceania
- 5.7. Rest of Asia Pacific
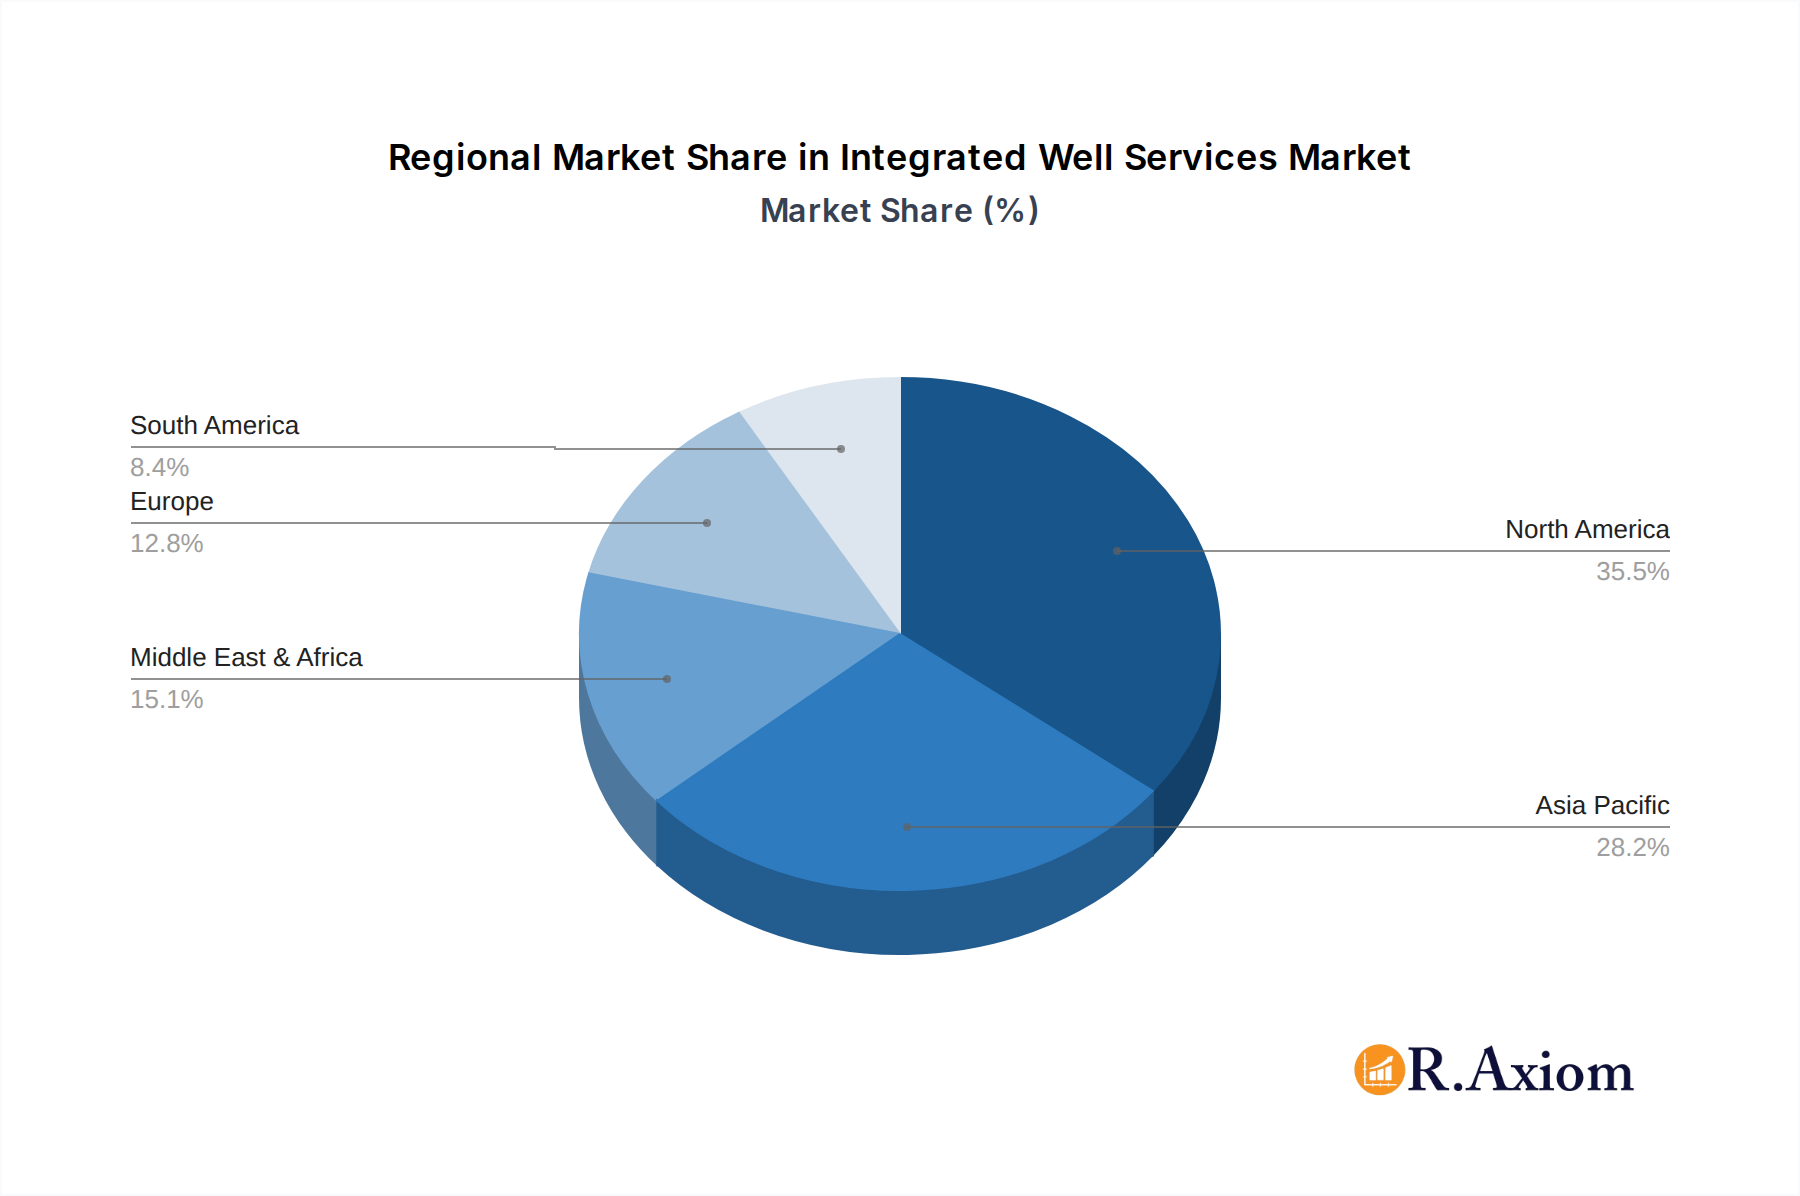
Integrated Well Services Regional Market Share
Geographic Coverage of Integrated Well Services
Integrated Well Services REPORT HIGHLIGHTS
| Aspects | Details |
|---|---|
| Study Period | 2020-2034 |
| Base Year | 2025 |
| Estimated Year | 2026 |
| Forecast Period | 2026-2034 |
| Historical Period | 2020-2025 |
| Growth Rate | CAGR of 6.1% from 2020-2034 |
| Segmentation |
|
Table of Contents
- 1. Introduction
- 1.1. Research Scope
- 1.2. Market Segmentation
- 1.3. Research Objective
- 1.4. Definitions and Assumptions
- 2. Executive Summary
- 2.1. Market Snapshot
- 3. Market Dynamics
- 3.1. Market Drivers
- 3.2. Market Restrains
- 3.3. Market Trends
- 3.4. Market Opportunities
- 4. Market Factor Analysis
- 4.1. Porters Five Forces
- 4.1.1. Bargaining Power of Suppliers
- 4.1.2. Bargaining Power of Buyers
- 4.1.3. Threat of New Entrants
- 4.1.4. Threat of Substitutes
- 4.1.5. Competitive Rivalry
- 4.2. PESTEL analysis
- 4.3. BCG Analysis
- 4.3.1. Stars (High Growth, High Market Share)
- 4.3.2. Cash Cows (Low Growth, High Market Share)
- 4.3.3. Question Mark (High Growth, Low Market Share)
- 4.3.4. Dogs (Low Growth, Low Market Share)
- 4.4. Ansoff Matrix Analysis
- 4.5. Supply Chain Analysis
- 4.6. Regulatory Landscape
- 4.7. Current Market Potential and Opportunity Assessment (TAM–SAM–SOM Framework)
- 4.8. RAX Analyst Note
- 4.1. Porters Five Forces
- 5. Market Analysis, Insights and Forecast 2021-2033
- 5.1. Market Analysis, Insights and Forecast - by Application
- 5.1.1. Onshore
- 5.1.2. Offshore
- 5.2. Market Analysis, Insights and Forecast - by Type
- 5.2.1. Conventional
- 5.2.2. Unconventional
- 5.2.3. Others
- 5.3. Market Analysis, Insights and Forecast - by Region
- 5.3.1. North America
- 5.3.2. South America
- 5.3.3. Europe
- 5.3.4. Middle East & Africa
- 5.3.5. Asia Pacific
- 5.1. Market Analysis, Insights and Forecast - by Application
- 6. Global Integrated Well Services Analysis, Insights and Forecast, 2021-2033
- 6.1. Market Analysis, Insights and Forecast - by Application
- 6.1.1. Onshore
- 6.1.2. Offshore
- 6.2. Market Analysis, Insights and Forecast - by Type
- 6.2.1. Conventional
- 6.2.2. Unconventional
- 6.2.3. Others
- 6.1. Market Analysis, Insights and Forecast - by Application
- 7. North America Integrated Well Services Analysis, Insights and Forecast, 2020-2032
- 7.1. Market Analysis, Insights and Forecast - by Application
- 7.1.1. Onshore
- 7.1.2. Offshore
- 7.2. Market Analysis, Insights and Forecast - by Type
- 7.2.1. Conventional
- 7.2.2. Unconventional
- 7.2.3. Others
- 7.1. Market Analysis, Insights and Forecast - by Application
- 8. South America Integrated Well Services Analysis, Insights and Forecast, 2020-2032
- 8.1. Market Analysis, Insights and Forecast - by Application
- 8.1.1. Onshore
- 8.1.2. Offshore
- 8.2. Market Analysis, Insights and Forecast - by Type
- 8.2.1. Conventional
- 8.2.2. Unconventional
- 8.2.3. Others
- 8.1. Market Analysis, Insights and Forecast - by Application
- 9. Europe Integrated Well Services Analysis, Insights and Forecast, 2020-2032
- 9.1. Market Analysis, Insights and Forecast - by Application
- 9.1.1. Onshore
- 9.1.2. Offshore
- 9.2. Market Analysis, Insights and Forecast - by Type
- 9.2.1. Conventional
- 9.2.2. Unconventional
- 9.2.3. Others
- 9.1. Market Analysis, Insights and Forecast - by Application
- 10. Middle East & Africa Integrated Well Services Analysis, Insights and Forecast, 2020-2032
- 10.1. Market Analysis, Insights and Forecast - by Application
- 10.1.1. Onshore
- 10.1.2. Offshore
- 10.2. Market Analysis, Insights and Forecast - by Type
- 10.2.1. Conventional
- 10.2.2. Unconventional
- 10.2.3. Others
- 10.1. Market Analysis, Insights and Forecast - by Application
- 11. Asia Pacific Integrated Well Services Analysis, Insights and Forecast, 2020-2032
- 11.1. Market Analysis, Insights and Forecast - by Application
- 11.1.1. Onshore
- 11.1.2. Offshore
- 11.2. Market Analysis, Insights and Forecast - by Type
- 11.2.1. Conventional
- 11.2.2. Unconventional
- 11.2.3. Others
- 11.1. Market Analysis, Insights and Forecast - by Application
- 12. Competitive Analysis
- 12.1. Company Profiles
- 12.1.1 Baker Hughes
- 12.1.1.1. Company Overview
- 12.1.1.2. Products
- 12.1.1.3. Company Financials
- 12.1.1.4. SWOT Analysis
- 12.1.2 Weatherford International
- 12.1.2.1. Company Overview
- 12.1.2.2. Products
- 12.1.2.3. Company Financials
- 12.1.2.4. SWOT Analysis
- 12.1.3 Schlumberger Limited
- 12.1.3.1. Company Overview
- 12.1.3.2. Products
- 12.1.3.3. Company Financials
- 12.1.3.4. SWOT Analysis
- 12.1.4 Superior Energy Services
- 12.1.4.1. Company Overview
- 12.1.4.2. Products
- 12.1.4.3. Company Financials
- 12.1.4.4. SWOT Analysis
- 12.1.5 Transocean Limited
- 12.1.5.1. Company Overview
- 12.1.5.2. Products
- 12.1.5.3. Company Financials
- 12.1.5.4. SWOT Analysis
- 12.1.6 Halliburton
- 12.1.6.1. Company Overview
- 12.1.6.2. Products
- 12.1.6.3. Company Financials
- 12.1.6.4. SWOT Analysis
- 12.1.7 Anton Oilfield Services
- 12.1.7.1. Company Overview
- 12.1.7.2. Products
- 12.1.7.3. Company Financials
- 12.1.7.4. SWOT Analysis
- 12.1.8 Petroking Oilfield Services
- 12.1.8.1. Company Overview
- 12.1.8.2. Products
- 12.1.8.3. Company Financials
- 12.1.8.4. SWOT Analysis
- 12.1.9 Shandong Rongxing Petroleum Engineering Co. Ltd.
- 12.1.9.1. Company Overview
- 12.1.9.2. Products
- 12.1.9.3. Company Financials
- 12.1.9.4. SWOT Analysis
- 12.1.10 Jerry Energy Services Co. Ltd.
- 12.1.10.1. Company Overview
- 12.1.10.2. Products
- 12.1.10.3. Company Financials
- 12.1.10.4. SWOT Analysis
- 12.1.11 Zhongman Petroleum
- 12.1.11.1. Company Overview
- 12.1.11.2. Products
- 12.1.11.3. Company Financials
- 12.1.11.4. SWOT Analysis
- 12.1.1 Baker Hughes
- 12.2. Market Entropy
- 12.2.1 Company's Key Areas Served
- 12.2.2 Recent Developments
- 12.3. Company Market Share Analysis 2025
- 12.3.1 Top 5 Companies Market Share Analysis
- 12.3.2 Top 3 Companies Market Share Analysis
- 12.4. List of Potential Customers
- 13. Research Methodology
List of Figures
- Figure 1: Global Integrated Well Services Revenue Breakdown (million, %) by Region 2025 & 2033
- Figure 2: North America Integrated Well Services Revenue (million), by Application 2025 & 2033
- Figure 3: North America Integrated Well Services Revenue Share (%), by Application 2025 & 2033
- Figure 4: North America Integrated Well Services Revenue (million), by Type 2025 & 2033
- Figure 5: North America Integrated Well Services Revenue Share (%), by Type 2025 & 2033
- Figure 6: North America Integrated Well Services Revenue (million), by Country 2025 & 2033
- Figure 7: North America Integrated Well Services Revenue Share (%), by Country 2025 & 2033
- Figure 8: South America Integrated Well Services Revenue (million), by Application 2025 & 2033
- Figure 9: South America Integrated Well Services Revenue Share (%), by Application 2025 & 2033
- Figure 10: South America Integrated Well Services Revenue (million), by Type 2025 & 2033
- Figure 11: South America Integrated Well Services Revenue Share (%), by Type 2025 & 2033
- Figure 12: South America Integrated Well Services Revenue (million), by Country 2025 & 2033
- Figure 13: South America Integrated Well Services Revenue Share (%), by Country 2025 & 2033
- Figure 14: Europe Integrated Well Services Revenue (million), by Application 2025 & 2033
- Figure 15: Europe Integrated Well Services Revenue Share (%), by Application 2025 & 2033
- Figure 16: Europe Integrated Well Services Revenue (million), by Type 2025 & 2033
- Figure 17: Europe Integrated Well Services Revenue Share (%), by Type 2025 & 2033
- Figure 18: Europe Integrated Well Services Revenue (million), by Country 2025 & 2033
- Figure 19: Europe Integrated Well Services Revenue Share (%), by Country 2025 & 2033
- Figure 20: Middle East & Africa Integrated Well Services Revenue (million), by Application 2025 & 2033
- Figure 21: Middle East & Africa Integrated Well Services Revenue Share (%), by Application 2025 & 2033
- Figure 22: Middle East & Africa Integrated Well Services Revenue (million), by Type 2025 & 2033
- Figure 23: Middle East & Africa Integrated Well Services Revenue Share (%), by Type 2025 & 2033
- Figure 24: Middle East & Africa Integrated Well Services Revenue (million), by Country 2025 & 2033
- Figure 25: Middle East & Africa Integrated Well Services Revenue Share (%), by Country 2025 & 2033
- Figure 26: Asia Pacific Integrated Well Services Revenue (million), by Application 2025 & 2033
- Figure 27: Asia Pacific Integrated Well Services Revenue Share (%), by Application 2025 & 2033
- Figure 28: Asia Pacific Integrated Well Services Revenue (million), by Type 2025 & 2033
- Figure 29: Asia Pacific Integrated Well Services Revenue Share (%), by Type 2025 & 2033
- Figure 30: Asia Pacific Integrated Well Services Revenue (million), by Country 2025 & 2033
- Figure 31: Asia Pacific Integrated Well Services Revenue Share (%), by Country 2025 & 2033
List of Tables
- Table 1: Global Integrated Well Services Revenue million Forecast, by Application 2020 & 2033
- Table 2: Global Integrated Well Services Revenue million Forecast, by Type 2020 & 2033
- Table 3: Global Integrated Well Services Revenue million Forecast, by Region 2020 & 2033
- Table 4: Global Integrated Well Services Revenue million Forecast, by Application 2020 & 2033
- Table 5: Global Integrated Well Services Revenue million Forecast, by Type 2020 & 2033
- Table 6: Global Integrated Well Services Revenue million Forecast, by Country 2020 & 2033
- Table 7: United States Integrated Well Services Revenue (million) Forecast, by Application 2020 & 2033
- Table 8: Canada Integrated Well Services Revenue (million) Forecast, by Application 2020 & 2033
- Table 9: Mexico Integrated Well Services Revenue (million) Forecast, by Application 2020 & 2033
- Table 10: Global Integrated Well Services Revenue million Forecast, by Application 2020 & 2033
- Table 11: Global Integrated Well Services Revenue million Forecast, by Type 2020 & 2033
- Table 12: Global Integrated Well Services Revenue million Forecast, by Country 2020 & 2033
- Table 13: Brazil Integrated Well Services Revenue (million) Forecast, by Application 2020 & 2033
- Table 14: Argentina Integrated Well Services Revenue (million) Forecast, by Application 2020 & 2033
- Table 15: Rest of South America Integrated Well Services Revenue (million) Forecast, by Application 2020 & 2033
- Table 16: Global Integrated Well Services Revenue million Forecast, by Application 2020 & 2033
- Table 17: Global Integrated Well Services Revenue million Forecast, by Type 2020 & 2033
- Table 18: Global Integrated Well Services Revenue million Forecast, by Country 2020 & 2033
- Table 19: United Kingdom Integrated Well Services Revenue (million) Forecast, by Application 2020 & 2033
- Table 20: Germany Integrated Well Services Revenue (million) Forecast, by Application 2020 & 2033
- Table 21: France Integrated Well Services Revenue (million) Forecast, by Application 2020 & 2033
- Table 22: Italy Integrated Well Services Revenue (million) Forecast, by Application 2020 & 2033
- Table 23: Spain Integrated Well Services Revenue (million) Forecast, by Application 2020 & 2033
- Table 24: Russia Integrated Well Services Revenue (million) Forecast, by Application 2020 & 2033
- Table 25: Benelux Integrated Well Services Revenue (million) Forecast, by Application 2020 & 2033
- Table 26: Nordics Integrated Well Services Revenue (million) Forecast, by Application 2020 & 2033
- Table 27: Rest of Europe Integrated Well Services Revenue (million) Forecast, by Application 2020 & 2033
- Table 28: Global Integrated Well Services Revenue million Forecast, by Application 2020 & 2033
- Table 29: Global Integrated Well Services Revenue million Forecast, by Type 2020 & 2033
- Table 30: Global Integrated Well Services Revenue million Forecast, by Country 2020 & 2033
- Table 31: Turkey Integrated Well Services Revenue (million) Forecast, by Application 2020 & 2033
- Table 32: Israel Integrated Well Services Revenue (million) Forecast, by Application 2020 & 2033
- Table 33: GCC Integrated Well Services Revenue (million) Forecast, by Application 2020 & 2033
- Table 34: North Africa Integrated Well Services Revenue (million) Forecast, by Application 2020 & 2033
- Table 35: South Africa Integrated Well Services Revenue (million) Forecast, by Application 2020 & 2033
- Table 36: Rest of Middle East & Africa Integrated Well Services Revenue (million) Forecast, by Application 2020 & 2033
- Table 37: Global Integrated Well Services Revenue million Forecast, by Application 2020 & 2033
- Table 38: Global Integrated Well Services Revenue million Forecast, by Type 2020 & 2033
- Table 39: Global Integrated Well Services Revenue million Forecast, by Country 2020 & 2033
- Table 40: China Integrated Well Services Revenue (million) Forecast, by Application 2020 & 2033
- Table 41: India Integrated Well Services Revenue (million) Forecast, by Application 2020 & 2033
- Table 42: Japan Integrated Well Services Revenue (million) Forecast, by Application 2020 & 2033
- Table 43: South Korea Integrated Well Services Revenue (million) Forecast, by Application 2020 & 2033
- Table 44: ASEAN Integrated Well Services Revenue (million) Forecast, by Application 2020 & 2033
- Table 45: Oceania Integrated Well Services Revenue (million) Forecast, by Application 2020 & 2033
- Table 46: Rest of Asia Pacific Integrated Well Services Revenue (million) Forecast, by Application 2020 & 2033
Frequently Asked Questions
1. What is the projected Compound Annual Growth Rate (CAGR) of the Integrated Well Services?
The projected CAGR is approximately 6.1%.
2. Which companies are prominent players in the Integrated Well Services?
Key companies in the market include Baker Hughes, Weatherford International, Schlumberger Limited, Superior Energy Services, Transocean Limited, Halliburton, Anton Oilfield Services, Petroking Oilfield Services, Shandong Rongxing Petroleum Engineering Co., Ltd., Jerry Energy Services Co., Ltd., Zhongman Petroleum.
3. What are the main segments of the Integrated Well Services?
The market segments include Application, Type.
4. Can you provide details about the market size?
The market size is estimated to be USD 6424 million as of 2022.
5. What are some drivers contributing to market growth?
N/A
6. What are the notable trends driving market growth?
N/A
7. Are there any restraints impacting market growth?
N/A
8. Can you provide examples of recent developments in the market?
N/A
9. What pricing options are available for accessing the report?
Pricing options include single-user, multi-user, and enterprise licenses priced at USD 2900.00, USD 4350.00, and USD 5800.00 respectively.
10. Is the market size provided in terms of value or volume?
The market size is provided in terms of value, measured in million.
11. Are there any specific market keywords associated with the report?
Yes, the market keyword associated with the report is "Integrated Well Services," which aids in identifying and referencing the specific market segment covered.
12. How do I determine which pricing option suits my needs best?
The pricing options vary based on user requirements and access needs. Individual users may opt for single-user licenses, while businesses requiring broader access may choose multi-user or enterprise licenses for cost-effective access to the report.
13. Are there any additional resources or data provided in the Integrated Well Services report?
While the report offers comprehensive insights, it's advisable to review the specific contents or supplementary materials provided to ascertain if additional resources or data are available.
14. How can I stay updated on further developments or reports in the Integrated Well Services?
To stay informed about further developments, trends, and reports in the Integrated Well Services, consider subscribing to industry newsletters, following relevant companies and organizations, or regularly checking reputable industry news sources and publications.
Methodology
Step 1 - Identification of Relevant Samples Size from Population Database


Step 2 - Approaches for Defining Global Market Size (Value, Volume* & Price*)

Note*: In applicable scenarios
Step 3 - Data Sources
Primary Research
- Web Analytics
- Survey Reports
- Research Institute
- Latest Research Reports
- Opinion Leaders
Secondary Research
- Annual Reports
- White Paper
- Latest Press Release
- Industry Association
- Paid Database
- Investor Presentations

Step 4 - Data Triangulation
Involves using different sources of information in order to increase the validity of a study
These sources are likely to be stakeholders in a program - participants, other researchers, program staff, other community members, and so on.
Then we put all data in single framework & apply various statistical tools to find out the dynamic on the market.
During the analysis stage, feedback from the stakeholder groups would be compared to determine areas of agreement as well as areas of divergence