
Key Insights
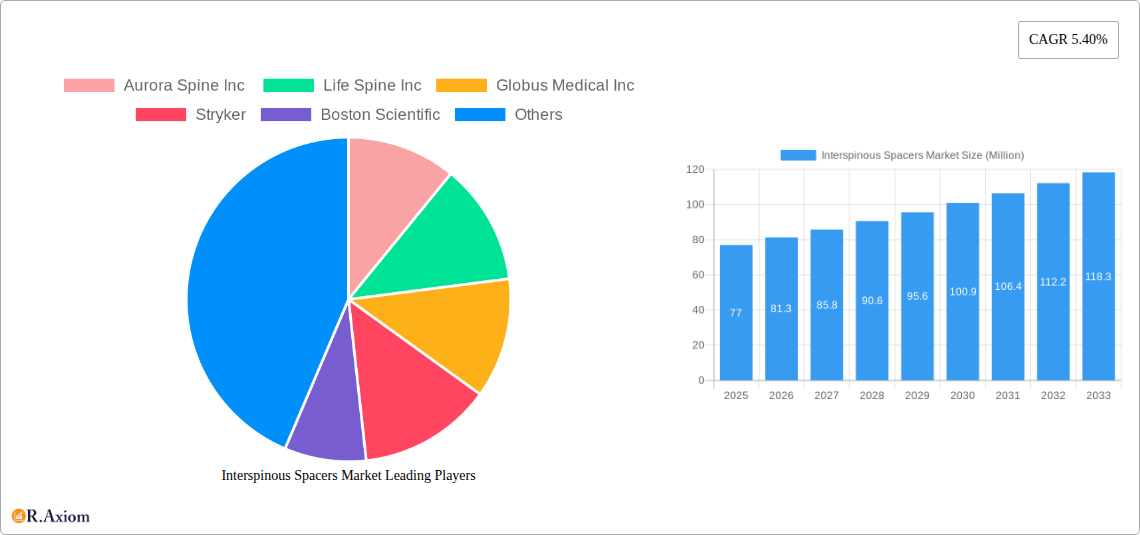
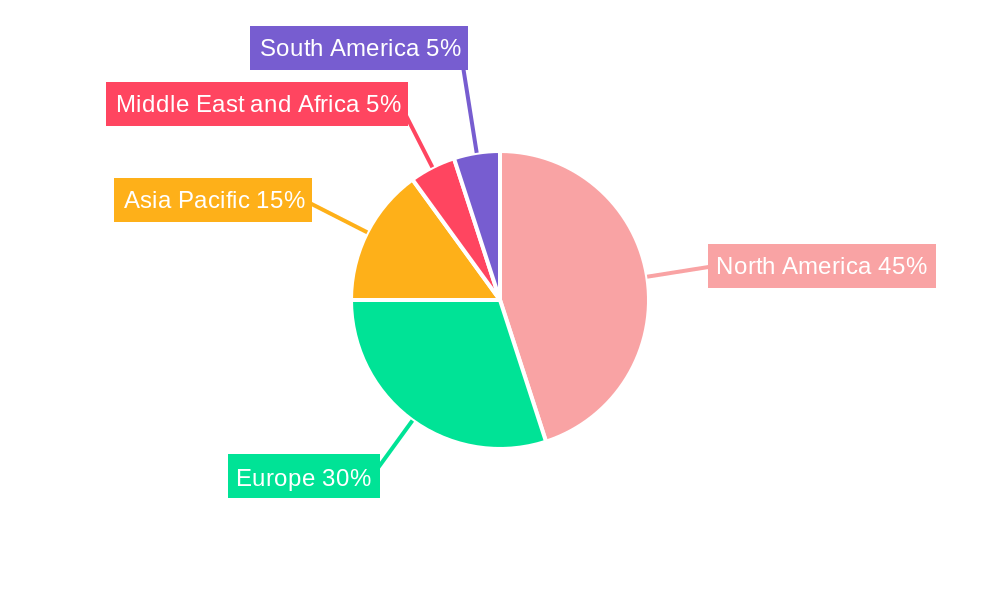
The interspinous spacers market, valued at $77 million in 2025, is projected to experience robust growth, driven by the rising prevalence of degenerative spine diseases like lumbar spinal stenosis and degenerative disc disease. This growth is further fueled by the increasing adoption of minimally invasive surgical techniques, a preference for faster recovery times among patients, and technological advancements leading to improved spacer designs offering enhanced stability and functionality. The market is segmented by application (lumbar spinal stenosis, degenerative disc diseases, and others), end-user (hospitals, orthopedic clinics, ambulatory surgical centers), and type (static and dynamic spacers). North America currently holds a significant market share, owing to high healthcare expenditure, advanced medical infrastructure, and a large geriatric population susceptible to spinal disorders. However, Asia-Pacific is expected to witness the fastest growth rate during the forecast period (2025-2033) due to increasing awareness about minimally invasive spine surgeries, rising disposable incomes, and expanding healthcare infrastructure. While the market faces restraints such as the potential for complications, high procedure costs, and the availability of alternative treatments, the overall growth trajectory remains positive, driven by an aging global population and the increasing demand for effective, less-invasive spine surgery solutions. Key players like Aurora Spine Inc., Life Spine Inc., Globus Medical Inc., and Stryker are actively involved in developing innovative products and expanding their market presence.
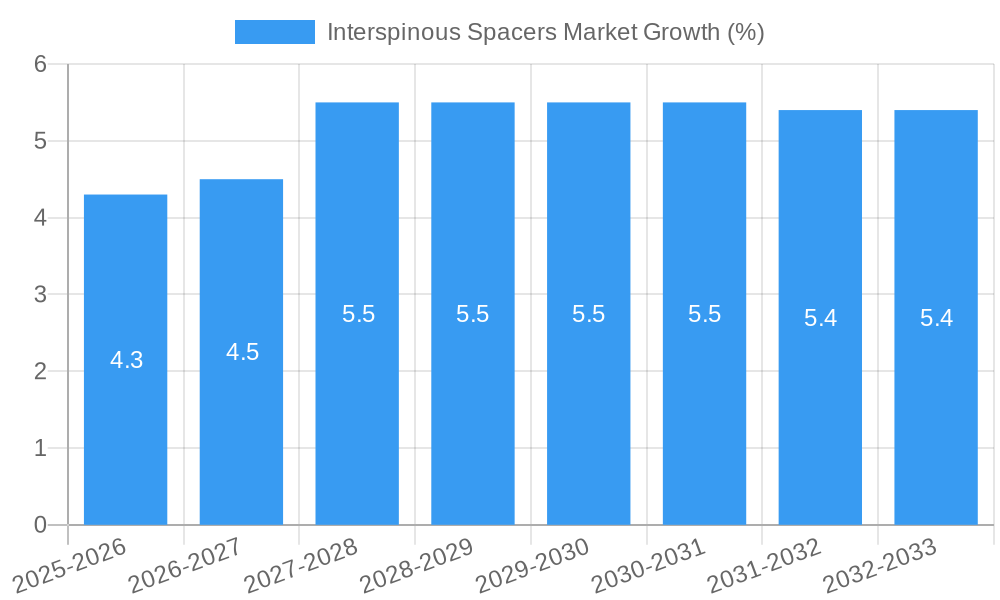
The competitive landscape is characterized by a mix of established players and emerging companies striving to innovate in material science, design, and surgical techniques. Strategic partnerships, mergers, and acquisitions are expected to shape the market dynamics in the coming years. The market's future growth is inextricably linked to continued research and development focusing on improving the efficacy and safety of interspinous spacers, thereby expanding their application across a wider patient population. Furthermore, regulatory approvals and reimbursement policies play a crucial role in influencing market penetration and overall growth. The projected Compound Annual Growth Rate (CAGR) of 5.40% suggests a significant increase in market value by 2033, reaching an estimated value exceeding $130 million, based on consistent growth driven by the factors mentioned above.
Interspinous Spacers Market: A Comprehensive Report (2019-2033)
This comprehensive report provides an in-depth analysis of the Interspinous Spacers Market, offering invaluable insights for stakeholders, investors, and industry professionals. The report covers the period from 2019 to 2033, with 2025 as the base year and a forecast period spanning 2025-2033. The historical period analyzed is 2019-2024. The market is segmented by application, end-user, and type, providing a granular understanding of market dynamics. Key players, including Aurora Spine Inc, Life Spine Inc, Globus Medical Inc, Stryker, Boston Scientific, Surgalign Spine Technologies Inc, Johnson & Johnson, ATEC Spine Inc, NuVasive Inc, Zimmer Biomet Holdings, Inc, and others, are profiled, offering competitive landscaping and strategic insights. The report quantifies market size in Millions.
Interspinous Spacers Market Market Concentration & Innovation
The Interspinous Spacers Market exhibits a moderately concentrated landscape, with a few major players holding significant market share. However, the presence of numerous smaller companies and startups indicates a competitive environment. Innovation is a crucial driver, with companies continually developing advanced spacer designs to improve efficacy and patient outcomes. Regulatory frameworks, particularly FDA approvals in the US, significantly influence market access and product adoption. The market witnesses continuous innovation in materials science, aiming for biocompatibility and enhanced osseointegration. Product substitutes, including traditional spinal fusion techniques, present competitive challenges. End-user trends, such as a preference for minimally invasive procedures and shorter hospital stays, fuel demand for advanced interspinous spacers. M&A activity has been moderate, with deal values ranging from xx Million to xx Million in recent years, primarily focusing on expanding product portfolios and geographical reach.
- Market Share: Top 5 players account for approximately xx% of the market.
- M&A Activity: Significant deals include [mention specific deals and values if available, otherwise state "Data unavailable"].
- Innovation Focus: Biocompatible materials, minimally invasive techniques, enhanced stability.
Interspinous Spacers Market Industry Trends & Insights
The Interspinous Spacers Market is experiencing robust growth, with a projected CAGR of xx% during the forecast period (2025-2033). This growth is propelled by several factors. The rising prevalence of degenerative spinal conditions, such as lumbar spinal stenosis and degenerative disc disease, significantly fuels market expansion. Technological advancements, including the development of dynamic and minimally invasive spacers, improve surgical outcomes and patient satisfaction. Consumer preferences are shifting towards less-invasive procedures with faster recovery times. The competitive landscape is dynamic, with established players and emerging companies vying for market share through product innovation and strategic partnerships. Market penetration is high in developed regions, but significant growth potential exists in developing markets. Technological disruptions, such as the integration of robotics and AI in spine surgery, are further influencing market growth.
Dominant Markets & Segments in Interspinous Spacers Market
The North American region currently dominates the Interspinous Spacers Market, driven by high healthcare expenditure, technological advancements, and a growing elderly population. Within the applications, Lumbar Spinal Stenosis and Degenerative Disc Diseases represent the largest segments, due to their high prevalence. Hospitals remain the primary end-users, although Ambulatory Surgical Centers are witnessing increasing adoption due to cost-effectiveness and patient convenience. Static (Non-compressible) spacers hold a larger market share compared to dynamic spacers, but the latter are gaining traction due to their potential for improved spinal motion preservation.
- Key Drivers for North American Dominance:
- High healthcare expenditure
- Advanced healthcare infrastructure
- High prevalence of target conditions
- Application Segment Analysis: Lumbar Spinal Stenosis is experiencing faster growth, driven by increased awareness and improved diagnostic capabilities.
- End-User Segment Analysis: Ambulatory Surgical Centers are experiencing faster growth due to their cost-effectiveness and patient convenience.
- Type Segment Analysis: Dynamic spacers show a higher growth rate compared to static ones.
Interspinous Spacers Market Product Developments
Recent years have seen significant advancements in interspinous spacer technology. The focus is on developing minimally invasive designs with improved biocompatibility, enhanced stability, and reduced postoperative complications. The introduction of dynamic spacers that allow for controlled spinal motion is a key development. These innovations aim to improve patient outcomes, shorten recovery times, and reduce the invasiveness of spinal surgeries. The market increasingly witnesses the integration of advanced materials, such as PEEK and titanium alloys, to enhance spacer longevity and biointegration.
Report Scope & Segmentation Analysis
This report comprehensively segments the Interspinous Spacers Market based on application (Lumbar Spinal Stenosis, Degenerative Disc Diseases, Others), end-user (Hospitals, Orthopedic Clinics, Ambulatory Surgical Centers), and type (Static (Non-compressible Spacers), Dynamic (Compressible Spacers)). Each segment’s market size, growth projections, and competitive dynamics are analyzed individually. For instance, the Lumbar Spinal Stenosis segment shows significant growth potential. Hospitals dominate the end-user segment, but Ambulatory Surgical Centers show faster growth. Dynamic spacers show strong growth potential, fueled by improvements in their design and performance.
Key Drivers of Interspinous Spacers Market Growth
The Interspinous Spacers Market is driven by several key factors. The increasing prevalence of age-related spinal disorders, such as degenerative disc disease and spinal stenosis, fuels market demand. Technological advancements leading to minimally invasive procedures and improved spacer designs contribute to the growth. Favorable regulatory environments, such as expedited FDA approvals for innovative devices, support market expansion. Growing awareness among patients and healthcare professionals regarding minimally invasive surgical techniques further enhances market growth.
Challenges in the Interspinous Spacers Market Sector
The Interspinous Spacers Market faces several challenges. High costs associated with surgical procedures and devices may limit market access in certain regions. The risk of complications and potential need for revision surgeries represent a significant challenge. Stringent regulatory approvals and reimbursement processes can hinder market entry and adoption. Intense competition among established players and emerging companies presents an ongoing challenge. Supply chain disruptions can affect the availability and pricing of devices.
Emerging Opportunities in Interspinous Spacers Market
Emerging opportunities include the development of novel biomaterials with enhanced osseointegration properties and the exploration of new minimally invasive surgical techniques. Expansion into untapped markets in developing countries with large populations suffering from spinal disorders presents a considerable opportunity. The integration of smart technologies, such as sensors and data analytics, into interspinous spacers could improve patient monitoring and outcomes. Furthermore, strategic collaborations between device manufacturers and healthcare providers can facilitate market growth.
Leading Players in the Interspinous Spacers Market Market
- Aurora Spine Inc
- Life Spine Inc
- Globus Medical Inc
- Stryker
- Boston Scientific
- Surgalign Spine Technologies Inc
- Johnson & Johnson
- ATEC Spine Inc
- NuVasive Inc
- Zimmer Biomet Holdings, Inc
- Others
Key Developments in Interspinous Spacers Market Industry
- December 2022: Life Spine, Inc. received USFDA clearance for its TruLift Lateral Expandable Spacer System and Lateral Plate System, offering rapid fixation and stabilization.
- December 2022: Life Spine, Inc. received USFDA clearance for its ProLift micro-Expandable Spacer System, minimizing tissue disruption and nerve retraction.
- July 2022: Globus Medical, Inc. announced the first spinal surgeries using its ExcelsiusGPS robotic system with the CREO MIS Stabilization System and RISE interbody spacers in Sydney, Australia.
Strategic Outlook for Interspinous Spacers Market Market
The Interspinous Spacers Market is poised for continued growth, driven by technological innovation, increasing prevalence of spinal disorders, and expanding market access in developing economies. The focus on minimally invasive procedures and improved device designs will further fuel market expansion. Strategic partnerships, acquisitions, and the development of innovative products will shape the competitive landscape. The integration of digital health technologies will enhance patient care and market penetration. The market presents significant opportunities for companies investing in research and development and strategic market expansion.
Interspinous Spacers Market Segmentation
-
1. Type
- 1.1. Static (Non-compressible Spacers)
- 1.2. Dynamic (Compressible Spacers)
-
2. Application
- 2.1. Lumbar Spinal Stenosis
- 2.2. Degenerative Disc Diseases
- 2.3. Others
-
3. End-User
- 3.1. Hospitals
- 3.2. Orthopedic Clinics
- 3.3. Ambulatory Surgical Centers
Interspinous Spacers Market Segmentation By Geography
-
1. North America
- 1.1. United States
- 1.2. Canada
- 1.3. Mexico
-
2. Europe
- 2.1. Germany
- 2.2. United Kingdom
- 2.3. France
- 2.4. Italy
- 2.5. Spain
- 2.6. Rest of Europe
-
3. Asia Pacific
- 3.1. China
- 3.2. Japan
- 3.3. India
- 3.4. Australia
- 3.5. South Korea
- 3.6. Rest of Asia Pacific
-
4. Middle East and Africa
- 4.1. GCC
- 4.2. South Africa
- 4.3. Rest of Middle East and Africa
-
5. South America
- 5.1. Brazil
- 5.2. Argentina
- 5.3. Rest of South America
Interspinous Spacers Market REPORT HIGHLIGHTS
| Aspects | Details |
|---|---|
| Study Period | 2019-2033 |
| Base Year | 2024 |
| Estimated Year | 2025 |
| Forecast Period | 2025-2033 |
| Historical Period | 2019-2024 |
| Growth Rate | CAGR of 5.40% from 2019-2033 |
| Segmentation |
|
Table of Contents
- 1. Introduction
- 1.1. Research Scope
- 1.2. Market Segmentation
- 1.3. Research Methodology
- 1.4. Definitions and Assumptions
- 2. Executive Summary
- 2.1. Introduction
- 3. Market Dynamics
- 3.1. Introduction
- 3.2. Market Drivers
- 3.2.1. Rising Demand for Minimally Invasive Solutions; Increasing Geriatric Population; Growth in Research and Technological Advancements in Interspinous Spacers
- 3.3. Market Restrains
- 3.3.1. Complications associated with Lumbar Spinal Fusion
- 3.4. Market Trends
- 3.4.1. Lumbar Spinal Stenosis Segment is Expected to Dominate the Market
- 4. Market Factor Analysis
- 4.1. Porters Five Forces
- 4.2. Supply/Value Chain
- 4.3. PESTEL analysis
- 4.4. Market Entropy
- 4.5. Patent/Trademark Analysis
- 5. Global Interspinous Spacers Market Analysis, Insights and Forecast, 2019-2031
- 5.1. Market Analysis, Insights and Forecast - by Type
- 5.1.1. Static (Non-compressible Spacers)
- 5.1.2. Dynamic (Compressible Spacers)
- 5.2. Market Analysis, Insights and Forecast - by Application
- 5.2.1. Lumbar Spinal Stenosis
- 5.2.2. Degenerative Disc Diseases
- 5.2.3. Others
- 5.3. Market Analysis, Insights and Forecast - by End-User
- 5.3.1. Hospitals
- 5.3.2. Orthopedic Clinics
- 5.3.3. Ambulatory Surgical Centers
- 5.4. Market Analysis, Insights and Forecast - by Region
- 5.4.1. North America
- 5.4.2. Europe
- 5.4.3. Asia Pacific
- 5.4.4. Middle East and Africa
- 5.4.5. South America
- 5.1. Market Analysis, Insights and Forecast - by Type
- 6. North America Interspinous Spacers Market Analysis, Insights and Forecast, 2019-2031
- 6.1. Market Analysis, Insights and Forecast - by Type
- 6.1.1. Static (Non-compressible Spacers)
- 6.1.2. Dynamic (Compressible Spacers)
- 6.2. Market Analysis, Insights and Forecast - by Application
- 6.2.1. Lumbar Spinal Stenosis
- 6.2.2. Degenerative Disc Diseases
- 6.2.3. Others
- 6.3. Market Analysis, Insights and Forecast - by End-User
- 6.3.1. Hospitals
- 6.3.2. Orthopedic Clinics
- 6.3.3. Ambulatory Surgical Centers
- 6.1. Market Analysis, Insights and Forecast - by Type
- 7. Europe Interspinous Spacers Market Analysis, Insights and Forecast, 2019-2031
- 7.1. Market Analysis, Insights and Forecast - by Type
- 7.1.1. Static (Non-compressible Spacers)
- 7.1.2. Dynamic (Compressible Spacers)
- 7.2. Market Analysis, Insights and Forecast - by Application
- 7.2.1. Lumbar Spinal Stenosis
- 7.2.2. Degenerative Disc Diseases
- 7.2.3. Others
- 7.3. Market Analysis, Insights and Forecast - by End-User
- 7.3.1. Hospitals
- 7.3.2. Orthopedic Clinics
- 7.3.3. Ambulatory Surgical Centers
- 7.1. Market Analysis, Insights and Forecast - by Type
- 8. Asia Pacific Interspinous Spacers Market Analysis, Insights and Forecast, 2019-2031
- 8.1. Market Analysis, Insights and Forecast - by Type
- 8.1.1. Static (Non-compressible Spacers)
- 8.1.2. Dynamic (Compressible Spacers)
- 8.2. Market Analysis, Insights and Forecast - by Application
- 8.2.1. Lumbar Spinal Stenosis
- 8.2.2. Degenerative Disc Diseases
- 8.2.3. Others
- 8.3. Market Analysis, Insights and Forecast - by End-User
- 8.3.1. Hospitals
- 8.3.2. Orthopedic Clinics
- 8.3.3. Ambulatory Surgical Centers
- 8.1. Market Analysis, Insights and Forecast - by Type
- 9. Middle East and Africa Interspinous Spacers Market Analysis, Insights and Forecast, 2019-2031
- 9.1. Market Analysis, Insights and Forecast - by Type
- 9.1.1. Static (Non-compressible Spacers)
- 9.1.2. Dynamic (Compressible Spacers)
- 9.2. Market Analysis, Insights and Forecast - by Application
- 9.2.1. Lumbar Spinal Stenosis
- 9.2.2. Degenerative Disc Diseases
- 9.2.3. Others
- 9.3. Market Analysis, Insights and Forecast - by End-User
- 9.3.1. Hospitals
- 9.3.2. Orthopedic Clinics
- 9.3.3. Ambulatory Surgical Centers
- 9.1. Market Analysis, Insights and Forecast - by Type
- 10. South America Interspinous Spacers Market Analysis, Insights and Forecast, 2019-2031
- 10.1. Market Analysis, Insights and Forecast - by Type
- 10.1.1. Static (Non-compressible Spacers)
- 10.1.2. Dynamic (Compressible Spacers)
- 10.2. Market Analysis, Insights and Forecast - by Application
- 10.2.1. Lumbar Spinal Stenosis
- 10.2.2. Degenerative Disc Diseases
- 10.2.3. Others
- 10.3. Market Analysis, Insights and Forecast - by End-User
- 10.3.1. Hospitals
- 10.3.2. Orthopedic Clinics
- 10.3.3. Ambulatory Surgical Centers
- 10.1. Market Analysis, Insights and Forecast - by Type
- 11. North America Interspinous Spacers Market Analysis, Insights and Forecast, 2019-2031
- 11.1. Market Analysis, Insights and Forecast - By Country/Sub-region
- 11.1.1 United States
- 11.1.2 Canada
- 11.1.3 Mexico
- 12. Europe Interspinous Spacers Market Analysis, Insights and Forecast, 2019-2031
- 12.1. Market Analysis, Insights and Forecast - By Country/Sub-region
- 12.1.1 Germany
- 12.1.2 United Kingdom
- 12.1.3 France
- 12.1.4 Italy
- 12.1.5 Spain
- 12.1.6 Rest of Europe
- 13. Asia Pacific Interspinous Spacers Market Analysis, Insights and Forecast, 2019-2031
- 13.1. Market Analysis, Insights and Forecast - By Country/Sub-region
- 13.1.1 China
- 13.1.2 Japan
- 13.1.3 India
- 13.1.4 Australia
- 13.1.5 South Korea
- 13.1.6 Rest of Asia Pacific
- 14. Middle East and Africa Interspinous Spacers Market Analysis, Insights and Forecast, 2019-2031
- 14.1. Market Analysis, Insights and Forecast - By Country/Sub-region
- 14.1.1 GCC
- 14.1.2 South Africa
- 14.1.3 Rest of Middle East and Africa
- 15. South America Interspinous Spacers Market Analysis, Insights and Forecast, 2019-2031
- 15.1. Market Analysis, Insights and Forecast - By Country/Sub-region
- 15.1.1 Brazil
- 15.1.2 Argentina
- 15.1.3 Rest of South America
- 16. Competitive Analysis
- 16.1. Global Market Share Analysis 2024
- 16.2. Company Profiles
- 16.2.1 Aurora Spine Inc
- 16.2.1.1. Overview
- 16.2.1.2. Products
- 16.2.1.3. SWOT Analysis
- 16.2.1.4. Recent Developments
- 16.2.1.5. Financials (Based on Availability)
- 16.2.2 Life Spine Inc
- 16.2.2.1. Overview
- 16.2.2.2. Products
- 16.2.2.3. SWOT Analysis
- 16.2.2.4. Recent Developments
- 16.2.2.5. Financials (Based on Availability)
- 16.2.3 Globus Medical Inc
- 16.2.3.1. Overview
- 16.2.3.2. Products
- 16.2.3.3. SWOT Analysis
- 16.2.3.4. Recent Developments
- 16.2.3.5. Financials (Based on Availability)
- 16.2.4 Stryker
- 16.2.4.1. Overview
- 16.2.4.2. Products
- 16.2.4.3. SWOT Analysis
- 16.2.4.4. Recent Developments
- 16.2.4.5. Financials (Based on Availability)
- 16.2.5 Boston Scientific
- 16.2.5.1. Overview
- 16.2.5.2. Products
- 16.2.5.3. SWOT Analysis
- 16.2.5.4. Recent Developments
- 16.2.5.5. Financials (Based on Availability)
- 16.2.6 Surgalign Spine Technologies Inc
- 16.2.6.1. Overview
- 16.2.6.2. Products
- 16.2.6.3. SWOT Analysis
- 16.2.6.4. Recent Developments
- 16.2.6.5. Financials (Based on Availability)
- 16.2.7 Johnson & Johnson
- 16.2.7.1. Overview
- 16.2.7.2. Products
- 16.2.7.3. SWOT Analysis
- 16.2.7.4. Recent Developments
- 16.2.7.5. Financials (Based on Availability)
- 16.2.8 ATEC Spine Inc
- 16.2.8.1. Overview
- 16.2.8.2. Products
- 16.2.8.3. SWOT Analysis
- 16.2.8.4. Recent Developments
- 16.2.8.5. Financials (Based on Availability)
- 16.2.9 NuVasive Inc
- 16.2.9.1. Overview
- 16.2.9.2. Products
- 16.2.9.3. SWOT Analysis
- 16.2.9.4. Recent Developments
- 16.2.9.5. Financials (Based on Availability)
- 16.2.10 Boston Scientific
- 16.2.10.1. Overview
- 16.2.10.2. Products
- 16.2.10.3. SWOT Analysis
- 16.2.10.4. Recent Developments
- 16.2.10.5. Financials (Based on Availability)
- 16.2.11 Zimmer Biomet Holdings Inc
- 16.2.11.1. Overview
- 16.2.11.2. Products
- 16.2.11.3. SWOT Analysis
- 16.2.11.4. Recent Developments
- 16.2.11.5. Financials (Based on Availability)
- 16.2.12 Others
- 16.2.12.1. Overview
- 16.2.12.2. Products
- 16.2.12.3. SWOT Analysis
- 16.2.12.4. Recent Developments
- 16.2.12.5. Financials (Based on Availability)
- 16.2.1 Aurora Spine Inc
List of Figures
- Figure 1: Global Interspinous Spacers Market Revenue Breakdown (Million, %) by Region 2024 & 2032
- Figure 2: Global Interspinous Spacers Market Volume Breakdown (Piece, %) by Region 2024 & 2032
- Figure 3: North America Interspinous Spacers Market Revenue (Million), by Country 2024 & 2032
- Figure 4: North America Interspinous Spacers Market Volume (Piece), by Country 2024 & 2032
- Figure 5: North America Interspinous Spacers Market Revenue Share (%), by Country 2024 & 2032
- Figure 6: North America Interspinous Spacers Market Volume Share (%), by Country 2024 & 2032
- Figure 7: Europe Interspinous Spacers Market Revenue (Million), by Country 2024 & 2032
- Figure 8: Europe Interspinous Spacers Market Volume (Piece), by Country 2024 & 2032
- Figure 9: Europe Interspinous Spacers Market Revenue Share (%), by Country 2024 & 2032
- Figure 10: Europe Interspinous Spacers Market Volume Share (%), by Country 2024 & 2032
- Figure 11: Asia Pacific Interspinous Spacers Market Revenue (Million), by Country 2024 & 2032
- Figure 12: Asia Pacific Interspinous Spacers Market Volume (Piece), by Country 2024 & 2032
- Figure 13: Asia Pacific Interspinous Spacers Market Revenue Share (%), by Country 2024 & 2032
- Figure 14: Asia Pacific Interspinous Spacers Market Volume Share (%), by Country 2024 & 2032
- Figure 15: Middle East and Africa Interspinous Spacers Market Revenue (Million), by Country 2024 & 2032
- Figure 16: Middle East and Africa Interspinous Spacers Market Volume (Piece), by Country 2024 & 2032
- Figure 17: Middle East and Africa Interspinous Spacers Market Revenue Share (%), by Country 2024 & 2032
- Figure 18: Middle East and Africa Interspinous Spacers Market Volume Share (%), by Country 2024 & 2032
- Figure 19: South America Interspinous Spacers Market Revenue (Million), by Country 2024 & 2032
- Figure 20: South America Interspinous Spacers Market Volume (Piece), by Country 2024 & 2032
- Figure 21: South America Interspinous Spacers Market Revenue Share (%), by Country 2024 & 2032
- Figure 22: South America Interspinous Spacers Market Volume Share (%), by Country 2024 & 2032
- Figure 23: North America Interspinous Spacers Market Revenue (Million), by Type 2024 & 2032
- Figure 24: North America Interspinous Spacers Market Volume (Piece), by Type 2024 & 2032
- Figure 25: North America Interspinous Spacers Market Revenue Share (%), by Type 2024 & 2032
- Figure 26: North America Interspinous Spacers Market Volume Share (%), by Type 2024 & 2032
- Figure 27: North America Interspinous Spacers Market Revenue (Million), by Application 2024 & 2032
- Figure 28: North America Interspinous Spacers Market Volume (Piece), by Application 2024 & 2032
- Figure 29: North America Interspinous Spacers Market Revenue Share (%), by Application 2024 & 2032
- Figure 30: North America Interspinous Spacers Market Volume Share (%), by Application 2024 & 2032
- Figure 31: North America Interspinous Spacers Market Revenue (Million), by End-User 2024 & 2032
- Figure 32: North America Interspinous Spacers Market Volume (Piece), by End-User 2024 & 2032
- Figure 33: North America Interspinous Spacers Market Revenue Share (%), by End-User 2024 & 2032
- Figure 34: North America Interspinous Spacers Market Volume Share (%), by End-User 2024 & 2032
- Figure 35: North America Interspinous Spacers Market Revenue (Million), by Country 2024 & 2032
- Figure 36: North America Interspinous Spacers Market Volume (Piece), by Country 2024 & 2032
- Figure 37: North America Interspinous Spacers Market Revenue Share (%), by Country 2024 & 2032
- Figure 38: North America Interspinous Spacers Market Volume Share (%), by Country 2024 & 2032
- Figure 39: Europe Interspinous Spacers Market Revenue (Million), by Type 2024 & 2032
- Figure 40: Europe Interspinous Spacers Market Volume (Piece), by Type 2024 & 2032
- Figure 41: Europe Interspinous Spacers Market Revenue Share (%), by Type 2024 & 2032
- Figure 42: Europe Interspinous Spacers Market Volume Share (%), by Type 2024 & 2032
- Figure 43: Europe Interspinous Spacers Market Revenue (Million), by Application 2024 & 2032
- Figure 44: Europe Interspinous Spacers Market Volume (Piece), by Application 2024 & 2032
- Figure 45: Europe Interspinous Spacers Market Revenue Share (%), by Application 2024 & 2032
- Figure 46: Europe Interspinous Spacers Market Volume Share (%), by Application 2024 & 2032
- Figure 47: Europe Interspinous Spacers Market Revenue (Million), by End-User 2024 & 2032
- Figure 48: Europe Interspinous Spacers Market Volume (Piece), by End-User 2024 & 2032
- Figure 49: Europe Interspinous Spacers Market Revenue Share (%), by End-User 2024 & 2032
- Figure 50: Europe Interspinous Spacers Market Volume Share (%), by End-User 2024 & 2032
- Figure 51: Europe Interspinous Spacers Market Revenue (Million), by Country 2024 & 2032
- Figure 52: Europe Interspinous Spacers Market Volume (Piece), by Country 2024 & 2032
- Figure 53: Europe Interspinous Spacers Market Revenue Share (%), by Country 2024 & 2032
- Figure 54: Europe Interspinous Spacers Market Volume Share (%), by Country 2024 & 2032
- Figure 55: Asia Pacific Interspinous Spacers Market Revenue (Million), by Type 2024 & 2032
- Figure 56: Asia Pacific Interspinous Spacers Market Volume (Piece), by Type 2024 & 2032
- Figure 57: Asia Pacific Interspinous Spacers Market Revenue Share (%), by Type 2024 & 2032
- Figure 58: Asia Pacific Interspinous Spacers Market Volume Share (%), by Type 2024 & 2032
- Figure 59: Asia Pacific Interspinous Spacers Market Revenue (Million), by Application 2024 & 2032
- Figure 60: Asia Pacific Interspinous Spacers Market Volume (Piece), by Application 2024 & 2032
- Figure 61: Asia Pacific Interspinous Spacers Market Revenue Share (%), by Application 2024 & 2032
- Figure 62: Asia Pacific Interspinous Spacers Market Volume Share (%), by Application 2024 & 2032
- Figure 63: Asia Pacific Interspinous Spacers Market Revenue (Million), by End-User 2024 & 2032
- Figure 64: Asia Pacific Interspinous Spacers Market Volume (Piece), by End-User 2024 & 2032
- Figure 65: Asia Pacific Interspinous Spacers Market Revenue Share (%), by End-User 2024 & 2032
- Figure 66: Asia Pacific Interspinous Spacers Market Volume Share (%), by End-User 2024 & 2032
- Figure 67: Asia Pacific Interspinous Spacers Market Revenue (Million), by Country 2024 & 2032
- Figure 68: Asia Pacific Interspinous Spacers Market Volume (Piece), by Country 2024 & 2032
- Figure 69: Asia Pacific Interspinous Spacers Market Revenue Share (%), by Country 2024 & 2032
- Figure 70: Asia Pacific Interspinous Spacers Market Volume Share (%), by Country 2024 & 2032
- Figure 71: Middle East and Africa Interspinous Spacers Market Revenue (Million), by Type 2024 & 2032
- Figure 72: Middle East and Africa Interspinous Spacers Market Volume (Piece), by Type 2024 & 2032
- Figure 73: Middle East and Africa Interspinous Spacers Market Revenue Share (%), by Type 2024 & 2032
- Figure 74: Middle East and Africa Interspinous Spacers Market Volume Share (%), by Type 2024 & 2032
- Figure 75: Middle East and Africa Interspinous Spacers Market Revenue (Million), by Application 2024 & 2032
- Figure 76: Middle East and Africa Interspinous Spacers Market Volume (Piece), by Application 2024 & 2032
- Figure 77: Middle East and Africa Interspinous Spacers Market Revenue Share (%), by Application 2024 & 2032
- Figure 78: Middle East and Africa Interspinous Spacers Market Volume Share (%), by Application 2024 & 2032
- Figure 79: Middle East and Africa Interspinous Spacers Market Revenue (Million), by End-User 2024 & 2032
- Figure 80: Middle East and Africa Interspinous Spacers Market Volume (Piece), by End-User 2024 & 2032
- Figure 81: Middle East and Africa Interspinous Spacers Market Revenue Share (%), by End-User 2024 & 2032
- Figure 82: Middle East and Africa Interspinous Spacers Market Volume Share (%), by End-User 2024 & 2032
- Figure 83: Middle East and Africa Interspinous Spacers Market Revenue (Million), by Country 2024 & 2032
- Figure 84: Middle East and Africa Interspinous Spacers Market Volume (Piece), by Country 2024 & 2032
- Figure 85: Middle East and Africa Interspinous Spacers Market Revenue Share (%), by Country 2024 & 2032
- Figure 86: Middle East and Africa Interspinous Spacers Market Volume Share (%), by Country 2024 & 2032
- Figure 87: South America Interspinous Spacers Market Revenue (Million), by Type 2024 & 2032
- Figure 88: South America Interspinous Spacers Market Volume (Piece), by Type 2024 & 2032
- Figure 89: South America Interspinous Spacers Market Revenue Share (%), by Type 2024 & 2032
- Figure 90: South America Interspinous Spacers Market Volume Share (%), by Type 2024 & 2032
- Figure 91: South America Interspinous Spacers Market Revenue (Million), by Application 2024 & 2032
- Figure 92: South America Interspinous Spacers Market Volume (Piece), by Application 2024 & 2032
- Figure 93: South America Interspinous Spacers Market Revenue Share (%), by Application 2024 & 2032
- Figure 94: South America Interspinous Spacers Market Volume Share (%), by Application 2024 & 2032
- Figure 95: South America Interspinous Spacers Market Revenue (Million), by End-User 2024 & 2032
- Figure 96: South America Interspinous Spacers Market Volume (Piece), by End-User 2024 & 2032
- Figure 97: South America Interspinous Spacers Market Revenue Share (%), by End-User 2024 & 2032
- Figure 98: South America Interspinous Spacers Market Volume Share (%), by End-User 2024 & 2032
- Figure 99: South America Interspinous Spacers Market Revenue (Million), by Country 2024 & 2032
- Figure 100: South America Interspinous Spacers Market Volume (Piece), by Country 2024 & 2032
- Figure 101: South America Interspinous Spacers Market Revenue Share (%), by Country 2024 & 2032
- Figure 102: South America Interspinous Spacers Market Volume Share (%), by Country 2024 & 2032
List of Tables
- Table 1: Global Interspinous Spacers Market Revenue Million Forecast, by Region 2019 & 2032
- Table 2: Global Interspinous Spacers Market Volume Piece Forecast, by Region 2019 & 2032
- Table 3: Global Interspinous Spacers Market Revenue Million Forecast, by Type 2019 & 2032
- Table 4: Global Interspinous Spacers Market Volume Piece Forecast, by Type 2019 & 2032
- Table 5: Global Interspinous Spacers Market Revenue Million Forecast, by Application 2019 & 2032
- Table 6: Global Interspinous Spacers Market Volume Piece Forecast, by Application 2019 & 2032
- Table 7: Global Interspinous Spacers Market Revenue Million Forecast, by End-User 2019 & 2032
- Table 8: Global Interspinous Spacers Market Volume Piece Forecast, by End-User 2019 & 2032
- Table 9: Global Interspinous Spacers Market Revenue Million Forecast, by Region 2019 & 2032
- Table 10: Global Interspinous Spacers Market Volume Piece Forecast, by Region 2019 & 2032
- Table 11: Global Interspinous Spacers Market Revenue Million Forecast, by Country 2019 & 2032
- Table 12: Global Interspinous Spacers Market Volume Piece Forecast, by Country 2019 & 2032
- Table 13: United States Interspinous Spacers Market Revenue (Million) Forecast, by Application 2019 & 2032
- Table 14: United States Interspinous Spacers Market Volume (Piece) Forecast, by Application 2019 & 2032
- Table 15: Canada Interspinous Spacers Market Revenue (Million) Forecast, by Application 2019 & 2032
- Table 16: Canada Interspinous Spacers Market Volume (Piece) Forecast, by Application 2019 & 2032
- Table 17: Mexico Interspinous Spacers Market Revenue (Million) Forecast, by Application 2019 & 2032
- Table 18: Mexico Interspinous Spacers Market Volume (Piece) Forecast, by Application 2019 & 2032
- Table 19: Global Interspinous Spacers Market Revenue Million Forecast, by Country 2019 & 2032
- Table 20: Global Interspinous Spacers Market Volume Piece Forecast, by Country 2019 & 2032
- Table 21: Germany Interspinous Spacers Market Revenue (Million) Forecast, by Application 2019 & 2032
- Table 22: Germany Interspinous Spacers Market Volume (Piece) Forecast, by Application 2019 & 2032
- Table 23: United Kingdom Interspinous Spacers Market Revenue (Million) Forecast, by Application 2019 & 2032
- Table 24: United Kingdom Interspinous Spacers Market Volume (Piece) Forecast, by Application 2019 & 2032
- Table 25: France Interspinous Spacers Market Revenue (Million) Forecast, by Application 2019 & 2032
- Table 26: France Interspinous Spacers Market Volume (Piece) Forecast, by Application 2019 & 2032
- Table 27: Italy Interspinous Spacers Market Revenue (Million) Forecast, by Application 2019 & 2032
- Table 28: Italy Interspinous Spacers Market Volume (Piece) Forecast, by Application 2019 & 2032
- Table 29: Spain Interspinous Spacers Market Revenue (Million) Forecast, by Application 2019 & 2032
- Table 30: Spain Interspinous Spacers Market Volume (Piece) Forecast, by Application 2019 & 2032
- Table 31: Rest of Europe Interspinous Spacers Market Revenue (Million) Forecast, by Application 2019 & 2032
- Table 32: Rest of Europe Interspinous Spacers Market Volume (Piece) Forecast, by Application 2019 & 2032
- Table 33: Global Interspinous Spacers Market Revenue Million Forecast, by Country 2019 & 2032
- Table 34: Global Interspinous Spacers Market Volume Piece Forecast, by Country 2019 & 2032
- Table 35: China Interspinous Spacers Market Revenue (Million) Forecast, by Application 2019 & 2032
- Table 36: China Interspinous Spacers Market Volume (Piece) Forecast, by Application 2019 & 2032
- Table 37: Japan Interspinous Spacers Market Revenue (Million) Forecast, by Application 2019 & 2032
- Table 38: Japan Interspinous Spacers Market Volume (Piece) Forecast, by Application 2019 & 2032
- Table 39: India Interspinous Spacers Market Revenue (Million) Forecast, by Application 2019 & 2032
- Table 40: India Interspinous Spacers Market Volume (Piece) Forecast, by Application 2019 & 2032
- Table 41: Australia Interspinous Spacers Market Revenue (Million) Forecast, by Application 2019 & 2032
- Table 42: Australia Interspinous Spacers Market Volume (Piece) Forecast, by Application 2019 & 2032
- Table 43: South Korea Interspinous Spacers Market Revenue (Million) Forecast, by Application 2019 & 2032
- Table 44: South Korea Interspinous Spacers Market Volume (Piece) Forecast, by Application 2019 & 2032
- Table 45: Rest of Asia Pacific Interspinous Spacers Market Revenue (Million) Forecast, by Application 2019 & 2032
- Table 46: Rest of Asia Pacific Interspinous Spacers Market Volume (Piece) Forecast, by Application 2019 & 2032
- Table 47: Global Interspinous Spacers Market Revenue Million Forecast, by Country 2019 & 2032
- Table 48: Global Interspinous Spacers Market Volume Piece Forecast, by Country 2019 & 2032
- Table 49: GCC Interspinous Spacers Market Revenue (Million) Forecast, by Application 2019 & 2032
- Table 50: GCC Interspinous Spacers Market Volume (Piece) Forecast, by Application 2019 & 2032
- Table 51: South Africa Interspinous Spacers Market Revenue (Million) Forecast, by Application 2019 & 2032
- Table 52: South Africa Interspinous Spacers Market Volume (Piece) Forecast, by Application 2019 & 2032
- Table 53: Rest of Middle East and Africa Interspinous Spacers Market Revenue (Million) Forecast, by Application 2019 & 2032
- Table 54: Rest of Middle East and Africa Interspinous Spacers Market Volume (Piece) Forecast, by Application 2019 & 2032
- Table 55: Global Interspinous Spacers Market Revenue Million Forecast, by Country 2019 & 2032
- Table 56: Global Interspinous Spacers Market Volume Piece Forecast, by Country 2019 & 2032
- Table 57: Brazil Interspinous Spacers Market Revenue (Million) Forecast, by Application 2019 & 2032
- Table 58: Brazil Interspinous Spacers Market Volume (Piece) Forecast, by Application 2019 & 2032
- Table 59: Argentina Interspinous Spacers Market Revenue (Million) Forecast, by Application 2019 & 2032
- Table 60: Argentina Interspinous Spacers Market Volume (Piece) Forecast, by Application 2019 & 2032
- Table 61: Rest of South America Interspinous Spacers Market Revenue (Million) Forecast, by Application 2019 & 2032
- Table 62: Rest of South America Interspinous Spacers Market Volume (Piece) Forecast, by Application 2019 & 2032
- Table 63: Global Interspinous Spacers Market Revenue Million Forecast, by Type 2019 & 2032
- Table 64: Global Interspinous Spacers Market Volume Piece Forecast, by Type 2019 & 2032
- Table 65: Global Interspinous Spacers Market Revenue Million Forecast, by Application 2019 & 2032
- Table 66: Global Interspinous Spacers Market Volume Piece Forecast, by Application 2019 & 2032
- Table 67: Global Interspinous Spacers Market Revenue Million Forecast, by End-User 2019 & 2032
- Table 68: Global Interspinous Spacers Market Volume Piece Forecast, by End-User 2019 & 2032
- Table 69: Global Interspinous Spacers Market Revenue Million Forecast, by Country 2019 & 2032
- Table 70: Global Interspinous Spacers Market Volume Piece Forecast, by Country 2019 & 2032
- Table 71: United States Interspinous Spacers Market Revenue (Million) Forecast, by Application 2019 & 2032
- Table 72: United States Interspinous Spacers Market Volume (Piece) Forecast, by Application 2019 & 2032
- Table 73: Canada Interspinous Spacers Market Revenue (Million) Forecast, by Application 2019 & 2032
- Table 74: Canada Interspinous Spacers Market Volume (Piece) Forecast, by Application 2019 & 2032
- Table 75: Mexico Interspinous Spacers Market Revenue (Million) Forecast, by Application 2019 & 2032
- Table 76: Mexico Interspinous Spacers Market Volume (Piece) Forecast, by Application 2019 & 2032
- Table 77: Global Interspinous Spacers Market Revenue Million Forecast, by Type 2019 & 2032
- Table 78: Global Interspinous Spacers Market Volume Piece Forecast, by Type 2019 & 2032
- Table 79: Global Interspinous Spacers Market Revenue Million Forecast, by Application 2019 & 2032
- Table 80: Global Interspinous Spacers Market Volume Piece Forecast, by Application 2019 & 2032
- Table 81: Global Interspinous Spacers Market Revenue Million Forecast, by End-User 2019 & 2032
- Table 82: Global Interspinous Spacers Market Volume Piece Forecast, by End-User 2019 & 2032
- Table 83: Global Interspinous Spacers Market Revenue Million Forecast, by Country 2019 & 2032
- Table 84: Global Interspinous Spacers Market Volume Piece Forecast, by Country 2019 & 2032
- Table 85: Germany Interspinous Spacers Market Revenue (Million) Forecast, by Application 2019 & 2032
- Table 86: Germany Interspinous Spacers Market Volume (Piece) Forecast, by Application 2019 & 2032
- Table 87: United Kingdom Interspinous Spacers Market Revenue (Million) Forecast, by Application 2019 & 2032
- Table 88: United Kingdom Interspinous Spacers Market Volume (Piece) Forecast, by Application 2019 & 2032
- Table 89: France Interspinous Spacers Market Revenue (Million) Forecast, by Application 2019 & 2032
- Table 90: France Interspinous Spacers Market Volume (Piece) Forecast, by Application 2019 & 2032
- Table 91: Italy Interspinous Spacers Market Revenue (Million) Forecast, by Application 2019 & 2032
- Table 92: Italy Interspinous Spacers Market Volume (Piece) Forecast, by Application 2019 & 2032
- Table 93: Spain Interspinous Spacers Market Revenue (Million) Forecast, by Application 2019 & 2032
- Table 94: Spain Interspinous Spacers Market Volume (Piece) Forecast, by Application 2019 & 2032
- Table 95: Rest of Europe Interspinous Spacers Market Revenue (Million) Forecast, by Application 2019 & 2032
- Table 96: Rest of Europe Interspinous Spacers Market Volume (Piece) Forecast, by Application 2019 & 2032
- Table 97: Global Interspinous Spacers Market Revenue Million Forecast, by Type 2019 & 2032
- Table 98: Global Interspinous Spacers Market Volume Piece Forecast, by Type 2019 & 2032
- Table 99: Global Interspinous Spacers Market Revenue Million Forecast, by Application 2019 & 2032
- Table 100: Global Interspinous Spacers Market Volume Piece Forecast, by Application 2019 & 2032
- Table 101: Global Interspinous Spacers Market Revenue Million Forecast, by End-User 2019 & 2032
- Table 102: Global Interspinous Spacers Market Volume Piece Forecast, by End-User 2019 & 2032
- Table 103: Global Interspinous Spacers Market Revenue Million Forecast, by Country 2019 & 2032
- Table 104: Global Interspinous Spacers Market Volume Piece Forecast, by Country 2019 & 2032
- Table 105: China Interspinous Spacers Market Revenue (Million) Forecast, by Application 2019 & 2032
- Table 106: China Interspinous Spacers Market Volume (Piece) Forecast, by Application 2019 & 2032
- Table 107: Japan Interspinous Spacers Market Revenue (Million) Forecast, by Application 2019 & 2032
- Table 108: Japan Interspinous Spacers Market Volume (Piece) Forecast, by Application 2019 & 2032
- Table 109: India Interspinous Spacers Market Revenue (Million) Forecast, by Application 2019 & 2032
- Table 110: India Interspinous Spacers Market Volume (Piece) Forecast, by Application 2019 & 2032
- Table 111: Australia Interspinous Spacers Market Revenue (Million) Forecast, by Application 2019 & 2032
- Table 112: Australia Interspinous Spacers Market Volume (Piece) Forecast, by Application 2019 & 2032
- Table 113: South Korea Interspinous Spacers Market Revenue (Million) Forecast, by Application 2019 & 2032
- Table 114: South Korea Interspinous Spacers Market Volume (Piece) Forecast, by Application 2019 & 2032
- Table 115: Rest of Asia Pacific Interspinous Spacers Market Revenue (Million) Forecast, by Application 2019 & 2032
- Table 116: Rest of Asia Pacific Interspinous Spacers Market Volume (Piece) Forecast, by Application 2019 & 2032
- Table 117: Global Interspinous Spacers Market Revenue Million Forecast, by Type 2019 & 2032
- Table 118: Global Interspinous Spacers Market Volume Piece Forecast, by Type 2019 & 2032
- Table 119: Global Interspinous Spacers Market Revenue Million Forecast, by Application 2019 & 2032
- Table 120: Global Interspinous Spacers Market Volume Piece Forecast, by Application 2019 & 2032
- Table 121: Global Interspinous Spacers Market Revenue Million Forecast, by End-User 2019 & 2032
- Table 122: Global Interspinous Spacers Market Volume Piece Forecast, by End-User 2019 & 2032
- Table 123: Global Interspinous Spacers Market Revenue Million Forecast, by Country 2019 & 2032
- Table 124: Global Interspinous Spacers Market Volume Piece Forecast, by Country 2019 & 2032
- Table 125: GCC Interspinous Spacers Market Revenue (Million) Forecast, by Application 2019 & 2032
- Table 126: GCC Interspinous Spacers Market Volume (Piece) Forecast, by Application 2019 & 2032
- Table 127: South Africa Interspinous Spacers Market Revenue (Million) Forecast, by Application 2019 & 2032
- Table 128: South Africa Interspinous Spacers Market Volume (Piece) Forecast, by Application 2019 & 2032
- Table 129: Rest of Middle East and Africa Interspinous Spacers Market Revenue (Million) Forecast, by Application 2019 & 2032
- Table 130: Rest of Middle East and Africa Interspinous Spacers Market Volume (Piece) Forecast, by Application 2019 & 2032
- Table 131: Global Interspinous Spacers Market Revenue Million Forecast, by Type 2019 & 2032
- Table 132: Global Interspinous Spacers Market Volume Piece Forecast, by Type 2019 & 2032
- Table 133: Global Interspinous Spacers Market Revenue Million Forecast, by Application 2019 & 2032
- Table 134: Global Interspinous Spacers Market Volume Piece Forecast, by Application 2019 & 2032
- Table 135: Global Interspinous Spacers Market Revenue Million Forecast, by End-User 2019 & 2032
- Table 136: Global Interspinous Spacers Market Volume Piece Forecast, by End-User 2019 & 2032
- Table 137: Global Interspinous Spacers Market Revenue Million Forecast, by Country 2019 & 2032
- Table 138: Global Interspinous Spacers Market Volume Piece Forecast, by Country 2019 & 2032
- Table 139: Brazil Interspinous Spacers Market Revenue (Million) Forecast, by Application 2019 & 2032
- Table 140: Brazil Interspinous Spacers Market Volume (Piece) Forecast, by Application 2019 & 2032
- Table 141: Argentina Interspinous Spacers Market Revenue (Million) Forecast, by Application 2019 & 2032
- Table 142: Argentina Interspinous Spacers Market Volume (Piece) Forecast, by Application 2019 & 2032
- Table 143: Rest of South America Interspinous Spacers Market Revenue (Million) Forecast, by Application 2019 & 2032
- Table 144: Rest of South America Interspinous Spacers Market Volume (Piece) Forecast, by Application 2019 & 2032
Frequently Asked Questions
1. What is the projected Compound Annual Growth Rate (CAGR) of the Interspinous Spacers Market?
The projected CAGR is approximately 5.40%.
2. Which companies are prominent players in the Interspinous Spacers Market?
Key companies in the market include Aurora Spine Inc , Life Spine Inc, Globus Medical Inc, Stryker, Boston Scientific, Surgalign Spine Technologies Inc, Johnson & Johnson, ATEC Spine Inc, NuVasive Inc, Boston Scientific, Zimmer Biomet Holdings, Inc, Others.
3. What are the main segments of the Interspinous Spacers Market?
The market segments include Type, Application, End-User.
4. Can you provide details about the market size?
The market size is estimated to be USD 77 Million as of 2022.
5. What are some drivers contributing to market growth?
Rising Demand for Minimally Invasive Solutions; Increasing Geriatric Population; Growth in Research and Technological Advancements in Interspinous Spacers.
6. What are the notable trends driving market growth?
Lumbar Spinal Stenosis Segment is Expected to Dominate the Market.
7. Are there any restraints impacting market growth?
Complications associated with Lumbar Spinal Fusion.
8. Can you provide examples of recent developments in the market?
December 2022: Life Spine, Inc. received USFDA clearance for the marketing of its TruLift Lateral Expandable Spacer System and Lateral Plate System. The TruLift Lateral and Lateral Plate System offer rapid fixation and stabilization of the lumbar spine.
9. What pricing options are available for accessing the report?
Pricing options include single-user, multi-user, and enterprise licenses priced at USD 4750, USD 5250, and USD 8750 respectively.
10. Is the market size provided in terms of value or volume?
The market size is provided in terms of value, measured in Million and volume, measured in Piece.
11. Are there any specific market keywords associated with the report?
Yes, the market keyword associated with the report is "Interspinous Spacers Market," which aids in identifying and referencing the specific market segment covered.
12. How do I determine which pricing option suits my needs best?
The pricing options vary based on user requirements and access needs. Individual users may opt for single-user licenses, while businesses requiring broader access may choose multi-user or enterprise licenses for cost-effective access to the report.
13. Are there any additional resources or data provided in the Interspinous Spacers Market report?
While the report offers comprehensive insights, it's advisable to review the specific contents or supplementary materials provided to ascertain if additional resources or data are available.
14. How can I stay updated on further developments or reports in the Interspinous Spacers Market?
To stay informed about further developments, trends, and reports in the Interspinous Spacers Market, consider subscribing to industry newsletters, following relevant companies and organizations, or regularly checking reputable industry news sources and publications.
Methodology
Step 1 - Identification of Relevant Samples Size from Population Database


Step 2 - Approaches for Defining Global Market Size (Value, Volume* & Price*)

Note*: In applicable scenarios
Step 3 - Data Sources
Primary Research
- Web Analytics
- Survey Reports
- Research Institute
- Latest Research Reports
- Opinion Leaders
Secondary Research
- Annual Reports
- White Paper
- Latest Press Release
- Industry Association
- Paid Database
- Investor Presentations

Step 4 - Data Triangulation
Involves using different sources of information in order to increase the validity of a study
These sources are likely to be stakeholders in a program - participants, other researchers, program staff, other community members, and so on.
Then we put all data in single framework & apply various statistical tools to find out the dynamic on the market.
During the analysis stage, feedback from the stakeholder groups would be compared to determine areas of agreement as well as areas of divergence


