
Key Insights
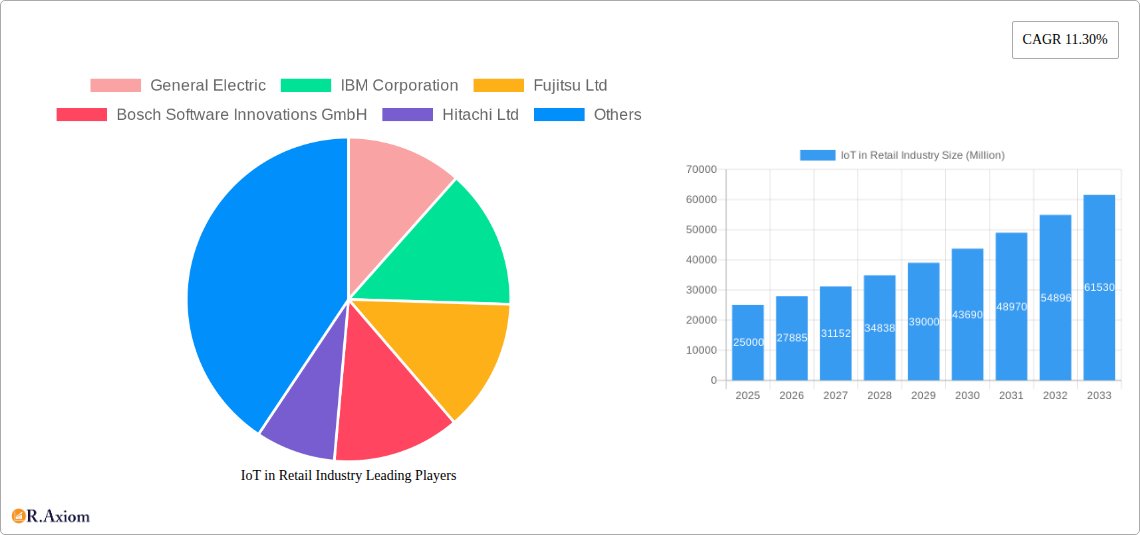
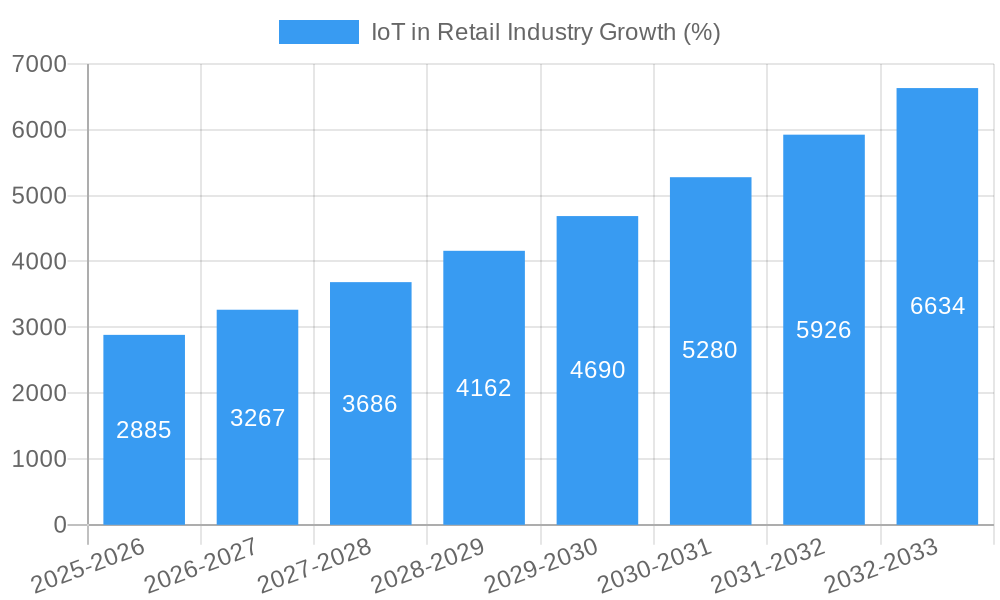
The Internet of Things (IoT) in the retail industry is experiencing robust growth, driven by the increasing need for enhanced operational efficiency, improved customer experience, and data-driven decision-making. The market, currently valued at (estimated) $XX million in 2025, is projected to witness a Compound Annual Growth Rate (CAGR) of 11.30% from 2025 to 2033. This expansion is fueled by several key factors. The widespread adoption of smart shelves and in-store analytics provides real-time inventory data, optimizing stock management and reducing waste. Furthermore, the integration of IoT devices, such as smart sensors and RFID tags, enables precise tracking of goods throughout the supply chain, enhancing visibility and reducing losses. Personalized customer experiences are also being significantly improved through connected devices that enable targeted promotions, customized recommendations, and seamless omnichannel shopping journeys. While initial investment costs and data security concerns pose some challenges, the long-term benefits of improved efficiency, reduced costs, and enhanced customer engagement are compelling retailers to embrace IoT solutions.
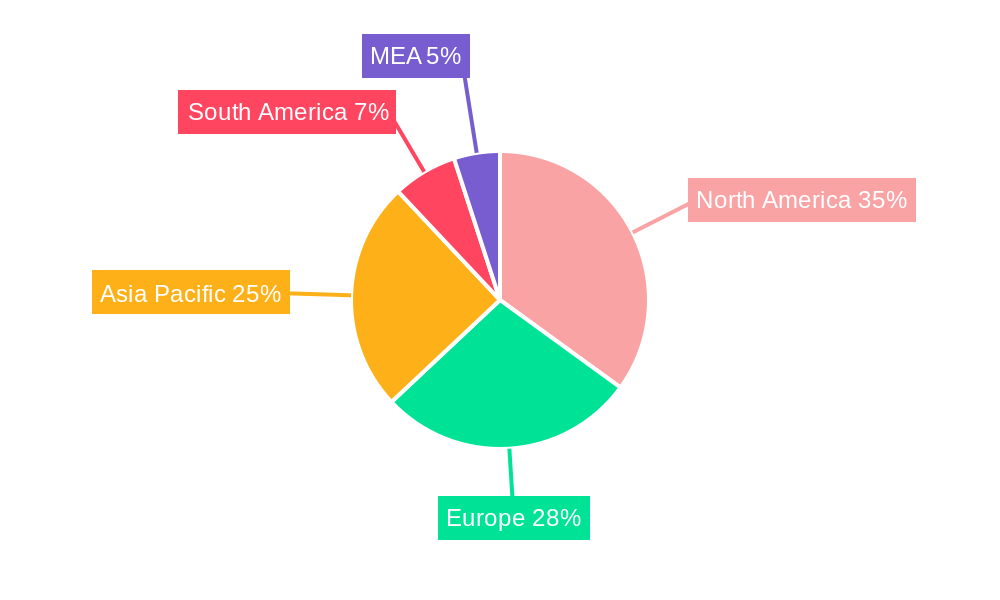
The competitive landscape is characterized by a mix of established technology giants and specialized IoT solution providers. Companies like General Electric, IBM, and others are leveraging their expertise in hardware, software, and services to offer comprehensive IoT solutions to retailers. The market is segmented by component (hardware, software, services), allowing businesses to tailor their investments based on specific needs. Geographically, North America and Europe currently hold significant market share, but the Asia-Pacific region is expected to witness the fastest growth due to rapid technological advancements and increasing e-commerce penetration. The ongoing evolution of technologies such as AI, machine learning, and 5G is set to further accelerate the adoption of IoT in retail, creating new opportunities for innovation and growth across all market segments in the coming years. This will lead to smarter stores, optimized supply chains, and ultimately, a more personalized and engaging shopping experience for consumers.
IoT in Retail Industry: A Comprehensive Market Report (2019-2033)
This in-depth report provides a comprehensive analysis of the IoT in Retail Industry market, offering valuable insights for stakeholders, investors, and industry professionals. The study covers the period from 2019 to 2033, with a focus on the forecast period from 2025 to 2033 and a base year of 2025. The market is projected to reach $xx Million by 2033, exhibiting a CAGR of xx% during the forecast period. This report analyzes market trends, competitive dynamics, growth drivers, and challenges, providing actionable insights for strategic decision-making. The report values are in Millions of US Dollars.
IoT in Retail Industry Market Concentration & Innovation
The IoT in Retail Industry market exhibits a moderately concentrated landscape, with a few major players holding significant market share. The market share of the top 5 players is estimated to be approximately 45% in 2025. However, the market also witnesses significant innovation driven by technological advancements and evolving consumer preferences. Several factors contribute to this dynamic environment, including:
- Innovation Drivers: Advancements in sensor technologies, cloud computing, big data analytics, and AI are key drivers, leading to the development of sophisticated solutions for inventory management, personalized shopping experiences, and improved supply chain efficiency.
- Regulatory Frameworks: Government regulations regarding data privacy and security are impacting market dynamics, influencing the adoption of secure IoT solutions.
- Product Substitutes: While IoT solutions are unique in their capabilities, traditional retail systems remain prevalent. The competitive edge of IoT lies in its ability to provide real-time data-driven insights and automation.
- End-User Trends: The increasing demand for personalized shopping experiences, seamless omnichannel integration, and improved customer service fuels the adoption of IoT solutions.
- M&A Activities: Significant M&A activity has been observed in the market, with deal values exceeding $xx Million in the past five years. This consolidation is expected to continue as companies seek to expand their market reach and product portfolios. Examples include recent acquisitions focusing on enhancing data analytics capabilities and expanding into new geographic markets.
IoT in Retail Industry Industry Trends & Insights
The IoT in Retail Industry market is experiencing robust growth, driven by a confluence of factors. The market is witnessing a significant shift towards data-driven decision-making, with retailers leveraging IoT data for improved operational efficiency, enhanced customer experiences, and optimized supply chain management. Key trends influencing market growth include:
- Increased Market Penetration: The adoption of IoT solutions is rapidly expanding across various retail segments, resulting in increased market penetration, reaching xx% in 2025.
- Technological Disruptions: The emergence of technologies like 5G, edge computing, and blockchain is transforming the landscape, leading to faster data transfer speeds, improved processing capabilities, and enhanced security.
- Evolving Consumer Preferences: The increasing demand for personalized shopping experiences, convenient payment options, and seamless omnichannel integration is driving innovation and shaping the evolution of IoT solutions in the retail sector.
- Competitive Dynamics: The market is highly competitive, with both established players and emerging startups vying for market share. This competition fosters innovation and fuels the development of advanced and cost-effective solutions.
Dominant Markets & Segments in IoT in Retail Industry
The North American region currently holds the largest market share in the IoT in Retail Industry, driven by high technology adoption rates, strong economic growth, and a well-established retail infrastructure. Within the market segments, the services segment is experiencing the fastest growth, owing to the increasing demand for managed services and consulting related to IoT deployment and maintenance.
Key Drivers of Regional Dominance (North America):
- Advanced infrastructure: Robust digital infrastructure enabling seamless IoT deployment.
- High technological adoption: High rates of technological adoption among retailers.
- Strong regulatory framework: Supportive regulatory environment that facilitates IoT implementation.
- Significant investments: Substantial investments in R&D and technology infrastructure.
By Component Segment Analysis:
- Hardware: This segment is characterized by a wide range of devices, including sensors, RFID tags, and gateways. The market is driven by the continuous innovation in device miniaturization, power efficiency, and enhanced functionalities.
- Software: This segment focuses on software platforms and applications for data management, analytics, and integration. The market is driven by increasing demand for sophisticated analytics capabilities and AI-powered solutions.
- Services: This segment encompasses managed services, consulting, and support services. The market is witnessing rapid growth driven by the increasing complexity of IoT deployments and the need for specialized expertise.
IoT in Retail Industry Product Developments
Recent product innovations focus on enhancing connectivity, improving data analytics capabilities, and integrating advanced technologies like AI and machine learning. The trend is towards more user-friendly interfaces and cost-effective solutions. Key innovations include the introduction of ambient IoT solutions and wireless power networks to streamline store operations and improve customer experiences.
Report Scope & Segmentation Analysis
This report segments the IoT in Retail Industry market by component (Hardware, Software, Service). Each segment is analyzed based on its growth projections, market size, and competitive dynamics. The hardware segment accounts for a significant portion of the market, while the services segment is expected to witness the fastest growth during the forecast period. The software segment provides the essential analytical and management capabilities driving the entire ecosystem.
Key Drivers of IoT in Retail Industry Growth
Several factors are driving the growth of the IoT in Retail Industry market. These include technological advancements, like improved sensor technology and AI-powered analytics, leading to enhanced efficiency and improved customer experiences. Favorable economic conditions and supportive government policies are boosting market expansion. The increasing demand for data-driven insights and the need for optimized supply chain management also contribute significantly to market growth.
Challenges in the IoT in Retail Industry Sector
Challenges include the high initial investment costs associated with IoT implementation, concerns regarding data security and privacy, and the complexity of integrating diverse IoT systems. Furthermore, the lack of skilled workforce capable of managing and maintaining complex IoT systems presents a significant challenge. These factors can impede market growth.
Emerging Opportunities in IoT in Retail Industry
Emerging opportunities are present in the expansion of IoT solutions into new markets and applications, especially within supply chain optimization and personalized customer engagement. The development of more sophisticated AI and machine learning algorithms enables enhanced data analysis and predictive capabilities, opening up new possibilities. Moreover, the increased adoption of blockchain technology offers improvements in supply chain transparency and security, further bolstering growth potential.
Leading Players in the IoT in Retail Industry Market
- General Electric
- IBM Corporation
- Fujitsu Ltd
- Bosch Software Innovations GmbH
- Hitachi Ltd
- Hewlett Packard Enterprise
- Ayla Networks Inc
- Siemens AG
- Cisco Systems Inc
- Microsoft Corporation
- Amazon Web Services Inc
- Huawei Technologies Co Ltd
- Oracle Corporation
- Google Inc
- AT&T Inc
- SAP SE
- Intel Corporation
Key Developments in IoT in Retail Industry Industry
- January 2023: Wiliot launched its Innovation Kit, facilitating the development of ambient IoT solutions across various industries, including retail and supply chain. This development significantly lowers the barrier to entry for companies looking to implement IoT solutions.
- January 2023: Energous Corporation and SATO Holdings Corporation partnered to develop joint solutions combining wireless power transmitters with IoT solutions for next-generation smart store applications. This partnership promotes the development of more energy-efficient and sustainable IoT solutions for retail.
Strategic Outlook for IoT in Retail Industry Market
The IoT in Retail Industry market is poised for significant growth, driven by continuous technological advancements, increasing demand for data-driven decision-making, and evolving consumer preferences. Strategic partnerships, innovative product development, and focus on enhancing customer experiences will be crucial for companies seeking to thrive in this dynamic market. The expanding use of AI, improved security protocols, and seamless integration across various retail channels are key growth catalysts.
IoT in Retail Industry Segmentation
-
1. Component
- 1.1. Hardware
- 1.2. Software
-
1.3. Service
- 1.3.1. Managed
- 1.3.2. Professional
-
2. Application
- 2.1. Inventory Management
- 2.2. Supply Chain Management
- 2.3. Customer Service
- 2.4. Marketing and Sales
- 2.5. Other Applications
-
3. Vertical
- 3.1. Food and Beverage
- 3.2. Apparel and Footwear
- 3.3. Electronics
- 3.4. Home Furnishings
- 3.5. Other Verticals
IoT in Retail Industry Segmentation By Geography
-
1. North America
- 1.1. United States
- 1.2. Canada
-
2. Europe
- 2.1. United Kingdom
- 2.2. Germany
- 2.3. France
- 2.4. Italy
- 2.5. Rest of Europe
-
3. Asia Pacific
- 3.1. China
- 3.2. India
- 3.3. Japan
- 3.4. Korea
- 3.5. Rest of Asia Pacific
- 4. Latin America
- 5. Middle East
IoT in Retail Industry REPORT HIGHLIGHTS
| Aspects | Details |
|---|---|
| Study Period | 2019-2033 |
| Base Year | 2024 |
| Estimated Year | 2025 |
| Forecast Period | 2025-2033 |
| Historical Period | 2019-2024 |
| Growth Rate | CAGR of 11.30% from 2019-2033 |
| Segmentation |
|
Table of Contents
- 1. Introduction
- 1.1. Research Scope
- 1.2. Market Segmentation
- 1.3. Research Methodology
- 1.4. Definitions and Assumptions
- 2. Executive Summary
- 2.1. Introduction
- 3. Market Dynamics
- 3.1. Introduction
- 3.2. Market Drivers
- 3.2.1 Increasing IoT Applications Among Retailers Such As Predictive Equipment Maintenance
- 3.2.2 Connected Consumer and Smart Store; Rising Need for a Competitive Business Model to Sustain Competition5.; Competition
- 3.3. Market Restrains
- 3.3.1. Data Security Concerns in High Availability Cloud Model
- 3.4. Market Trends
- 3.4.1. Software Component Expected to Hold Significant Share
- 4. Market Factor Analysis
- 4.1. Porters Five Forces
- 4.2. Supply/Value Chain
- 4.3. PESTEL analysis
- 4.4. Market Entropy
- 4.5. Patent/Trademark Analysis
- 5. Global IoT in Retail Industry Analysis, Insights and Forecast, 2019-2031
- 5.1. Market Analysis, Insights and Forecast - by Component
- 5.1.1. Hardware
- 5.1.2. Software
- 5.1.3. Service
- 5.1.3.1. Managed
- 5.1.3.2. Professional
- 5.2. Market Analysis, Insights and Forecast - by Application
- 5.2.1. Inventory Management
- 5.2.2. Supply Chain Management
- 5.2.3. Customer Service
- 5.2.4. Marketing and Sales
- 5.2.5. Other Applications
- 5.3. Market Analysis, Insights and Forecast - by Vertical
- 5.3.1. Food and Beverage
- 5.3.2. Apparel and Footwear
- 5.3.3. Electronics
- 5.3.4. Home Furnishings
- 5.3.5. Other Verticals
- 5.4. Market Analysis, Insights and Forecast - by Region
- 5.4.1. North America
- 5.4.2. Europe
- 5.4.3. Asia Pacific
- 5.4.4. Latin America
- 5.4.5. Middle East
- 5.1. Market Analysis, Insights and Forecast - by Component
- 6. North America IoT in Retail Industry Analysis, Insights and Forecast, 2019-2031
- 6.1. Market Analysis, Insights and Forecast - by Component
- 6.1.1. Hardware
- 6.1.2. Software
- 6.1.3. Service
- 6.1.3.1. Managed
- 6.1.3.2. Professional
- 6.2. Market Analysis, Insights and Forecast - by Application
- 6.2.1. Inventory Management
- 6.2.2. Supply Chain Management
- 6.2.3. Customer Service
- 6.2.4. Marketing and Sales
- 6.2.5. Other Applications
- 6.3. Market Analysis, Insights and Forecast - by Vertical
- 6.3.1. Food and Beverage
- 6.3.2. Apparel and Footwear
- 6.3.3. Electronics
- 6.3.4. Home Furnishings
- 6.3.5. Other Verticals
- 6.1. Market Analysis, Insights and Forecast - by Component
- 7. Europe IoT in Retail Industry Analysis, Insights and Forecast, 2019-2031
- 7.1. Market Analysis, Insights and Forecast - by Component
- 7.1.1. Hardware
- 7.1.2. Software
- 7.1.3. Service
- 7.1.3.1. Managed
- 7.1.3.2. Professional
- 7.2. Market Analysis, Insights and Forecast - by Application
- 7.2.1. Inventory Management
- 7.2.2. Supply Chain Management
- 7.2.3. Customer Service
- 7.2.4. Marketing and Sales
- 7.2.5. Other Applications
- 7.3. Market Analysis, Insights and Forecast - by Vertical
- 7.3.1. Food and Beverage
- 7.3.2. Apparel and Footwear
- 7.3.3. Electronics
- 7.3.4. Home Furnishings
- 7.3.5. Other Verticals
- 7.1. Market Analysis, Insights and Forecast - by Component
- 8. Asia Pacific IoT in Retail Industry Analysis, Insights and Forecast, 2019-2031
- 8.1. Market Analysis, Insights and Forecast - by Component
- 8.1.1. Hardware
- 8.1.2. Software
- 8.1.3. Service
- 8.1.3.1. Managed
- 8.1.3.2. Professional
- 8.2. Market Analysis, Insights and Forecast - by Application
- 8.2.1. Inventory Management
- 8.2.2. Supply Chain Management
- 8.2.3. Customer Service
- 8.2.4. Marketing and Sales
- 8.2.5. Other Applications
- 8.3. Market Analysis, Insights and Forecast - by Vertical
- 8.3.1. Food and Beverage
- 8.3.2. Apparel and Footwear
- 8.3.3. Electronics
- 8.3.4. Home Furnishings
- 8.3.5. Other Verticals
- 8.1. Market Analysis, Insights and Forecast - by Component
- 9. Latin America IoT in Retail Industry Analysis, Insights and Forecast, 2019-2031
- 9.1. Market Analysis, Insights and Forecast - by Component
- 9.1.1. Hardware
- 9.1.2. Software
- 9.1.3. Service
- 9.1.3.1. Managed
- 9.1.3.2. Professional
- 9.2. Market Analysis, Insights and Forecast - by Application
- 9.2.1. Inventory Management
- 9.2.2. Supply Chain Management
- 9.2.3. Customer Service
- 9.2.4. Marketing and Sales
- 9.2.5. Other Applications
- 9.3. Market Analysis, Insights and Forecast - by Vertical
- 9.3.1. Food and Beverage
- 9.3.2. Apparel and Footwear
- 9.3.3. Electronics
- 9.3.4. Home Furnishings
- 9.3.5. Other Verticals
- 9.1. Market Analysis, Insights and Forecast - by Component
- 10. Middle East IoT in Retail Industry Analysis, Insights and Forecast, 2019-2031
- 10.1. Market Analysis, Insights and Forecast - by Component
- 10.1.1. Hardware
- 10.1.2. Software
- 10.1.3. Service
- 10.1.3.1. Managed
- 10.1.3.2. Professional
- 10.2. Market Analysis, Insights and Forecast - by Application
- 10.2.1. Inventory Management
- 10.2.2. Supply Chain Management
- 10.2.3. Customer Service
- 10.2.4. Marketing and Sales
- 10.2.5. Other Applications
- 10.3. Market Analysis, Insights and Forecast - by Vertical
- 10.3.1. Food and Beverage
- 10.3.2. Apparel and Footwear
- 10.3.3. Electronics
- 10.3.4. Home Furnishings
- 10.3.5. Other Verticals
- 10.1. Market Analysis, Insights and Forecast - by Component
- 11. North America IoT in Retail Industry Analysis, Insights and Forecast, 2019-2031
- 11.1. Market Analysis, Insights and Forecast - By Country/Sub-region
- 11.1.1 United States
- 11.1.2 Canada
- 11.1.3 Mexico
- 12. Europe IoT in Retail Industry Analysis, Insights and Forecast, 2019-2031
- 12.1. Market Analysis, Insights and Forecast - By Country/Sub-region
- 12.1.1 Germany
- 12.1.2 United Kingdom
- 12.1.3 France
- 12.1.4 Spain
- 12.1.5 Italy
- 12.1.6 Spain
- 12.1.7 Belgium
- 12.1.8 Netherland
- 12.1.9 Nordics
- 12.1.10 Rest of Europe
- 13. Asia Pacific IoT in Retail Industry Analysis, Insights and Forecast, 2019-2031
- 13.1. Market Analysis, Insights and Forecast - By Country/Sub-region
- 13.1.1 China
- 13.1.2 Japan
- 13.1.3 India
- 13.1.4 South Korea
- 13.1.5 Southeast Asia
- 13.1.6 Australia
- 13.1.7 Indonesia
- 13.1.8 Phillipes
- 13.1.9 Singapore
- 13.1.10 Thailandc
- 13.1.11 Rest of Asia Pacific
- 14. South America IoT in Retail Industry Analysis, Insights and Forecast, 2019-2031
- 14.1. Market Analysis, Insights and Forecast - By Country/Sub-region
- 14.1.1 Brazil
- 14.1.2 Argentina
- 14.1.3 Peru
- 14.1.4 Chile
- 14.1.5 Colombia
- 14.1.6 Ecuador
- 14.1.7 Venezuela
- 14.1.8 Rest of South America
- 15. North America IoT in Retail Industry Analysis, Insights and Forecast, 2019-2031
- 15.1. Market Analysis, Insights and Forecast - By Country/Sub-region
- 15.1.1 United States
- 15.1.2 Canada
- 15.1.3 Mexico
- 16. MEA IoT in Retail Industry Analysis, Insights and Forecast, 2019-2031
- 16.1. Market Analysis, Insights and Forecast - By Country/Sub-region
- 16.1.1 United Arab Emirates
- 16.1.2 Saudi Arabia
- 16.1.3 South Africa
- 16.1.4 Rest of Middle East and Africa
- 17. Competitive Analysis
- 17.1. Global Market Share Analysis 2024
- 17.2. Company Profiles
- 17.2.1 General Electric
- 17.2.1.1. Overview
- 17.2.1.2. Products
- 17.2.1.3. SWOT Analysis
- 17.2.1.4. Recent Developments
- 17.2.1.5. Financials (Based on Availability)
- 17.2.2 IBM Corporation
- 17.2.2.1. Overview
- 17.2.2.2. Products
- 17.2.2.3. SWOT Analysis
- 17.2.2.4. Recent Developments
- 17.2.2.5. Financials (Based on Availability)
- 17.2.3 Fujitsu Ltd
- 17.2.3.1. Overview
- 17.2.3.2. Products
- 17.2.3.3. SWOT Analysis
- 17.2.3.4. Recent Developments
- 17.2.3.5. Financials (Based on Availability)
- 17.2.4 Bosch Software Innovations GmbH
- 17.2.4.1. Overview
- 17.2.4.2. Products
- 17.2.4.3. SWOT Analysis
- 17.2.4.4. Recent Developments
- 17.2.4.5. Financials (Based on Availability)
- 17.2.5 Hitachi Ltd
- 17.2.5.1. Overview
- 17.2.5.2. Products
- 17.2.5.3. SWOT Analysis
- 17.2.5.4. Recent Developments
- 17.2.5.5. Financials (Based on Availability)
- 17.2.6 Hewlett Packard Enterprise
- 17.2.6.1. Overview
- 17.2.6.2. Products
- 17.2.6.3. SWOT Analysis
- 17.2.6.4. Recent Developments
- 17.2.6.5. Financials (Based on Availability)
- 17.2.7 Ayla Networks Inc
- 17.2.7.1. Overview
- 17.2.7.2. Products
- 17.2.7.3. SWOT Analysis
- 17.2.7.4. Recent Developments
- 17.2.7.5. Financials (Based on Availability)
- 17.2.8 Siemens AG
- 17.2.8.1. Overview
- 17.2.8.2. Products
- 17.2.8.3. SWOT Analysis
- 17.2.8.4. Recent Developments
- 17.2.8.5. Financials (Based on Availability)
- 17.2.9 Cisco Systems Inc
- 17.2.9.1. Overview
- 17.2.9.2. Products
- 17.2.9.3. SWOT Analysis
- 17.2.9.4. Recent Developments
- 17.2.9.5. Financials (Based on Availability)
- 17.2.10 Microsoft Corporation
- 17.2.10.1. Overview
- 17.2.10.2. Products
- 17.2.10.3. SWOT Analysis
- 17.2.10.4. Recent Developments
- 17.2.10.5. Financials (Based on Availability)
- 17.2.11 Amazon Web Services Inc
- 17.2.11.1. Overview
- 17.2.11.2. Products
- 17.2.11.3. SWOT Analysis
- 17.2.11.4. Recent Developments
- 17.2.11.5. Financials (Based on Availability)
- 17.2.12 Huawei Technologies Co Ltd
- 17.2.12.1. Overview
- 17.2.12.2. Products
- 17.2.12.3. SWOT Analysis
- 17.2.12.4. Recent Developments
- 17.2.12.5. Financials (Based on Availability)
- 17.2.13 Oracle Corporation
- 17.2.13.1. Overview
- 17.2.13.2. Products
- 17.2.13.3. SWOT Analysis
- 17.2.13.4. Recent Developments
- 17.2.13.5. Financials (Based on Availability)
- 17.2.14 Google Inc
- 17.2.14.1. Overview
- 17.2.14.2. Products
- 17.2.14.3. SWOT Analysis
- 17.2.14.4. Recent Developments
- 17.2.14.5. Financials (Based on Availability)
- 17.2.15 AT&T Inc
- 17.2.15.1. Overview
- 17.2.15.2. Products
- 17.2.15.3. SWOT Analysis
- 17.2.15.4. Recent Developments
- 17.2.15.5. Financials (Based on Availability)
- 17.2.16 SAP SE
- 17.2.16.1. Overview
- 17.2.16.2. Products
- 17.2.16.3. SWOT Analysis
- 17.2.16.4. Recent Developments
- 17.2.16.5. Financials (Based on Availability)
- 17.2.17 Intel Corporation
- 17.2.17.1. Overview
- 17.2.17.2. Products
- 17.2.17.3. SWOT Analysis
- 17.2.17.4. Recent Developments
- 17.2.17.5. Financials (Based on Availability)
- 17.2.1 General Electric
List of Figures
- Figure 1: Global IoT in Retail Industry Revenue Breakdown (Million, %) by Region 2024 & 2032
- Figure 2: Global IoT in Retail Industry Volume Breakdown (K Unit, %) by Region 2024 & 2032
- Figure 3: North America IoT in Retail Industry Revenue (Million), by Country 2024 & 2032
- Figure 4: North America IoT in Retail Industry Volume (K Unit), by Country 2024 & 2032
- Figure 5: North America IoT in Retail Industry Revenue Share (%), by Country 2024 & 2032
- Figure 6: North America IoT in Retail Industry Volume Share (%), by Country 2024 & 2032
- Figure 7: Europe IoT in Retail Industry Revenue (Million), by Country 2024 & 2032
- Figure 8: Europe IoT in Retail Industry Volume (K Unit), by Country 2024 & 2032
- Figure 9: Europe IoT in Retail Industry Revenue Share (%), by Country 2024 & 2032
- Figure 10: Europe IoT in Retail Industry Volume Share (%), by Country 2024 & 2032
- Figure 11: Asia Pacific IoT in Retail Industry Revenue (Million), by Country 2024 & 2032
- Figure 12: Asia Pacific IoT in Retail Industry Volume (K Unit), by Country 2024 & 2032
- Figure 13: Asia Pacific IoT in Retail Industry Revenue Share (%), by Country 2024 & 2032
- Figure 14: Asia Pacific IoT in Retail Industry Volume Share (%), by Country 2024 & 2032
- Figure 15: South America IoT in Retail Industry Revenue (Million), by Country 2024 & 2032
- Figure 16: South America IoT in Retail Industry Volume (K Unit), by Country 2024 & 2032
- Figure 17: South America IoT in Retail Industry Revenue Share (%), by Country 2024 & 2032
- Figure 18: South America IoT in Retail Industry Volume Share (%), by Country 2024 & 2032
- Figure 19: North America IoT in Retail Industry Revenue (Million), by Country 2024 & 2032
- Figure 20: North America IoT in Retail Industry Volume (K Unit), by Country 2024 & 2032
- Figure 21: North America IoT in Retail Industry Revenue Share (%), by Country 2024 & 2032
- Figure 22: North America IoT in Retail Industry Volume Share (%), by Country 2024 & 2032
- Figure 23: MEA IoT in Retail Industry Revenue (Million), by Country 2024 & 2032
- Figure 24: MEA IoT in Retail Industry Volume (K Unit), by Country 2024 & 2032
- Figure 25: MEA IoT in Retail Industry Revenue Share (%), by Country 2024 & 2032
- Figure 26: MEA IoT in Retail Industry Volume Share (%), by Country 2024 & 2032
- Figure 27: North America IoT in Retail Industry Revenue (Million), by Component 2024 & 2032
- Figure 28: North America IoT in Retail Industry Volume (K Unit), by Component 2024 & 2032
- Figure 29: North America IoT in Retail Industry Revenue Share (%), by Component 2024 & 2032
- Figure 30: North America IoT in Retail Industry Volume Share (%), by Component 2024 & 2032
- Figure 31: North America IoT in Retail Industry Revenue (Million), by Application 2024 & 2032
- Figure 32: North America IoT in Retail Industry Volume (K Unit), by Application 2024 & 2032
- Figure 33: North America IoT in Retail Industry Revenue Share (%), by Application 2024 & 2032
- Figure 34: North America IoT in Retail Industry Volume Share (%), by Application 2024 & 2032
- Figure 35: North America IoT in Retail Industry Revenue (Million), by Vertical 2024 & 2032
- Figure 36: North America IoT in Retail Industry Volume (K Unit), by Vertical 2024 & 2032
- Figure 37: North America IoT in Retail Industry Revenue Share (%), by Vertical 2024 & 2032
- Figure 38: North America IoT in Retail Industry Volume Share (%), by Vertical 2024 & 2032
- Figure 39: North America IoT in Retail Industry Revenue (Million), by Country 2024 & 2032
- Figure 40: North America IoT in Retail Industry Volume (K Unit), by Country 2024 & 2032
- Figure 41: North America IoT in Retail Industry Revenue Share (%), by Country 2024 & 2032
- Figure 42: North America IoT in Retail Industry Volume Share (%), by Country 2024 & 2032
- Figure 43: Europe IoT in Retail Industry Revenue (Million), by Component 2024 & 2032
- Figure 44: Europe IoT in Retail Industry Volume (K Unit), by Component 2024 & 2032
- Figure 45: Europe IoT in Retail Industry Revenue Share (%), by Component 2024 & 2032
- Figure 46: Europe IoT in Retail Industry Volume Share (%), by Component 2024 & 2032
- Figure 47: Europe IoT in Retail Industry Revenue (Million), by Application 2024 & 2032
- Figure 48: Europe IoT in Retail Industry Volume (K Unit), by Application 2024 & 2032
- Figure 49: Europe IoT in Retail Industry Revenue Share (%), by Application 2024 & 2032
- Figure 50: Europe IoT in Retail Industry Volume Share (%), by Application 2024 & 2032
- Figure 51: Europe IoT in Retail Industry Revenue (Million), by Vertical 2024 & 2032
- Figure 52: Europe IoT in Retail Industry Volume (K Unit), by Vertical 2024 & 2032
- Figure 53: Europe IoT in Retail Industry Revenue Share (%), by Vertical 2024 & 2032
- Figure 54: Europe IoT in Retail Industry Volume Share (%), by Vertical 2024 & 2032
- Figure 55: Europe IoT in Retail Industry Revenue (Million), by Country 2024 & 2032
- Figure 56: Europe IoT in Retail Industry Volume (K Unit), by Country 2024 & 2032
- Figure 57: Europe IoT in Retail Industry Revenue Share (%), by Country 2024 & 2032
- Figure 58: Europe IoT in Retail Industry Volume Share (%), by Country 2024 & 2032
- Figure 59: Asia Pacific IoT in Retail Industry Revenue (Million), by Component 2024 & 2032
- Figure 60: Asia Pacific IoT in Retail Industry Volume (K Unit), by Component 2024 & 2032
- Figure 61: Asia Pacific IoT in Retail Industry Revenue Share (%), by Component 2024 & 2032
- Figure 62: Asia Pacific IoT in Retail Industry Volume Share (%), by Component 2024 & 2032
- Figure 63: Asia Pacific IoT in Retail Industry Revenue (Million), by Application 2024 & 2032
- Figure 64: Asia Pacific IoT in Retail Industry Volume (K Unit), by Application 2024 & 2032
- Figure 65: Asia Pacific IoT in Retail Industry Revenue Share (%), by Application 2024 & 2032
- Figure 66: Asia Pacific IoT in Retail Industry Volume Share (%), by Application 2024 & 2032
- Figure 67: Asia Pacific IoT in Retail Industry Revenue (Million), by Vertical 2024 & 2032
- Figure 68: Asia Pacific IoT in Retail Industry Volume (K Unit), by Vertical 2024 & 2032
- Figure 69: Asia Pacific IoT in Retail Industry Revenue Share (%), by Vertical 2024 & 2032
- Figure 70: Asia Pacific IoT in Retail Industry Volume Share (%), by Vertical 2024 & 2032
- Figure 71: Asia Pacific IoT in Retail Industry Revenue (Million), by Country 2024 & 2032
- Figure 72: Asia Pacific IoT in Retail Industry Volume (K Unit), by Country 2024 & 2032
- Figure 73: Asia Pacific IoT in Retail Industry Revenue Share (%), by Country 2024 & 2032
- Figure 74: Asia Pacific IoT in Retail Industry Volume Share (%), by Country 2024 & 2032
- Figure 75: Latin America IoT in Retail Industry Revenue (Million), by Component 2024 & 2032
- Figure 76: Latin America IoT in Retail Industry Volume (K Unit), by Component 2024 & 2032
- Figure 77: Latin America IoT in Retail Industry Revenue Share (%), by Component 2024 & 2032
- Figure 78: Latin America IoT in Retail Industry Volume Share (%), by Component 2024 & 2032
- Figure 79: Latin America IoT in Retail Industry Revenue (Million), by Application 2024 & 2032
- Figure 80: Latin America IoT in Retail Industry Volume (K Unit), by Application 2024 & 2032
- Figure 81: Latin America IoT in Retail Industry Revenue Share (%), by Application 2024 & 2032
- Figure 82: Latin America IoT in Retail Industry Volume Share (%), by Application 2024 & 2032
- Figure 83: Latin America IoT in Retail Industry Revenue (Million), by Vertical 2024 & 2032
- Figure 84: Latin America IoT in Retail Industry Volume (K Unit), by Vertical 2024 & 2032
- Figure 85: Latin America IoT in Retail Industry Revenue Share (%), by Vertical 2024 & 2032
- Figure 86: Latin America IoT in Retail Industry Volume Share (%), by Vertical 2024 & 2032
- Figure 87: Latin America IoT in Retail Industry Revenue (Million), by Country 2024 & 2032
- Figure 88: Latin America IoT in Retail Industry Volume (K Unit), by Country 2024 & 2032
- Figure 89: Latin America IoT in Retail Industry Revenue Share (%), by Country 2024 & 2032
- Figure 90: Latin America IoT in Retail Industry Volume Share (%), by Country 2024 & 2032
- Figure 91: Middle East IoT in Retail Industry Revenue (Million), by Component 2024 & 2032
- Figure 92: Middle East IoT in Retail Industry Volume (K Unit), by Component 2024 & 2032
- Figure 93: Middle East IoT in Retail Industry Revenue Share (%), by Component 2024 & 2032
- Figure 94: Middle East IoT in Retail Industry Volume Share (%), by Component 2024 & 2032
- Figure 95: Middle East IoT in Retail Industry Revenue (Million), by Application 2024 & 2032
- Figure 96: Middle East IoT in Retail Industry Volume (K Unit), by Application 2024 & 2032
- Figure 97: Middle East IoT in Retail Industry Revenue Share (%), by Application 2024 & 2032
- Figure 98: Middle East IoT in Retail Industry Volume Share (%), by Application 2024 & 2032
- Figure 99: Middle East IoT in Retail Industry Revenue (Million), by Vertical 2024 & 2032
- Figure 100: Middle East IoT in Retail Industry Volume (K Unit), by Vertical 2024 & 2032
- Figure 101: Middle East IoT in Retail Industry Revenue Share (%), by Vertical 2024 & 2032
- Figure 102: Middle East IoT in Retail Industry Volume Share (%), by Vertical 2024 & 2032
- Figure 103: Middle East IoT in Retail Industry Revenue (Million), by Country 2024 & 2032
- Figure 104: Middle East IoT in Retail Industry Volume (K Unit), by Country 2024 & 2032
- Figure 105: Middle East IoT in Retail Industry Revenue Share (%), by Country 2024 & 2032
- Figure 106: Middle East IoT in Retail Industry Volume Share (%), by Country 2024 & 2032
List of Tables
- Table 1: Global IoT in Retail Industry Revenue Million Forecast, by Region 2019 & 2032
- Table 2: Global IoT in Retail Industry Volume K Unit Forecast, by Region 2019 & 2032
- Table 3: Global IoT in Retail Industry Revenue Million Forecast, by Component 2019 & 2032
- Table 4: Global IoT in Retail Industry Volume K Unit Forecast, by Component 2019 & 2032
- Table 5: Global IoT in Retail Industry Revenue Million Forecast, by Application 2019 & 2032
- Table 6: Global IoT in Retail Industry Volume K Unit Forecast, by Application 2019 & 2032
- Table 7: Global IoT in Retail Industry Revenue Million Forecast, by Vertical 2019 & 2032
- Table 8: Global IoT in Retail Industry Volume K Unit Forecast, by Vertical 2019 & 2032
- Table 9: Global IoT in Retail Industry Revenue Million Forecast, by Region 2019 & 2032
- Table 10: Global IoT in Retail Industry Volume K Unit Forecast, by Region 2019 & 2032
- Table 11: Global IoT in Retail Industry Revenue Million Forecast, by Country 2019 & 2032
- Table 12: Global IoT in Retail Industry Volume K Unit Forecast, by Country 2019 & 2032
- Table 13: United States IoT in Retail Industry Revenue (Million) Forecast, by Application 2019 & 2032
- Table 14: United States IoT in Retail Industry Volume (K Unit) Forecast, by Application 2019 & 2032
- Table 15: Canada IoT in Retail Industry Revenue (Million) Forecast, by Application 2019 & 2032
- Table 16: Canada IoT in Retail Industry Volume (K Unit) Forecast, by Application 2019 & 2032
- Table 17: Mexico IoT in Retail Industry Revenue (Million) Forecast, by Application 2019 & 2032
- Table 18: Mexico IoT in Retail Industry Volume (K Unit) Forecast, by Application 2019 & 2032
- Table 19: Global IoT in Retail Industry Revenue Million Forecast, by Country 2019 & 2032
- Table 20: Global IoT in Retail Industry Volume K Unit Forecast, by Country 2019 & 2032
- Table 21: Germany IoT in Retail Industry Revenue (Million) Forecast, by Application 2019 & 2032
- Table 22: Germany IoT in Retail Industry Volume (K Unit) Forecast, by Application 2019 & 2032
- Table 23: United Kingdom IoT in Retail Industry Revenue (Million) Forecast, by Application 2019 & 2032
- Table 24: United Kingdom IoT in Retail Industry Volume (K Unit) Forecast, by Application 2019 & 2032
- Table 25: France IoT in Retail Industry Revenue (Million) Forecast, by Application 2019 & 2032
- Table 26: France IoT in Retail Industry Volume (K Unit) Forecast, by Application 2019 & 2032
- Table 27: Spain IoT in Retail Industry Revenue (Million) Forecast, by Application 2019 & 2032
- Table 28: Spain IoT in Retail Industry Volume (K Unit) Forecast, by Application 2019 & 2032
- Table 29: Italy IoT in Retail Industry Revenue (Million) Forecast, by Application 2019 & 2032
- Table 30: Italy IoT in Retail Industry Volume (K Unit) Forecast, by Application 2019 & 2032
- Table 31: Spain IoT in Retail Industry Revenue (Million) Forecast, by Application 2019 & 2032
- Table 32: Spain IoT in Retail Industry Volume (K Unit) Forecast, by Application 2019 & 2032
- Table 33: Belgium IoT in Retail Industry Revenue (Million) Forecast, by Application 2019 & 2032
- Table 34: Belgium IoT in Retail Industry Volume (K Unit) Forecast, by Application 2019 & 2032
- Table 35: Netherland IoT in Retail Industry Revenue (Million) Forecast, by Application 2019 & 2032
- Table 36: Netherland IoT in Retail Industry Volume (K Unit) Forecast, by Application 2019 & 2032
- Table 37: Nordics IoT in Retail Industry Revenue (Million) Forecast, by Application 2019 & 2032
- Table 38: Nordics IoT in Retail Industry Volume (K Unit) Forecast, by Application 2019 & 2032
- Table 39: Rest of Europe IoT in Retail Industry Revenue (Million) Forecast, by Application 2019 & 2032
- Table 40: Rest of Europe IoT in Retail Industry Volume (K Unit) Forecast, by Application 2019 & 2032
- Table 41: Global IoT in Retail Industry Revenue Million Forecast, by Country 2019 & 2032
- Table 42: Global IoT in Retail Industry Volume K Unit Forecast, by Country 2019 & 2032
- Table 43: China IoT in Retail Industry Revenue (Million) Forecast, by Application 2019 & 2032
- Table 44: China IoT in Retail Industry Volume (K Unit) Forecast, by Application 2019 & 2032
- Table 45: Japan IoT in Retail Industry Revenue (Million) Forecast, by Application 2019 & 2032
- Table 46: Japan IoT in Retail Industry Volume (K Unit) Forecast, by Application 2019 & 2032
- Table 47: India IoT in Retail Industry Revenue (Million) Forecast, by Application 2019 & 2032
- Table 48: India IoT in Retail Industry Volume (K Unit) Forecast, by Application 2019 & 2032
- Table 49: South Korea IoT in Retail Industry Revenue (Million) Forecast, by Application 2019 & 2032
- Table 50: South Korea IoT in Retail Industry Volume (K Unit) Forecast, by Application 2019 & 2032
- Table 51: Southeast Asia IoT in Retail Industry Revenue (Million) Forecast, by Application 2019 & 2032
- Table 52: Southeast Asia IoT in Retail Industry Volume (K Unit) Forecast, by Application 2019 & 2032
- Table 53: Australia IoT in Retail Industry Revenue (Million) Forecast, by Application 2019 & 2032
- Table 54: Australia IoT in Retail Industry Volume (K Unit) Forecast, by Application 2019 & 2032
- Table 55: Indonesia IoT in Retail Industry Revenue (Million) Forecast, by Application 2019 & 2032
- Table 56: Indonesia IoT in Retail Industry Volume (K Unit) Forecast, by Application 2019 & 2032
- Table 57: Phillipes IoT in Retail Industry Revenue (Million) Forecast, by Application 2019 & 2032
- Table 58: Phillipes IoT in Retail Industry Volume (K Unit) Forecast, by Application 2019 & 2032
- Table 59: Singapore IoT in Retail Industry Revenue (Million) Forecast, by Application 2019 & 2032
- Table 60: Singapore IoT in Retail Industry Volume (K Unit) Forecast, by Application 2019 & 2032
- Table 61: Thailandc IoT in Retail Industry Revenue (Million) Forecast, by Application 2019 & 2032
- Table 62: Thailandc IoT in Retail Industry Volume (K Unit) Forecast, by Application 2019 & 2032
- Table 63: Rest of Asia Pacific IoT in Retail Industry Revenue (Million) Forecast, by Application 2019 & 2032
- Table 64: Rest of Asia Pacific IoT in Retail Industry Volume (K Unit) Forecast, by Application 2019 & 2032
- Table 65: Global IoT in Retail Industry Revenue Million Forecast, by Country 2019 & 2032
- Table 66: Global IoT in Retail Industry Volume K Unit Forecast, by Country 2019 & 2032
- Table 67: Brazil IoT in Retail Industry Revenue (Million) Forecast, by Application 2019 & 2032
- Table 68: Brazil IoT in Retail Industry Volume (K Unit) Forecast, by Application 2019 & 2032
- Table 69: Argentina IoT in Retail Industry Revenue (Million) Forecast, by Application 2019 & 2032
- Table 70: Argentina IoT in Retail Industry Volume (K Unit) Forecast, by Application 2019 & 2032
- Table 71: Peru IoT in Retail Industry Revenue (Million) Forecast, by Application 2019 & 2032
- Table 72: Peru IoT in Retail Industry Volume (K Unit) Forecast, by Application 2019 & 2032
- Table 73: Chile IoT in Retail Industry Revenue (Million) Forecast, by Application 2019 & 2032
- Table 74: Chile IoT in Retail Industry Volume (K Unit) Forecast, by Application 2019 & 2032
- Table 75: Colombia IoT in Retail Industry Revenue (Million) Forecast, by Application 2019 & 2032
- Table 76: Colombia IoT in Retail Industry Volume (K Unit) Forecast, by Application 2019 & 2032
- Table 77: Ecuador IoT in Retail Industry Revenue (Million) Forecast, by Application 2019 & 2032
- Table 78: Ecuador IoT in Retail Industry Volume (K Unit) Forecast, by Application 2019 & 2032
- Table 79: Venezuela IoT in Retail Industry Revenue (Million) Forecast, by Application 2019 & 2032
- Table 80: Venezuela IoT in Retail Industry Volume (K Unit) Forecast, by Application 2019 & 2032
- Table 81: Rest of South America IoT in Retail Industry Revenue (Million) Forecast, by Application 2019 & 2032
- Table 82: Rest of South America IoT in Retail Industry Volume (K Unit) Forecast, by Application 2019 & 2032
- Table 83: Global IoT in Retail Industry Revenue Million Forecast, by Country 2019 & 2032
- Table 84: Global IoT in Retail Industry Volume K Unit Forecast, by Country 2019 & 2032
- Table 85: United States IoT in Retail Industry Revenue (Million) Forecast, by Application 2019 & 2032
- Table 86: United States IoT in Retail Industry Volume (K Unit) Forecast, by Application 2019 & 2032
- Table 87: Canada IoT in Retail Industry Revenue (Million) Forecast, by Application 2019 & 2032
- Table 88: Canada IoT in Retail Industry Volume (K Unit) Forecast, by Application 2019 & 2032
- Table 89: Mexico IoT in Retail Industry Revenue (Million) Forecast, by Application 2019 & 2032
- Table 90: Mexico IoT in Retail Industry Volume (K Unit) Forecast, by Application 2019 & 2032
- Table 91: Global IoT in Retail Industry Revenue Million Forecast, by Country 2019 & 2032
- Table 92: Global IoT in Retail Industry Volume K Unit Forecast, by Country 2019 & 2032
- Table 93: United Arab Emirates IoT in Retail Industry Revenue (Million) Forecast, by Application 2019 & 2032
- Table 94: United Arab Emirates IoT in Retail Industry Volume (K Unit) Forecast, by Application 2019 & 2032
- Table 95: Saudi Arabia IoT in Retail Industry Revenue (Million) Forecast, by Application 2019 & 2032
- Table 96: Saudi Arabia IoT in Retail Industry Volume (K Unit) Forecast, by Application 2019 & 2032
- Table 97: South Africa IoT in Retail Industry Revenue (Million) Forecast, by Application 2019 & 2032
- Table 98: South Africa IoT in Retail Industry Volume (K Unit) Forecast, by Application 2019 & 2032
- Table 99: Rest of Middle East and Africa IoT in Retail Industry Revenue (Million) Forecast, by Application 2019 & 2032
- Table 100: Rest of Middle East and Africa IoT in Retail Industry Volume (K Unit) Forecast, by Application 2019 & 2032
- Table 101: Global IoT in Retail Industry Revenue Million Forecast, by Component 2019 & 2032
- Table 102: Global IoT in Retail Industry Volume K Unit Forecast, by Component 2019 & 2032
- Table 103: Global IoT in Retail Industry Revenue Million Forecast, by Application 2019 & 2032
- Table 104: Global IoT in Retail Industry Volume K Unit Forecast, by Application 2019 & 2032
- Table 105: Global IoT in Retail Industry Revenue Million Forecast, by Vertical 2019 & 2032
- Table 106: Global IoT in Retail Industry Volume K Unit Forecast, by Vertical 2019 & 2032
- Table 107: Global IoT in Retail Industry Revenue Million Forecast, by Country 2019 & 2032
- Table 108: Global IoT in Retail Industry Volume K Unit Forecast, by Country 2019 & 2032
- Table 109: United States IoT in Retail Industry Revenue (Million) Forecast, by Application 2019 & 2032
- Table 110: United States IoT in Retail Industry Volume (K Unit) Forecast, by Application 2019 & 2032
- Table 111: Canada IoT in Retail Industry Revenue (Million) Forecast, by Application 2019 & 2032
- Table 112: Canada IoT in Retail Industry Volume (K Unit) Forecast, by Application 2019 & 2032
- Table 113: Global IoT in Retail Industry Revenue Million Forecast, by Component 2019 & 2032
- Table 114: Global IoT in Retail Industry Volume K Unit Forecast, by Component 2019 & 2032
- Table 115: Global IoT in Retail Industry Revenue Million Forecast, by Application 2019 & 2032
- Table 116: Global IoT in Retail Industry Volume K Unit Forecast, by Application 2019 & 2032
- Table 117: Global IoT in Retail Industry Revenue Million Forecast, by Vertical 2019 & 2032
- Table 118: Global IoT in Retail Industry Volume K Unit Forecast, by Vertical 2019 & 2032
- Table 119: Global IoT in Retail Industry Revenue Million Forecast, by Country 2019 & 2032
- Table 120: Global IoT in Retail Industry Volume K Unit Forecast, by Country 2019 & 2032
- Table 121: United Kingdom IoT in Retail Industry Revenue (Million) Forecast, by Application 2019 & 2032
- Table 122: United Kingdom IoT in Retail Industry Volume (K Unit) Forecast, by Application 2019 & 2032
- Table 123: Germany IoT in Retail Industry Revenue (Million) Forecast, by Application 2019 & 2032
- Table 124: Germany IoT in Retail Industry Volume (K Unit) Forecast, by Application 2019 & 2032
- Table 125: France IoT in Retail Industry Revenue (Million) Forecast, by Application 2019 & 2032
- Table 126: France IoT in Retail Industry Volume (K Unit) Forecast, by Application 2019 & 2032
- Table 127: Italy IoT in Retail Industry Revenue (Million) Forecast, by Application 2019 & 2032
- Table 128: Italy IoT in Retail Industry Volume (K Unit) Forecast, by Application 2019 & 2032
- Table 129: Rest of Europe IoT in Retail Industry Revenue (Million) Forecast, by Application 2019 & 2032
- Table 130: Rest of Europe IoT in Retail Industry Volume (K Unit) Forecast, by Application 2019 & 2032
- Table 131: Global IoT in Retail Industry Revenue Million Forecast, by Component 2019 & 2032
- Table 132: Global IoT in Retail Industry Volume K Unit Forecast, by Component 2019 & 2032
- Table 133: Global IoT in Retail Industry Revenue Million Forecast, by Application 2019 & 2032
- Table 134: Global IoT in Retail Industry Volume K Unit Forecast, by Application 2019 & 2032
- Table 135: Global IoT in Retail Industry Revenue Million Forecast, by Vertical 2019 & 2032
- Table 136: Global IoT in Retail Industry Volume K Unit Forecast, by Vertical 2019 & 2032
- Table 137: Global IoT in Retail Industry Revenue Million Forecast, by Country 2019 & 2032
- Table 138: Global IoT in Retail Industry Volume K Unit Forecast, by Country 2019 & 2032
- Table 139: China IoT in Retail Industry Revenue (Million) Forecast, by Application 2019 & 2032
- Table 140: China IoT in Retail Industry Volume (K Unit) Forecast, by Application 2019 & 2032
- Table 141: India IoT in Retail Industry Revenue (Million) Forecast, by Application 2019 & 2032
- Table 142: India IoT in Retail Industry Volume (K Unit) Forecast, by Application 2019 & 2032
- Table 143: Japan IoT in Retail Industry Revenue (Million) Forecast, by Application 2019 & 2032
- Table 144: Japan IoT in Retail Industry Volume (K Unit) Forecast, by Application 2019 & 2032
- Table 145: Korea IoT in Retail Industry Revenue (Million) Forecast, by Application 2019 & 2032
- Table 146: Korea IoT in Retail Industry Volume (K Unit) Forecast, by Application 2019 & 2032
- Table 147: Rest of Asia Pacific IoT in Retail Industry Revenue (Million) Forecast, by Application 2019 & 2032
- Table 148: Rest of Asia Pacific IoT in Retail Industry Volume (K Unit) Forecast, by Application 2019 & 2032
- Table 149: Global IoT in Retail Industry Revenue Million Forecast, by Component 2019 & 2032
- Table 150: Global IoT in Retail Industry Volume K Unit Forecast, by Component 2019 & 2032
- Table 151: Global IoT in Retail Industry Revenue Million Forecast, by Application 2019 & 2032
- Table 152: Global IoT in Retail Industry Volume K Unit Forecast, by Application 2019 & 2032
- Table 153: Global IoT in Retail Industry Revenue Million Forecast, by Vertical 2019 & 2032
- Table 154: Global IoT in Retail Industry Volume K Unit Forecast, by Vertical 2019 & 2032
- Table 155: Global IoT in Retail Industry Revenue Million Forecast, by Country 2019 & 2032
- Table 156: Global IoT in Retail Industry Volume K Unit Forecast, by Country 2019 & 2032
- Table 157: Global IoT in Retail Industry Revenue Million Forecast, by Component 2019 & 2032
- Table 158: Global IoT in Retail Industry Volume K Unit Forecast, by Component 2019 & 2032
- Table 159: Global IoT in Retail Industry Revenue Million Forecast, by Application 2019 & 2032
- Table 160: Global IoT in Retail Industry Volume K Unit Forecast, by Application 2019 & 2032
- Table 161: Global IoT in Retail Industry Revenue Million Forecast, by Vertical 2019 & 2032
- Table 162: Global IoT in Retail Industry Volume K Unit Forecast, by Vertical 2019 & 2032
- Table 163: Global IoT in Retail Industry Revenue Million Forecast, by Country 2019 & 2032
- Table 164: Global IoT in Retail Industry Volume K Unit Forecast, by Country 2019 & 2032
Frequently Asked Questions
1. What is the projected Compound Annual Growth Rate (CAGR) of the IoT in Retail Industry?
The projected CAGR is approximately 11.30%.
2. Which companies are prominent players in the IoT in Retail Industry?
Key companies in the market include General Electric, IBM Corporation, Fujitsu Ltd, Bosch Software Innovations GmbH, Hitachi Ltd, Hewlett Packard Enterprise, Ayla Networks Inc, Siemens AG, Cisco Systems Inc, Microsoft Corporation, Amazon Web Services Inc, Huawei Technologies Co Ltd, Oracle Corporation, Google Inc, AT&T Inc, SAP SE, Intel Corporation.
3. What are the main segments of the IoT in Retail Industry?
The market segments include Component, Application, Vertical.
4. Can you provide details about the market size?
The market size is estimated to be USD XX Million as of 2022.
5. What are some drivers contributing to market growth?
Increasing IoT Applications Among Retailers Such As Predictive Equipment Maintenance. Connected Consumer and Smart Store; Rising Need for a Competitive Business Model to Sustain Competition5.; Competition.
6. What are the notable trends driving market growth?
Software Component Expected to Hold Significant Share.
7. Are there any restraints impacting market growth?
Data Security Concerns in High Availability Cloud Model.
8. Can you provide examples of recent developments in the market?
January 2023 - Wiliot, the Internet of Things pioneer whose IoT platform is enabling trillions of 'things' to gain intelligence, declared the introduction of its Innovation Kit, which equips companies of any budget and size with an easy onramp to begin building and exploring ambient IoT solutions that can solve the biggest challenges facing retail, supply chains, CPG, healthcare, agriculture, and many others.
9. What pricing options are available for accessing the report?
Pricing options include single-user, multi-user, and enterprise licenses priced at USD 4750, USD 5250, and USD 8750 respectively.
10. Is the market size provided in terms of value or volume?
The market size is provided in terms of value, measured in Million and volume, measured in K Unit.
11. Are there any specific market keywords associated with the report?
Yes, the market keyword associated with the report is "IoT in Retail Industry," which aids in identifying and referencing the specific market segment covered.
12. How do I determine which pricing option suits my needs best?
The pricing options vary based on user requirements and access needs. Individual users may opt for single-user licenses, while businesses requiring broader access may choose multi-user or enterprise licenses for cost-effective access to the report.
13. Are there any additional resources or data provided in the IoT in Retail Industry report?
While the report offers comprehensive insights, it's advisable to review the specific contents or supplementary materials provided to ascertain if additional resources or data are available.
14. How can I stay updated on further developments or reports in the IoT in Retail Industry?
To stay informed about further developments, trends, and reports in the IoT in Retail Industry, consider subscribing to industry newsletters, following relevant companies and organizations, or regularly checking reputable industry news sources and publications.
Methodology
Step 1 - Identification of Relevant Samples Size from Population Database


Step 2 - Approaches for Defining Global Market Size (Value, Volume* & Price*)

Note*: In applicable scenarios
Step 3 - Data Sources
Primary Research
- Web Analytics
- Survey Reports
- Research Institute
- Latest Research Reports
- Opinion Leaders
Secondary Research
- Annual Reports
- White Paper
- Latest Press Release
- Industry Association
- Paid Database
- Investor Presentations

Step 4 - Data Triangulation
Involves using different sources of information in order to increase the validity of a study
These sources are likely to be stakeholders in a program - participants, other researchers, program staff, other community members, and so on.
Then we put all data in single framework & apply various statistical tools to find out the dynamic on the market.
During the analysis stage, feedback from the stakeholder groups would be compared to determine areas of agreement as well as areas of divergence


