
Key Insights
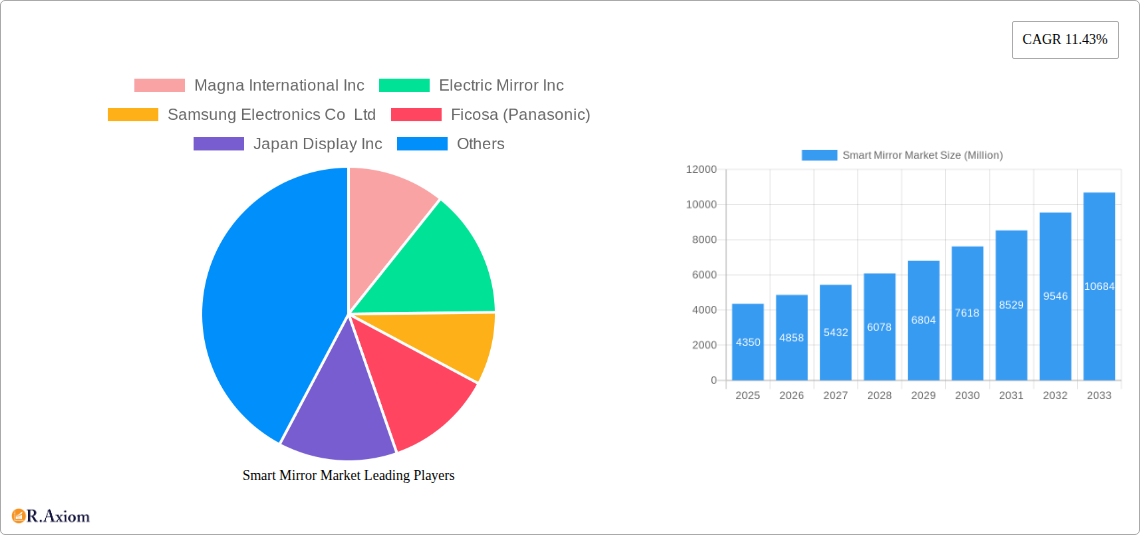
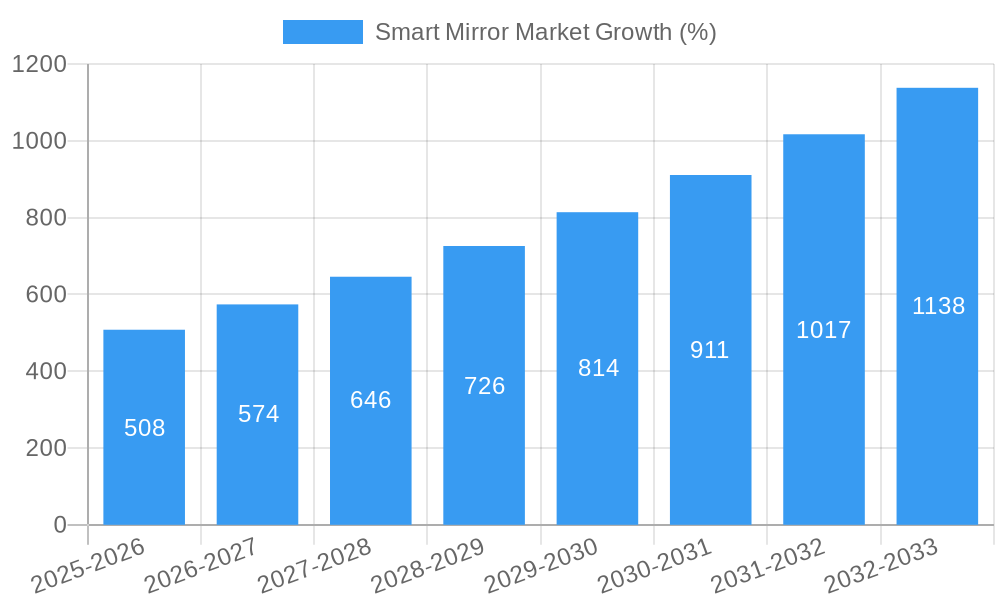
The smart mirror market, valued at $4.35 billion in 2025, is projected to experience robust growth, exhibiting a Compound Annual Growth Rate (CAGR) of 11.43% from 2025 to 2033. This expansion is driven by several key factors. Increasing consumer demand for personalized and convenient technological solutions within the home and various commercial settings fuels market growth. The integration of smart mirrors into diverse applications, including healthcare (for remote patient monitoring and personalized fitness coaching), automotive (for enhanced driver information and entertainment), retail and marketing (for interactive displays and personalized shopping experiences), and residential settings (for improved daily routines and home automation), is a significant contributor to this expansion. Furthermore, technological advancements leading to improved display quality, enhanced processing power, and more sophisticated software capabilities are continually improving the functionality and appeal of smart mirrors, attracting a wider consumer base.
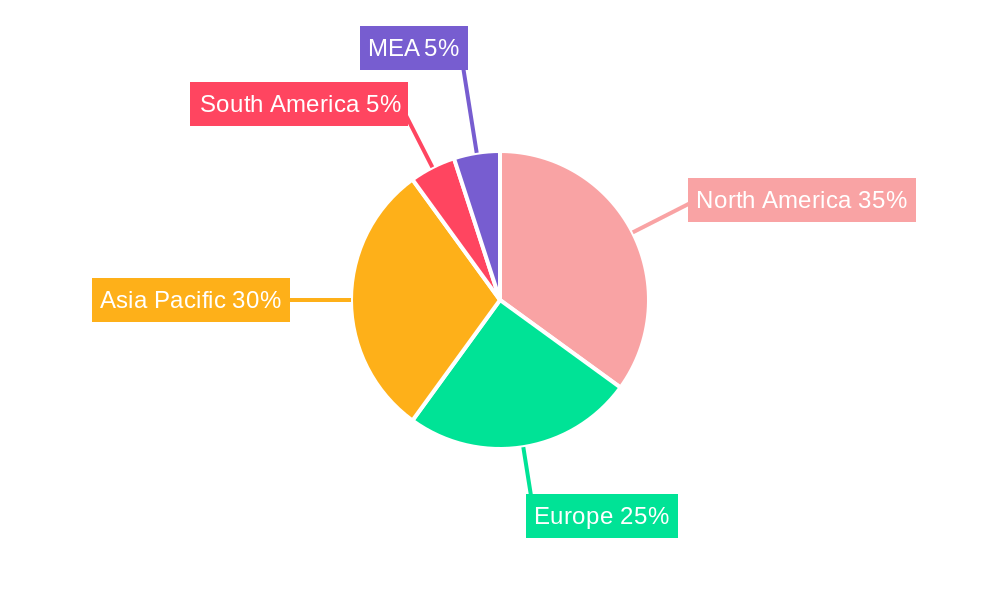
The market segmentation reveals that hardware components currently dominate the market share, followed by software and services. North America and Asia-Pacific are the leading regional markets, fueled by high technological adoption rates and a strong presence of key players. However, growth opportunities exist in other regions as smart mirror technology becomes more affordable and accessible. While the market faces restraints such as high initial investment costs and concerns around data privacy and security, ongoing innovations and the development of more cost-effective solutions are expected to mitigate these challenges and further accelerate market growth in the coming years. Competition among established players like Magna International Inc., Samsung Electronics Co Ltd, and Gentex Corp, alongside emerging companies, is driving innovation and fostering a dynamic market landscape.
Smart Mirror Market: A Comprehensive Analysis (2019-2033)
This detailed report provides an in-depth analysis of the global Smart Mirror Market, encompassing market size, growth drivers, challenges, opportunities, and competitive landscape. The study period spans from 2019 to 2033, with 2025 serving as the base and estimated year. The report offers actionable insights for industry stakeholders, including manufacturers, investors, and market entrants, enabling informed strategic decision-making. The market is valued at xx Million in 2025 and is projected to reach xx Million by 2033, exhibiting a CAGR of xx% during the forecast period (2025-2033).
Smart Mirror Market Market Concentration & Innovation
The Smart Mirror market exhibits a moderately concentrated landscape, with key players like Magna International Inc, Gentex Corp, and Samsung Electronics Co Ltd holding significant market share. However, the presence of several smaller, specialized companies fosters innovation. Market share analysis reveals that the top 5 players account for approximately xx% of the total market revenue in 2025. Innovation is driven by advancements in display technology (OLED, microLED), embedded AI capabilities (gesture recognition, personalized content), and improved connectivity (cloud integration, smart home ecosystems).
Regulatory frameworks, particularly regarding data privacy and safety standards, impact market growth. Product substitutes, such as traditional mirrors with added features, present competition, although the integration of smart functionalities offers a distinct competitive advantage. End-user trends point toward increasing demand from automotive and residential segments. M&A activities, while not extensive, contribute to market consolidation and technological integration. Recent M&A deal values have ranged from xx Million to xx Million, reflecting the strategic significance of acquiring specialized technologies and market access.
- Market Concentration: Top 5 players hold xx% market share (2025).
- Innovation Drivers: Advanced display tech, embedded AI, enhanced connectivity.
- Regulatory Impact: Data privacy and safety standards influence market dynamics.
- M&A Activity: Deal values range from xx Million to xx Million.
Smart Mirror Market Industry Trends & Insights
The Smart Mirror market is experiencing robust growth fueled by several key factors. The rising adoption of smart home technology and increased consumer demand for personalized experiences are driving market expansion. Technological advancements, such as the integration of augmented reality (AR) and virtual reality (VR) functionalities, are creating new applications and enhancing user engagement. The increasing penetration of smartphones and IoT devices further boosts market growth by creating seamless integration possibilities.
Furthermore, the automotive industry's transition towards enhanced driver-assistance systems and infotainment features fuels the demand for smart mirrors in vehicles. Consumer preferences shift towards convenience, personalization, and seamless integration with existing smart home ecosystems. Competitive dynamics are characterized by both established players leveraging their existing manufacturing capabilities and new entrants focusing on niche applications and innovative features. The market penetration rate is expected to reach xx% by 2033, driven by strong growth in the residential and automotive sectors.
Dominant Markets & Segments in Smart Mirror Market
The automotive segment dominates the Smart Mirror market, driven by the increasing demand for advanced driver-assistance systems and enhanced safety features. North America and Europe are leading regional markets due to high vehicle ownership rates and the early adoption of advanced automotive technologies. Within the component segmentation, the hardware segment holds the largest share, primarily due to the significant cost of display panels and other essential components.
Automotive Segment Dominance: Driven by ADAS and safety features.
Leading Regions: North America and Europe.
Largest Component Segment: Hardware, due to cost of display panels.
Key Drivers (North America): High vehicle ownership, early adoption of technology, strong R&D investment.
Key Drivers (Europe): Stringent safety regulations, increasing demand for luxury vehicles.
Residential Segment Growth: Driven by smart home integration and personal convenience.
Key Drivers (Residential): Rising disposable income, adoption of smart home technology, preference for personalized experiences.
Smart Mirror Market Product Developments
Recent product innovations focus on improving image quality, incorporating advanced sensors for gesture recognition and voice control, and enhancing connectivity features for seamless integration with smart home ecosystems. Smart mirrors are finding new applications beyond the traditional use cases, including healthcare (patient monitoring), retail (interactive displays), and fitness (personalized workout guidance). The competitive advantage lies in delivering superior image quality, intuitive user interfaces, and robust software integration. The market is witnessing a shift towards sleeker designs and larger display sizes to enhance user experience.
Report Scope & Segmentation Analysis
This report segments the Smart Mirror market by component (hardware, software, services) and end-user application (healthcare, automotive, retail and marketing, residential). The hardware segment includes displays, sensors, processors, and other electronic components. The software segment encompasses the operating system, applications, and data analytics. The services segment comprises installation, maintenance, and technical support.
The automotive segment is further divided into passenger cars and commercial vehicles. The retail and marketing segment is segmented based on application and scale (e.g., smart mirrors in retail stores, makeup counters). The residential segment is based on household size, income level, and location. Each segment’s market size, growth projections, and competitive dynamics are analyzed in detail within the full report.
Key Drivers of Smart Mirror Market Growth
Technological advancements in display technology, AI, and connectivity are significant drivers of market growth. Economic factors, such as rising disposable incomes and increased consumer spending on smart home technologies, contribute to the demand for smart mirrors. Favorable regulatory policies, particularly those promoting the adoption of intelligent transportation systems and smart city initiatives, further propel market expansion.
Challenges in the Smart Mirror Market Sector
High initial costs associated with advanced features and technology can limit market penetration. Supply chain disruptions, especially related to semiconductor components, can impact production and availability. Intense competition among existing players and the emergence of new entrants may lead to price wars and reduced profit margins. Furthermore, data privacy and security concerns are significant challenges that must be addressed to foster consumer trust and confidence.
Emerging Opportunities in Smart Mirror Market
The integration of augmented reality (AR) and virtual reality (VR) technologies presents significant opportunities for enhanced user experiences. Expanding into new markets, such as developing economies, offers potential for considerable market growth. Exploring niche applications in the healthcare, fitness, and hospitality sectors can create new avenues for innovation. The development of energy-efficient smart mirrors can attract environmentally conscious consumers.
Leading Players in the Smart Mirror Market Market
- Magna International Inc
- Electric Mirror Inc
- Samsung Electronics Co Ltd
- Ficosa (Panasonic)
- Japan Display Inc
- Gentex Corp
- Perseus Mirror
- Dension Ltd
- Murakami Corporation
Key Developments in Smart Mirror Market Industry
- June 2023: Gentex Corp partnered with Peugeot to equip its 9X8 Hybrid Hypercar with a state-of-the-art digital rearview mirror, showcasing advanced automotive applications.
- February 2023: Magna International Inc invested USD 470 Million to expand its operations, including a new battery enclosures facility, highlighting the growing demand for electric vehicle components.
Strategic Outlook for Smart Mirror Market Market
The Smart Mirror market is poised for continued strong growth, driven by technological advancements, increasing consumer adoption of smart home technologies, and the expanding demand in the automotive sector. The focus on enhanced user experiences, seamless integration with other smart devices, and the exploration of new applications across various industries will shape the market’s future trajectory. Opportunities exist for companies to capitalize on the growing demand for personalized, connected, and intelligent mirror solutions.
Smart Mirror Market Segmentation
-
1. Component
- 1.1. Hardware
- 1.2. Software
- 1.3. Services
-
2. End-User Application
- 2.1. Healthcare
- 2.2. Automotive
- 2.3. Retail and Marketing
- 2.4. Residential
Smart Mirror Market Segmentation By Geography
- 1. North America
- 2. Latin America
- 3. Europe
- 4. Asia Pacific
- 5. Middle East and Africa
Smart Mirror Market REPORT HIGHLIGHTS
| Aspects | Details |
|---|---|
| Study Period | 2019-2033 |
| Base Year | 2024 |
| Estimated Year | 2025 |
| Forecast Period | 2025-2033 |
| Historical Period | 2019-2024 |
| Growth Rate | CAGR of 11.43% from 2019-2033 |
| Segmentation |
|
Table of Contents
- 1. Introduction
- 1.1. Research Scope
- 1.2. Market Segmentation
- 1.3. Research Methodology
- 1.4. Definitions and Assumptions
- 2. Executive Summary
- 2.1. Introduction
- 3. Market Dynamics
- 3.1. Introduction
- 3.2. Market Drivers
- 3.2.1. Growing adoption of smart mirrors in the automotive sector; Growing investment in R&D to improve product portfolio
- 3.3. Market Restrains
- 3.3.1. Hight Cost and Lack of Awareness
- 3.4. Market Trends
- 3.4.1. Automotive Sector is Expected to Witness Significant Growth
- 4. Market Factor Analysis
- 4.1. Porters Five Forces
- 4.2. Supply/Value Chain
- 4.3. PESTEL analysis
- 4.4. Market Entropy
- 4.5. Patent/Trademark Analysis
- 5. Global Smart Mirror Market Analysis, Insights and Forecast, 2019-2031
- 5.1. Market Analysis, Insights and Forecast - by Component
- 5.1.1. Hardware
- 5.1.2. Software
- 5.1.3. Services
- 5.2. Market Analysis, Insights and Forecast - by End-User Application
- 5.2.1. Healthcare
- 5.2.2. Automotive
- 5.2.3. Retail and Marketing
- 5.2.4. Residential
- 5.3. Market Analysis, Insights and Forecast - by Region
- 5.3.1. North America
- 5.3.2. Latin America
- 5.3.3. Europe
- 5.3.4. Asia Pacific
- 5.3.5. Middle East and Africa
- 5.1. Market Analysis, Insights and Forecast - by Component
- 6. North America Smart Mirror Market Analysis, Insights and Forecast, 2019-2031
- 6.1. Market Analysis, Insights and Forecast - by Component
- 6.1.1. Hardware
- 6.1.2. Software
- 6.1.3. Services
- 6.2. Market Analysis, Insights and Forecast - by End-User Application
- 6.2.1. Healthcare
- 6.2.2. Automotive
- 6.2.3. Retail and Marketing
- 6.2.4. Residential
- 6.1. Market Analysis, Insights and Forecast - by Component
- 7. Latin America Smart Mirror Market Analysis, Insights and Forecast, 2019-2031
- 7.1. Market Analysis, Insights and Forecast - by Component
- 7.1.1. Hardware
- 7.1.2. Software
- 7.1.3. Services
- 7.2. Market Analysis, Insights and Forecast - by End-User Application
- 7.2.1. Healthcare
- 7.2.2. Automotive
- 7.2.3. Retail and Marketing
- 7.2.4. Residential
- 7.1. Market Analysis, Insights and Forecast - by Component
- 8. Europe Smart Mirror Market Analysis, Insights and Forecast, 2019-2031
- 8.1. Market Analysis, Insights and Forecast - by Component
- 8.1.1. Hardware
- 8.1.2. Software
- 8.1.3. Services
- 8.2. Market Analysis, Insights and Forecast - by End-User Application
- 8.2.1. Healthcare
- 8.2.2. Automotive
- 8.2.3. Retail and Marketing
- 8.2.4. Residential
- 8.1. Market Analysis, Insights and Forecast - by Component
- 9. Asia Pacific Smart Mirror Market Analysis, Insights and Forecast, 2019-2031
- 9.1. Market Analysis, Insights and Forecast - by Component
- 9.1.1. Hardware
- 9.1.2. Software
- 9.1.3. Services
- 9.2. Market Analysis, Insights and Forecast - by End-User Application
- 9.2.1. Healthcare
- 9.2.2. Automotive
- 9.2.3. Retail and Marketing
- 9.2.4. Residential
- 9.1. Market Analysis, Insights and Forecast - by Component
- 10. Middle East and Africa Smart Mirror Market Analysis, Insights and Forecast, 2019-2031
- 10.1. Market Analysis, Insights and Forecast - by Component
- 10.1.1. Hardware
- 10.1.2. Software
- 10.1.3. Services
- 10.2. Market Analysis, Insights and Forecast - by End-User Application
- 10.2.1. Healthcare
- 10.2.2. Automotive
- 10.2.3. Retail and Marketing
- 10.2.4. Residential
- 10.1. Market Analysis, Insights and Forecast - by Component
- 11. North America Smart Mirror Market Analysis, Insights and Forecast, 2019-2031
- 11.1. Market Analysis, Insights and Forecast - By Country/Sub-region
- 11.1.1 United States
- 11.1.2 Canada
- 11.1.3 Mexico
- 12. Europe Smart Mirror Market Analysis, Insights and Forecast, 2019-2031
- 12.1. Market Analysis, Insights and Forecast - By Country/Sub-region
- 12.1.1 Germany
- 12.1.2 United Kingdom
- 12.1.3 France
- 12.1.4 Spain
- 12.1.5 Italy
- 12.1.6 Spain
- 12.1.7 Belgium
- 12.1.8 Netherland
- 12.1.9 Nordics
- 12.1.10 Rest of Europe
- 13. Asia Pacific Smart Mirror Market Analysis, Insights and Forecast, 2019-2031
- 13.1. Market Analysis, Insights and Forecast - By Country/Sub-region
- 13.1.1 China
- 13.1.2 Japan
- 13.1.3 India
- 13.1.4 South Korea
- 13.1.5 Southeast Asia
- 13.1.6 Australia
- 13.1.7 Indonesia
- 13.1.8 Phillipes
- 13.1.9 Singapore
- 13.1.10 Thailandc
- 13.1.11 Rest of Asia Pacific
- 14. South America Smart Mirror Market Analysis, Insights and Forecast, 2019-2031
- 14.1. Market Analysis, Insights and Forecast - By Country/Sub-region
- 14.1.1 Brazil
- 14.1.2 Argentina
- 14.1.3 Peru
- 14.1.4 Chile
- 14.1.5 Colombia
- 14.1.6 Ecuador
- 14.1.7 Venezuela
- 14.1.8 Rest of South America
- 15. North America Smart Mirror Market Analysis, Insights and Forecast, 2019-2031
- 15.1. Market Analysis, Insights and Forecast - By Country/Sub-region
- 15.1.1 United States
- 15.1.2 Canada
- 15.1.3 Mexico
- 16. MEA Smart Mirror Market Analysis, Insights and Forecast, 2019-2031
- 16.1. Market Analysis, Insights and Forecast - By Country/Sub-region
- 16.1.1 United Arab Emirates
- 16.1.2 Saudi Arabia
- 16.1.3 South Africa
- 16.1.4 Rest of Middle East and Africa
- 17. Competitive Analysis
- 17.1. Global Market Share Analysis 2024
- 17.2. Company Profiles
- 17.2.1 Magna International Inc
- 17.2.1.1. Overview
- 17.2.1.2. Products
- 17.2.1.3. SWOT Analysis
- 17.2.1.4. Recent Developments
- 17.2.1.5. Financials (Based on Availability)
- 17.2.2 Electric Mirror Inc
- 17.2.2.1. Overview
- 17.2.2.2. Products
- 17.2.2.3. SWOT Analysis
- 17.2.2.4. Recent Developments
- 17.2.2.5. Financials (Based on Availability)
- 17.2.3 Samsung Electronics Co Ltd
- 17.2.3.1. Overview
- 17.2.3.2. Products
- 17.2.3.3. SWOT Analysis
- 17.2.3.4. Recent Developments
- 17.2.3.5. Financials (Based on Availability)
- 17.2.4 Ficosa (Panasonic)
- 17.2.4.1. Overview
- 17.2.4.2. Products
- 17.2.4.3. SWOT Analysis
- 17.2.4.4. Recent Developments
- 17.2.4.5. Financials (Based on Availability)
- 17.2.5 Japan Display Inc
- 17.2.5.1. Overview
- 17.2.5.2. Products
- 17.2.5.3. SWOT Analysis
- 17.2.5.4. Recent Developments
- 17.2.5.5. Financials (Based on Availability)
- 17.2.6 Gentex Corp
- 17.2.6.1. Overview
- 17.2.6.2. Products
- 17.2.6.3. SWOT Analysis
- 17.2.6.4. Recent Developments
- 17.2.6.5. Financials (Based on Availability)
- 17.2.7 Perseus Mirror
- 17.2.7.1. Overview
- 17.2.7.2. Products
- 17.2.7.3. SWOT Analysis
- 17.2.7.4. Recent Developments
- 17.2.7.5. Financials (Based on Availability)
- 17.2.8 Dension Ltd
- 17.2.8.1. Overview
- 17.2.8.2. Products
- 17.2.8.3. SWOT Analysis
- 17.2.8.4. Recent Developments
- 17.2.8.5. Financials (Based on Availability)
- 17.2.9 Murakami Corporation
- 17.2.9.1. Overview
- 17.2.9.2. Products
- 17.2.9.3. SWOT Analysis
- 17.2.9.4. Recent Developments
- 17.2.9.5. Financials (Based on Availability)
- 17.2.1 Magna International Inc
List of Figures
- Figure 1: Global Smart Mirror Market Revenue Breakdown (Million, %) by Region 2024 & 2032
- Figure 2: Global Smart Mirror Market Volume Breakdown (K Unit, %) by Region 2024 & 2032
- Figure 3: North America Smart Mirror Market Revenue (Million), by Country 2024 & 2032
- Figure 4: North America Smart Mirror Market Volume (K Unit), by Country 2024 & 2032
- Figure 5: North America Smart Mirror Market Revenue Share (%), by Country 2024 & 2032
- Figure 6: North America Smart Mirror Market Volume Share (%), by Country 2024 & 2032
- Figure 7: Europe Smart Mirror Market Revenue (Million), by Country 2024 & 2032
- Figure 8: Europe Smart Mirror Market Volume (K Unit), by Country 2024 & 2032
- Figure 9: Europe Smart Mirror Market Revenue Share (%), by Country 2024 & 2032
- Figure 10: Europe Smart Mirror Market Volume Share (%), by Country 2024 & 2032
- Figure 11: Asia Pacific Smart Mirror Market Revenue (Million), by Country 2024 & 2032
- Figure 12: Asia Pacific Smart Mirror Market Volume (K Unit), by Country 2024 & 2032
- Figure 13: Asia Pacific Smart Mirror Market Revenue Share (%), by Country 2024 & 2032
- Figure 14: Asia Pacific Smart Mirror Market Volume Share (%), by Country 2024 & 2032
- Figure 15: South America Smart Mirror Market Revenue (Million), by Country 2024 & 2032
- Figure 16: South America Smart Mirror Market Volume (K Unit), by Country 2024 & 2032
- Figure 17: South America Smart Mirror Market Revenue Share (%), by Country 2024 & 2032
- Figure 18: South America Smart Mirror Market Volume Share (%), by Country 2024 & 2032
- Figure 19: North America Smart Mirror Market Revenue (Million), by Country 2024 & 2032
- Figure 20: North America Smart Mirror Market Volume (K Unit), by Country 2024 & 2032
- Figure 21: North America Smart Mirror Market Revenue Share (%), by Country 2024 & 2032
- Figure 22: North America Smart Mirror Market Volume Share (%), by Country 2024 & 2032
- Figure 23: MEA Smart Mirror Market Revenue (Million), by Country 2024 & 2032
- Figure 24: MEA Smart Mirror Market Volume (K Unit), by Country 2024 & 2032
- Figure 25: MEA Smart Mirror Market Revenue Share (%), by Country 2024 & 2032
- Figure 26: MEA Smart Mirror Market Volume Share (%), by Country 2024 & 2032
- Figure 27: North America Smart Mirror Market Revenue (Million), by Component 2024 & 2032
- Figure 28: North America Smart Mirror Market Volume (K Unit), by Component 2024 & 2032
- Figure 29: North America Smart Mirror Market Revenue Share (%), by Component 2024 & 2032
- Figure 30: North America Smart Mirror Market Volume Share (%), by Component 2024 & 2032
- Figure 31: North America Smart Mirror Market Revenue (Million), by End-User Application 2024 & 2032
- Figure 32: North America Smart Mirror Market Volume (K Unit), by End-User Application 2024 & 2032
- Figure 33: North America Smart Mirror Market Revenue Share (%), by End-User Application 2024 & 2032
- Figure 34: North America Smart Mirror Market Volume Share (%), by End-User Application 2024 & 2032
- Figure 35: North America Smart Mirror Market Revenue (Million), by Country 2024 & 2032
- Figure 36: North America Smart Mirror Market Volume (K Unit), by Country 2024 & 2032
- Figure 37: North America Smart Mirror Market Revenue Share (%), by Country 2024 & 2032
- Figure 38: North America Smart Mirror Market Volume Share (%), by Country 2024 & 2032
- Figure 39: Latin America Smart Mirror Market Revenue (Million), by Component 2024 & 2032
- Figure 40: Latin America Smart Mirror Market Volume (K Unit), by Component 2024 & 2032
- Figure 41: Latin America Smart Mirror Market Revenue Share (%), by Component 2024 & 2032
- Figure 42: Latin America Smart Mirror Market Volume Share (%), by Component 2024 & 2032
- Figure 43: Latin America Smart Mirror Market Revenue (Million), by End-User Application 2024 & 2032
- Figure 44: Latin America Smart Mirror Market Volume (K Unit), by End-User Application 2024 & 2032
- Figure 45: Latin America Smart Mirror Market Revenue Share (%), by End-User Application 2024 & 2032
- Figure 46: Latin America Smart Mirror Market Volume Share (%), by End-User Application 2024 & 2032
- Figure 47: Latin America Smart Mirror Market Revenue (Million), by Country 2024 & 2032
- Figure 48: Latin America Smart Mirror Market Volume (K Unit), by Country 2024 & 2032
- Figure 49: Latin America Smart Mirror Market Revenue Share (%), by Country 2024 & 2032
- Figure 50: Latin America Smart Mirror Market Volume Share (%), by Country 2024 & 2032
- Figure 51: Europe Smart Mirror Market Revenue (Million), by Component 2024 & 2032
- Figure 52: Europe Smart Mirror Market Volume (K Unit), by Component 2024 & 2032
- Figure 53: Europe Smart Mirror Market Revenue Share (%), by Component 2024 & 2032
- Figure 54: Europe Smart Mirror Market Volume Share (%), by Component 2024 & 2032
- Figure 55: Europe Smart Mirror Market Revenue (Million), by End-User Application 2024 & 2032
- Figure 56: Europe Smart Mirror Market Volume (K Unit), by End-User Application 2024 & 2032
- Figure 57: Europe Smart Mirror Market Revenue Share (%), by End-User Application 2024 & 2032
- Figure 58: Europe Smart Mirror Market Volume Share (%), by End-User Application 2024 & 2032
- Figure 59: Europe Smart Mirror Market Revenue (Million), by Country 2024 & 2032
- Figure 60: Europe Smart Mirror Market Volume (K Unit), by Country 2024 & 2032
- Figure 61: Europe Smart Mirror Market Revenue Share (%), by Country 2024 & 2032
- Figure 62: Europe Smart Mirror Market Volume Share (%), by Country 2024 & 2032
- Figure 63: Asia Pacific Smart Mirror Market Revenue (Million), by Component 2024 & 2032
- Figure 64: Asia Pacific Smart Mirror Market Volume (K Unit), by Component 2024 & 2032
- Figure 65: Asia Pacific Smart Mirror Market Revenue Share (%), by Component 2024 & 2032
- Figure 66: Asia Pacific Smart Mirror Market Volume Share (%), by Component 2024 & 2032
- Figure 67: Asia Pacific Smart Mirror Market Revenue (Million), by End-User Application 2024 & 2032
- Figure 68: Asia Pacific Smart Mirror Market Volume (K Unit), by End-User Application 2024 & 2032
- Figure 69: Asia Pacific Smart Mirror Market Revenue Share (%), by End-User Application 2024 & 2032
- Figure 70: Asia Pacific Smart Mirror Market Volume Share (%), by End-User Application 2024 & 2032
- Figure 71: Asia Pacific Smart Mirror Market Revenue (Million), by Country 2024 & 2032
- Figure 72: Asia Pacific Smart Mirror Market Volume (K Unit), by Country 2024 & 2032
- Figure 73: Asia Pacific Smart Mirror Market Revenue Share (%), by Country 2024 & 2032
- Figure 74: Asia Pacific Smart Mirror Market Volume Share (%), by Country 2024 & 2032
- Figure 75: Middle East and Africa Smart Mirror Market Revenue (Million), by Component 2024 & 2032
- Figure 76: Middle East and Africa Smart Mirror Market Volume (K Unit), by Component 2024 & 2032
- Figure 77: Middle East and Africa Smart Mirror Market Revenue Share (%), by Component 2024 & 2032
- Figure 78: Middle East and Africa Smart Mirror Market Volume Share (%), by Component 2024 & 2032
- Figure 79: Middle East and Africa Smart Mirror Market Revenue (Million), by End-User Application 2024 & 2032
- Figure 80: Middle East and Africa Smart Mirror Market Volume (K Unit), by End-User Application 2024 & 2032
- Figure 81: Middle East and Africa Smart Mirror Market Revenue Share (%), by End-User Application 2024 & 2032
- Figure 82: Middle East and Africa Smart Mirror Market Volume Share (%), by End-User Application 2024 & 2032
- Figure 83: Middle East and Africa Smart Mirror Market Revenue (Million), by Country 2024 & 2032
- Figure 84: Middle East and Africa Smart Mirror Market Volume (K Unit), by Country 2024 & 2032
- Figure 85: Middle East and Africa Smart Mirror Market Revenue Share (%), by Country 2024 & 2032
- Figure 86: Middle East and Africa Smart Mirror Market Volume Share (%), by Country 2024 & 2032
List of Tables
- Table 1: Global Smart Mirror Market Revenue Million Forecast, by Region 2019 & 2032
- Table 2: Global Smart Mirror Market Volume K Unit Forecast, by Region 2019 & 2032
- Table 3: Global Smart Mirror Market Revenue Million Forecast, by Component 2019 & 2032
- Table 4: Global Smart Mirror Market Volume K Unit Forecast, by Component 2019 & 2032
- Table 5: Global Smart Mirror Market Revenue Million Forecast, by End-User Application 2019 & 2032
- Table 6: Global Smart Mirror Market Volume K Unit Forecast, by End-User Application 2019 & 2032
- Table 7: Global Smart Mirror Market Revenue Million Forecast, by Region 2019 & 2032
- Table 8: Global Smart Mirror Market Volume K Unit Forecast, by Region 2019 & 2032
- Table 9: Global Smart Mirror Market Revenue Million Forecast, by Country 2019 & 2032
- Table 10: Global Smart Mirror Market Volume K Unit Forecast, by Country 2019 & 2032
- Table 11: United States Smart Mirror Market Revenue (Million) Forecast, by Application 2019 & 2032
- Table 12: United States Smart Mirror Market Volume (K Unit) Forecast, by Application 2019 & 2032
- Table 13: Canada Smart Mirror Market Revenue (Million) Forecast, by Application 2019 & 2032
- Table 14: Canada Smart Mirror Market Volume (K Unit) Forecast, by Application 2019 & 2032
- Table 15: Mexico Smart Mirror Market Revenue (Million) Forecast, by Application 2019 & 2032
- Table 16: Mexico Smart Mirror Market Volume (K Unit) Forecast, by Application 2019 & 2032
- Table 17: Global Smart Mirror Market Revenue Million Forecast, by Country 2019 & 2032
- Table 18: Global Smart Mirror Market Volume K Unit Forecast, by Country 2019 & 2032
- Table 19: Germany Smart Mirror Market Revenue (Million) Forecast, by Application 2019 & 2032
- Table 20: Germany Smart Mirror Market Volume (K Unit) Forecast, by Application 2019 & 2032
- Table 21: United Kingdom Smart Mirror Market Revenue (Million) Forecast, by Application 2019 & 2032
- Table 22: United Kingdom Smart Mirror Market Volume (K Unit) Forecast, by Application 2019 & 2032
- Table 23: France Smart Mirror Market Revenue (Million) Forecast, by Application 2019 & 2032
- Table 24: France Smart Mirror Market Volume (K Unit) Forecast, by Application 2019 & 2032
- Table 25: Spain Smart Mirror Market Revenue (Million) Forecast, by Application 2019 & 2032
- Table 26: Spain Smart Mirror Market Volume (K Unit) Forecast, by Application 2019 & 2032
- Table 27: Italy Smart Mirror Market Revenue (Million) Forecast, by Application 2019 & 2032
- Table 28: Italy Smart Mirror Market Volume (K Unit) Forecast, by Application 2019 & 2032
- Table 29: Spain Smart Mirror Market Revenue (Million) Forecast, by Application 2019 & 2032
- Table 30: Spain Smart Mirror Market Volume (K Unit) Forecast, by Application 2019 & 2032
- Table 31: Belgium Smart Mirror Market Revenue (Million) Forecast, by Application 2019 & 2032
- Table 32: Belgium Smart Mirror Market Volume (K Unit) Forecast, by Application 2019 & 2032
- Table 33: Netherland Smart Mirror Market Revenue (Million) Forecast, by Application 2019 & 2032
- Table 34: Netherland Smart Mirror Market Volume (K Unit) Forecast, by Application 2019 & 2032
- Table 35: Nordics Smart Mirror Market Revenue (Million) Forecast, by Application 2019 & 2032
- Table 36: Nordics Smart Mirror Market Volume (K Unit) Forecast, by Application 2019 & 2032
- Table 37: Rest of Europe Smart Mirror Market Revenue (Million) Forecast, by Application 2019 & 2032
- Table 38: Rest of Europe Smart Mirror Market Volume (K Unit) Forecast, by Application 2019 & 2032
- Table 39: Global Smart Mirror Market Revenue Million Forecast, by Country 2019 & 2032
- Table 40: Global Smart Mirror Market Volume K Unit Forecast, by Country 2019 & 2032
- Table 41: China Smart Mirror Market Revenue (Million) Forecast, by Application 2019 & 2032
- Table 42: China Smart Mirror Market Volume (K Unit) Forecast, by Application 2019 & 2032
- Table 43: Japan Smart Mirror Market Revenue (Million) Forecast, by Application 2019 & 2032
- Table 44: Japan Smart Mirror Market Volume (K Unit) Forecast, by Application 2019 & 2032
- Table 45: India Smart Mirror Market Revenue (Million) Forecast, by Application 2019 & 2032
- Table 46: India Smart Mirror Market Volume (K Unit) Forecast, by Application 2019 & 2032
- Table 47: South Korea Smart Mirror Market Revenue (Million) Forecast, by Application 2019 & 2032
- Table 48: South Korea Smart Mirror Market Volume (K Unit) Forecast, by Application 2019 & 2032
- Table 49: Southeast Asia Smart Mirror Market Revenue (Million) Forecast, by Application 2019 & 2032
- Table 50: Southeast Asia Smart Mirror Market Volume (K Unit) Forecast, by Application 2019 & 2032
- Table 51: Australia Smart Mirror Market Revenue (Million) Forecast, by Application 2019 & 2032
- Table 52: Australia Smart Mirror Market Volume (K Unit) Forecast, by Application 2019 & 2032
- Table 53: Indonesia Smart Mirror Market Revenue (Million) Forecast, by Application 2019 & 2032
- Table 54: Indonesia Smart Mirror Market Volume (K Unit) Forecast, by Application 2019 & 2032
- Table 55: Phillipes Smart Mirror Market Revenue (Million) Forecast, by Application 2019 & 2032
- Table 56: Phillipes Smart Mirror Market Volume (K Unit) Forecast, by Application 2019 & 2032
- Table 57: Singapore Smart Mirror Market Revenue (Million) Forecast, by Application 2019 & 2032
- Table 58: Singapore Smart Mirror Market Volume (K Unit) Forecast, by Application 2019 & 2032
- Table 59: Thailandc Smart Mirror Market Revenue (Million) Forecast, by Application 2019 & 2032
- Table 60: Thailandc Smart Mirror Market Volume (K Unit) Forecast, by Application 2019 & 2032
- Table 61: Rest of Asia Pacific Smart Mirror Market Revenue (Million) Forecast, by Application 2019 & 2032
- Table 62: Rest of Asia Pacific Smart Mirror Market Volume (K Unit) Forecast, by Application 2019 & 2032
- Table 63: Global Smart Mirror Market Revenue Million Forecast, by Country 2019 & 2032
- Table 64: Global Smart Mirror Market Volume K Unit Forecast, by Country 2019 & 2032
- Table 65: Brazil Smart Mirror Market Revenue (Million) Forecast, by Application 2019 & 2032
- Table 66: Brazil Smart Mirror Market Volume (K Unit) Forecast, by Application 2019 & 2032
- Table 67: Argentina Smart Mirror Market Revenue (Million) Forecast, by Application 2019 & 2032
- Table 68: Argentina Smart Mirror Market Volume (K Unit) Forecast, by Application 2019 & 2032
- Table 69: Peru Smart Mirror Market Revenue (Million) Forecast, by Application 2019 & 2032
- Table 70: Peru Smart Mirror Market Volume (K Unit) Forecast, by Application 2019 & 2032
- Table 71: Chile Smart Mirror Market Revenue (Million) Forecast, by Application 2019 & 2032
- Table 72: Chile Smart Mirror Market Volume (K Unit) Forecast, by Application 2019 & 2032
- Table 73: Colombia Smart Mirror Market Revenue (Million) Forecast, by Application 2019 & 2032
- Table 74: Colombia Smart Mirror Market Volume (K Unit) Forecast, by Application 2019 & 2032
- Table 75: Ecuador Smart Mirror Market Revenue (Million) Forecast, by Application 2019 & 2032
- Table 76: Ecuador Smart Mirror Market Volume (K Unit) Forecast, by Application 2019 & 2032
- Table 77: Venezuela Smart Mirror Market Revenue (Million) Forecast, by Application 2019 & 2032
- Table 78: Venezuela Smart Mirror Market Volume (K Unit) Forecast, by Application 2019 & 2032
- Table 79: Rest of South America Smart Mirror Market Revenue (Million) Forecast, by Application 2019 & 2032
- Table 80: Rest of South America Smart Mirror Market Volume (K Unit) Forecast, by Application 2019 & 2032
- Table 81: Global Smart Mirror Market Revenue Million Forecast, by Country 2019 & 2032
- Table 82: Global Smart Mirror Market Volume K Unit Forecast, by Country 2019 & 2032
- Table 83: United States Smart Mirror Market Revenue (Million) Forecast, by Application 2019 & 2032
- Table 84: United States Smart Mirror Market Volume (K Unit) Forecast, by Application 2019 & 2032
- Table 85: Canada Smart Mirror Market Revenue (Million) Forecast, by Application 2019 & 2032
- Table 86: Canada Smart Mirror Market Volume (K Unit) Forecast, by Application 2019 & 2032
- Table 87: Mexico Smart Mirror Market Revenue (Million) Forecast, by Application 2019 & 2032
- Table 88: Mexico Smart Mirror Market Volume (K Unit) Forecast, by Application 2019 & 2032
- Table 89: Global Smart Mirror Market Revenue Million Forecast, by Country 2019 & 2032
- Table 90: Global Smart Mirror Market Volume K Unit Forecast, by Country 2019 & 2032
- Table 91: United Arab Emirates Smart Mirror Market Revenue (Million) Forecast, by Application 2019 & 2032
- Table 92: United Arab Emirates Smart Mirror Market Volume (K Unit) Forecast, by Application 2019 & 2032
- Table 93: Saudi Arabia Smart Mirror Market Revenue (Million) Forecast, by Application 2019 & 2032
- Table 94: Saudi Arabia Smart Mirror Market Volume (K Unit) Forecast, by Application 2019 & 2032
- Table 95: South Africa Smart Mirror Market Revenue (Million) Forecast, by Application 2019 & 2032
- Table 96: South Africa Smart Mirror Market Volume (K Unit) Forecast, by Application 2019 & 2032
- Table 97: Rest of Middle East and Africa Smart Mirror Market Revenue (Million) Forecast, by Application 2019 & 2032
- Table 98: Rest of Middle East and Africa Smart Mirror Market Volume (K Unit) Forecast, by Application 2019 & 2032
- Table 99: Global Smart Mirror Market Revenue Million Forecast, by Component 2019 & 2032
- Table 100: Global Smart Mirror Market Volume K Unit Forecast, by Component 2019 & 2032
- Table 101: Global Smart Mirror Market Revenue Million Forecast, by End-User Application 2019 & 2032
- Table 102: Global Smart Mirror Market Volume K Unit Forecast, by End-User Application 2019 & 2032
- Table 103: Global Smart Mirror Market Revenue Million Forecast, by Country 2019 & 2032
- Table 104: Global Smart Mirror Market Volume K Unit Forecast, by Country 2019 & 2032
- Table 105: Global Smart Mirror Market Revenue Million Forecast, by Component 2019 & 2032
- Table 106: Global Smart Mirror Market Volume K Unit Forecast, by Component 2019 & 2032
- Table 107: Global Smart Mirror Market Revenue Million Forecast, by End-User Application 2019 & 2032
- Table 108: Global Smart Mirror Market Volume K Unit Forecast, by End-User Application 2019 & 2032
- Table 109: Global Smart Mirror Market Revenue Million Forecast, by Country 2019 & 2032
- Table 110: Global Smart Mirror Market Volume K Unit Forecast, by Country 2019 & 2032
- Table 111: Global Smart Mirror Market Revenue Million Forecast, by Component 2019 & 2032
- Table 112: Global Smart Mirror Market Volume K Unit Forecast, by Component 2019 & 2032
- Table 113: Global Smart Mirror Market Revenue Million Forecast, by End-User Application 2019 & 2032
- Table 114: Global Smart Mirror Market Volume K Unit Forecast, by End-User Application 2019 & 2032
- Table 115: Global Smart Mirror Market Revenue Million Forecast, by Country 2019 & 2032
- Table 116: Global Smart Mirror Market Volume K Unit Forecast, by Country 2019 & 2032
- Table 117: Global Smart Mirror Market Revenue Million Forecast, by Component 2019 & 2032
- Table 118: Global Smart Mirror Market Volume K Unit Forecast, by Component 2019 & 2032
- Table 119: Global Smart Mirror Market Revenue Million Forecast, by End-User Application 2019 & 2032
- Table 120: Global Smart Mirror Market Volume K Unit Forecast, by End-User Application 2019 & 2032
- Table 121: Global Smart Mirror Market Revenue Million Forecast, by Country 2019 & 2032
- Table 122: Global Smart Mirror Market Volume K Unit Forecast, by Country 2019 & 2032
- Table 123: Global Smart Mirror Market Revenue Million Forecast, by Component 2019 & 2032
- Table 124: Global Smart Mirror Market Volume K Unit Forecast, by Component 2019 & 2032
- Table 125: Global Smart Mirror Market Revenue Million Forecast, by End-User Application 2019 & 2032
- Table 126: Global Smart Mirror Market Volume K Unit Forecast, by End-User Application 2019 & 2032
- Table 127: Global Smart Mirror Market Revenue Million Forecast, by Country 2019 & 2032
- Table 128: Global Smart Mirror Market Volume K Unit Forecast, by Country 2019 & 2032
Frequently Asked Questions
1. What is the projected Compound Annual Growth Rate (CAGR) of the Smart Mirror Market?
The projected CAGR is approximately 11.43%.
2. Which companies are prominent players in the Smart Mirror Market?
Key companies in the market include Magna International Inc, Electric Mirror Inc, Samsung Electronics Co Ltd, Ficosa (Panasonic), Japan Display Inc, Gentex Corp, Perseus Mirror, Dension Ltd, Murakami Corporation.
3. What are the main segments of the Smart Mirror Market?
The market segments include Component, End-User Application.
4. Can you provide details about the market size?
The market size is estimated to be USD 4.35 Million as of 2022.
5. What are some drivers contributing to market growth?
Growing adoption of smart mirrors in the automotive sector; Growing investment in R&D to improve product portfolio.
6. What are the notable trends driving market growth?
Automotive Sector is Expected to Witness Significant Growth.
7. Are there any restraints impacting market growth?
Hight Cost and Lack of Awareness.
8. Can you provide examples of recent developments in the market?
June 2023 - Gentex Corp equipped Peugeot's all-new 9X8 Hybrid Hypercar with an intelligent rear vision system designed to optimize the vehicle's rearward view during the upcoming 24 hours of Le Mans and for the Fédération Internationale de l'Automobile (FIA) World Endurance Championship (WEC), With a focus on performance and safety, Peugeot Sport and Gentex partnered to implement a state-of-the-art digital rearview mirror that will enhance the driver's visibility and situational awareness during the race.
9. What pricing options are available for accessing the report?
Pricing options include single-user, multi-user, and enterprise licenses priced at USD 4750, USD 5250, and USD 8750 respectively.
10. Is the market size provided in terms of value or volume?
The market size is provided in terms of value, measured in Million and volume, measured in K Unit.
11. Are there any specific market keywords associated with the report?
Yes, the market keyword associated with the report is "Smart Mirror Market," which aids in identifying and referencing the specific market segment covered.
12. How do I determine which pricing option suits my needs best?
The pricing options vary based on user requirements and access needs. Individual users may opt for single-user licenses, while businesses requiring broader access may choose multi-user or enterprise licenses for cost-effective access to the report.
13. Are there any additional resources or data provided in the Smart Mirror Market report?
While the report offers comprehensive insights, it's advisable to review the specific contents or supplementary materials provided to ascertain if additional resources or data are available.
14. How can I stay updated on further developments or reports in the Smart Mirror Market?
To stay informed about further developments, trends, and reports in the Smart Mirror Market, consider subscribing to industry newsletters, following relevant companies and organizations, or regularly checking reputable industry news sources and publications.
Methodology
Step 1 - Identification of Relevant Samples Size from Population Database


Step 2 - Approaches for Defining Global Market Size (Value, Volume* & Price*)

Note*: In applicable scenarios
Step 3 - Data Sources
Primary Research
- Web Analytics
- Survey Reports
- Research Institute
- Latest Research Reports
- Opinion Leaders
Secondary Research
- Annual Reports
- White Paper
- Latest Press Release
- Industry Association
- Paid Database
- Investor Presentations

Step 4 - Data Triangulation
Involves using different sources of information in order to increase the validity of a study
These sources are likely to be stakeholders in a program - participants, other researchers, program staff, other community members, and so on.
Then we put all data in single framework & apply various statistical tools to find out the dynamic on the market.
During the analysis stage, feedback from the stakeholder groups would be compared to determine areas of agreement as well as areas of divergence


