
Key Insights
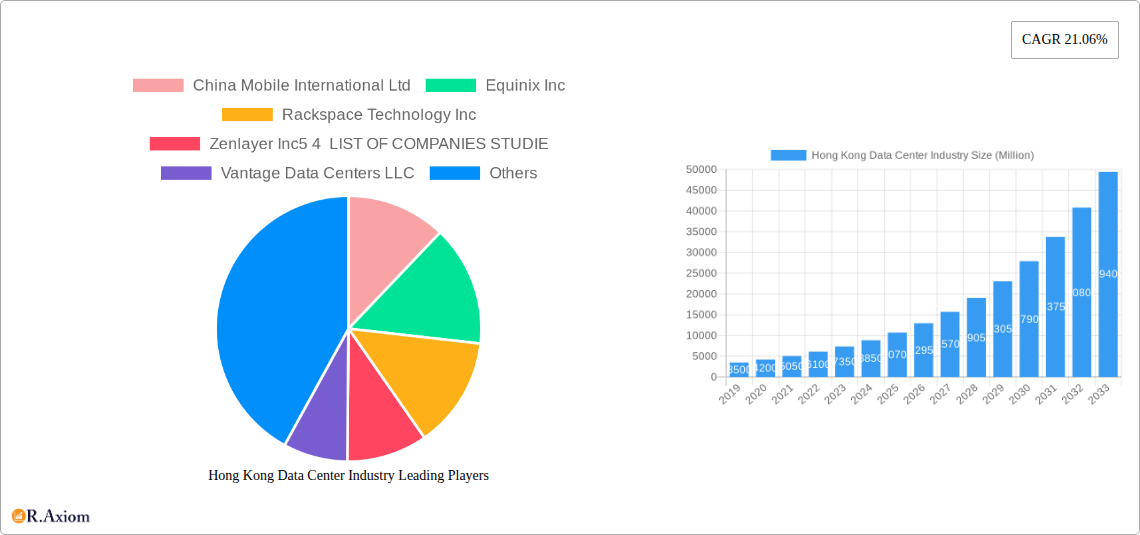
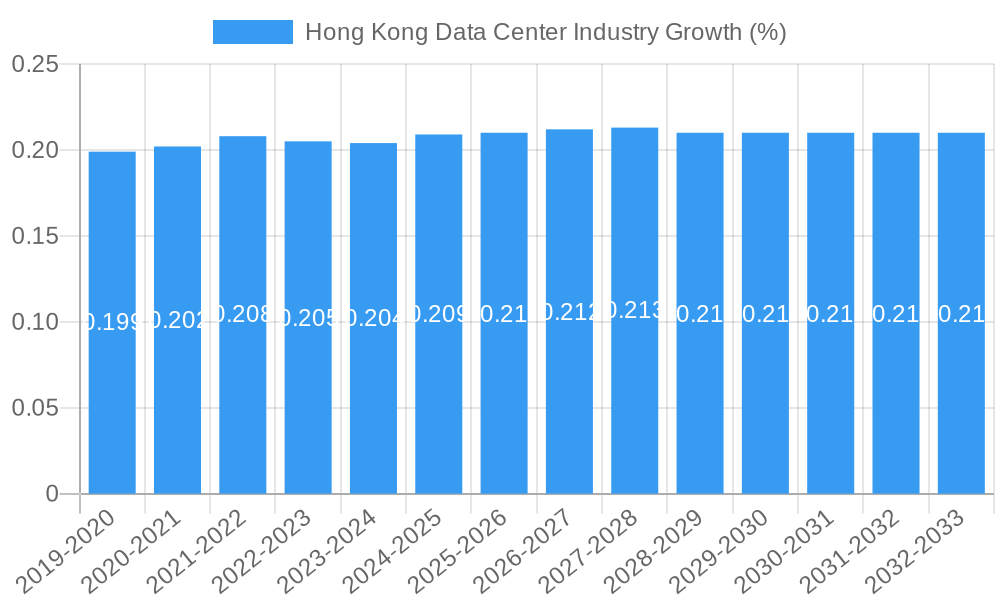
The Hong Kong Data Center Industry is poised for significant expansion, projected to reach a substantial market size in the coming years, driven by a robust Compound Annual Growth Rate (CAGR) of 21.06%. This impressive growth is underpinned by escalating demand for digital infrastructure across various sectors, including BFSI, Cloud, E-Commerce, and Government. The region's strategic location, advanced connectivity, and pro-business environment continue to attract substantial investment, fostering the development of hyperscale and retail colocation facilities. Key market drivers include the rapid adoption of cloud computing services, the proliferation of data-intensive applications, and the increasing need for secure and reliable data storage solutions to support digital transformation initiatives. Furthermore, the government's commitment to fostering innovation and technology, coupled with a strong financial services sector, creates a fertile ground for data center development.
The industry segmentation reveals a dynamic landscape, with significant activity expected in key hotspots like Chai Wan, Shatin, and Tseun Wan, alongside emerging opportunities in Tseung Kwan O and the rest of Hong Kong. The demand for larger data center footprints, including Massive and Mega sizes, indicates a trend towards consolidation and the creation of hyperscale facilities to meet the growing needs of global cloud providers and enterprises. Moreover, the focus on higher tier classifications (Tier 3 and Tier 4) signifies a commitment to resilience, redundancy, and uptime, crucial for mission-critical operations. While robust growth is anticipated, potential restraints such as rising land acquisition costs and the need for substantial power infrastructure could pose challenges. However, strategic partnerships, technological advancements in cooling and power efficiency, and government incentives are expected to mitigate these issues, ensuring a sustained upward trajectory for the Hong Kong data center market.
Comprehensive Report on the Hong Kong Data Center Industry: Market Dynamics, Growth Drivers, and Future Outlook (2019-2033)
This in-depth report provides a detailed analysis of the Hong Kong Data Center Industry, covering market concentration, evolving trends, dominant segments, product developments, and strategic outlook. With a study period spanning from 2019 to 2033, and a base and estimated year of 2025, this report offers critical insights for industry stakeholders, investors, and strategists navigating this dynamic market. We examine key players, technological advancements, regulatory landscapes, and emerging opportunities to equip you with actionable intelligence.
Hong Kong Data Center Industry Market Concentration & Innovation
The Hong Kong Data Center industry is characterized by a growing market concentration driven by significant M&A activities and strategic investments. Major players like Equinix Inc., Digital Realty Trust Inc., and Vantage Data Centers LLC are actively expanding their footprints, leading to increased consolidation. Innovation is primarily fueled by the escalating demand for hyperscale colocation and advanced infrastructure to support cloud computing, AI, and Big Data analytics. Regulatory frameworks, while generally supportive, focus on data sovereignty and cybersecurity, influencing operational standards. Product substitutes are limited, with the unique demand for robust, high-availability data center services being paramount. End-user trends reveal a surge in demand from BFSI, Cloud, and E-Commerce sectors. M&A deal values are substantial, with significant recent activity reflecting the industry's maturation. For instance, the potential USD 11 Billion sale of Global Switch Holdings Limited's business to entities like EQR, PAG, KKR, Gaw Capital, and Stonepeak underscores the scale of transactions.
Hong Kong Data Center Industry Industry Trends & Insights
The Hong Kong Data Center industry is experiencing robust growth, propelled by several key trends. The increasing adoption of cloud services by enterprises across sectors like BFSI, E-Commerce, and Media & Entertainment is a primary growth driver. This surge in digital transformation necessitates advanced, scalable data center infrastructure. Technological disruptions, including the rise of AI, IoT, and 5G, are further accelerating demand for high-performance computing and low-latency connectivity, pushing the boundaries of data center design and operations. Consumer preferences are shifting towards more efficient, secure, and sustainable data center solutions, with a growing emphasis on green energy initiatives and advanced cooling technologies. Competitive dynamics are intensifying, with both established global players and emerging regional providers vying for market share. The market penetration of advanced data center services is projected to rise significantly. Key metrics like Compound Annual Growth Rate (CAGR) are expected to remain strong throughout the forecast period, driven by ongoing digital transformation initiatives across the Asia-Pacific region. The strategic location of Hong Kong as a gateway to mainland China and Southeast Asia also plays a crucial role in attracting international hyperscalers and cloud providers.
Dominant Markets & Segments in Hong Kong Data Center Industry
The Hong Kong Data Center industry demonstrates distinct dominance across various segments, driven by robust economic policies and advanced infrastructure.
- Hotspots: Chai Wan and Tseung Kwan O emerge as leading hotspots due to their strategic locations, excellent connectivity, and proximity to business hubs. These areas offer prime real estate and established infrastructure, attracting significant investments for large and mega-sized data centers.
- Data Center Size: Mega and Large data centers are dominating the market. This is a direct consequence of the increasing demand from hyperscalers and large enterprises requiring massive computing power and storage capacities. The trend is driven by the need for economies of scale and the deployment of advanced technologies like AI and Big Data analytics.
- Tier Type: Tier 3 and Tier 4 data centers are the most sought-after. This preference is fueled by the critical need for high availability, reliability, and redundancy, especially for end-users in the BFSI, Cloud, and Government sectors where downtime can lead to substantial financial and reputational damage.
- Absorption: While Non-Utilized capacity exists, the Absorption rate for modern, high-spec facilities remains strong, indicating a healthy demand-supply dynamic. The rapid growth in cloud adoption and digital services is continuously driving up utilization rates for state-of-the-art data centers.
- Colocation Type: Hyperscale colocation is witnessing the most significant growth, driven by major cloud providers expanding their presence. Wholesale colocation also remains a strong segment, catering to large enterprises requiring dedicated infrastructure. Retail colocation serves a broader market of smaller businesses.
- End User: The BFSI, Cloud, and E-Commerce sectors are the dominant end-users, accounting for a substantial portion of data center demand. Their continuous need for processing power, data storage, and secure infrastructure fuels market growth. The Telecom sector also plays a vital role as an infrastructure provider and end-user.
Hong Kong Data Center Industry Product Developments
Product developments in the Hong Kong Data Center industry are focused on enhancing efficiency, scalability, and sustainability. Innovations include advanced cooling systems for higher power densities, modular data center designs for rapid deployment, and AI-driven management platforms for optimized operations. The competitive advantage lies in offering hyperscale capabilities with low latency, robust security features, and significant power redundancy. Market fit is achieved by aligning these technological advancements with the burgeoning demands of cloud providers, financial institutions, and e-commerce giants for high-performance, reliable data storage and processing solutions.
Report Scope & Segmentation Analysis
This report meticulously segments the Hong Kong Data Center Industry across critical parameters to provide a granular understanding of the market. Hotspot Analysis: We examine Chai Wan, Shatin, Tseun Wan, Tseung Kwan O, and Rest of Hong Kong, detailing their unique infrastructure, connectivity, and investment landscapes, with growth projections for each area. Data Center Size Segmentation: The analysis covers Small, Medium, Large, Massive, and Mega data centers, assessing their market share, demand drivers, and future capacity needs. Tier Type Analysis: We dissect the market for Tier 1 and 2, Tier 3, and Tier 4 data centers, highlighting the increasing preference for higher tiers and their implications for end-user reliability. Absorption Analysis: The report evaluates Non-Utilized capacity and market absorption rates, providing insights into market equilibrium and investment attractiveness. Colocation Type Segmentation: We detail the dominance of Hyperscale, Retail, and Wholesale colocation, projecting their growth trajectories based on evolving enterprise needs. End User Segmentation: The analysis covers BFSI, Cloud, E-Commerce, Government, Manufacturing, Media & Entertainment, Telecom, and Other End User segments, quantifying their current and future data center space requirements.
Key Drivers of Hong Kong Data Center Industry Growth
The Hong Kong Data Center Industry's growth is propelled by several significant factors. The relentless expansion of cloud computing and digital services, particularly from hyperscalers and large enterprises, is a primary driver. Hong Kong's strategic geographical location as a gateway to mainland China and Southeast Asia, coupled with its robust digital infrastructure and favorable business environment, attracts substantial foreign investment. Furthermore, the increasing adoption of advanced technologies like AI, Big Data, and IoT by various industries, including BFSI and E-Commerce, necessitates higher processing power and storage capabilities. Government initiatives promoting digital transformation and smart city development also contribute to the sustained demand for data center capacity.
Challenges in the Hong Kong Data Center Industry Sector
Despite its strong growth trajectory, the Hong Kong Data Center industry faces several challenges. Land scarcity and high real estate costs present significant hurdles for new developments, particularly for large-scale facilities. The stringent regulatory environment, while ensuring data security and compliance, can also introduce complexities and lead times for project approvals. Furthermore, securing sufficient and sustainable power supply to meet the ever-increasing energy demands of data centers is a critical concern. Intense competition from regional data center hubs and the need for continuous technological upgrades to remain competitive also pose ongoing challenges for industry players.
Emerging Opportunities in Hong Kong Data Center Industry
Emerging opportunities within the Hong Kong Data Center industry are multifaceted. The growing demand for edge computing solutions to support low-latency applications presents a significant growth avenue. The increasing focus on sustainability and green data centers opens up opportunities for providers investing in renewable energy and energy-efficient technologies. Furthermore, the expansion of hyperscale cloud providers into the region continues to drive demand for large-scale colocation facilities. The development of specialized data centers for emerging technologies like AI and blockchain also represents a promising niche market.
Leading Players in the Hong Kong Data Center Industry Market
- China Mobile International Ltd
- Equinix Inc.
- Rackspace Technology Inc.
- Zenlayer Inc.
- Vantage Data Centers LLC
- SuneVision Holdings Ltd
- Digital Realty Trust Inc.
- AirTrunk Operating Pty Ltd
- Hostdime
- BDx Data Center Pte Ltd
- Global Switch Holdings Limited
- NTT Ltd.
Key Developments in Hong Kong Data Center Industry Industry
- November 2022: A company announced the opening of its new regional office in Kowloon, Hong Kong, to strengthen expansion and cater to engineering, construction, and sales needs in the APAC region.
- November 2022: BDx Data Center Pte Ltd announced the launch of BDx Indonesia, following a USD 300 Million joint venture agreement with PT Indosat Tbk and PT Aplikanusa Lintasarta.
- August 2022: Global Switch Holdings Limited announced plans of selling its USD 11 Billion business, with potential buyers including EQR, PAG, KKR, Gaw Capital, and Stonepeak.
Strategic Outlook for Hong Kong Data Center Industry Market
The strategic outlook for the Hong Kong Data Center industry remains exceptionally positive, driven by ongoing digital transformation and its strategic importance in the Asia-Pacific region. Continued investment in hyperscale and edge data center infrastructure will be crucial to meet the escalating demands of cloud, AI, and IoT applications. Emphasis on sustainability and the adoption of green energy solutions will not only meet regulatory requirements but also present a competitive advantage. The region's robust connectivity and supportive government policies are expected to attract further international investment, solidifying Hong Kong's position as a leading data center hub. Strategic partnerships and M&A activities will likely continue as companies seek to expand their capabilities and market reach.
Hong Kong Data Center Industry Segmentation
-
1. Hotspot
- 1.1. Chai Wan
- 1.2. Shatin
- 1.3. Tseun Wan
- 1.4. Tseung Kwan O
- 1.5. Rest of Hong Kong
-
2. Data Center Size
- 2.1. Large
- 2.2. Massive
- 2.3. Medium
- 2.4. Mega
- 2.5. Small
-
3. Tier Type
- 3.1. Tier 1 and 2
- 3.2. Tier 3
- 3.3. Tier 4
-
4. Absorption
- 4.1. Non-Utilized
-
5. Colocation Type
- 5.1. Hyperscale
- 5.2. Retail
- 5.3. Wholesale
-
6. End User
- 6.1. BFSI
- 6.2. Cloud
- 6.3. E-Commerce
- 6.4. Government
- 6.5. Manufacturing
- 6.6. Media & Entertainment
- 6.7. Telecom
- 6.8. Other End User
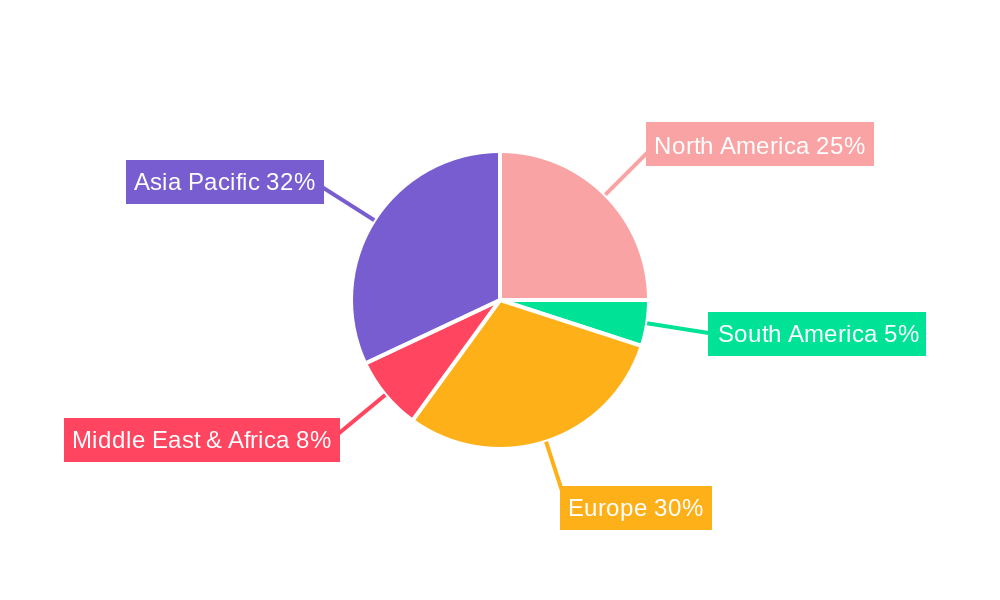
Hong Kong Data Center Industry Segmentation By Geography
-
1. North America
- 1.1. United States
- 1.2. Canada
- 1.3. Mexico
-
2. South America
- 2.1. Brazil
- 2.2. Argentina
- 2.3. Rest of South America
-
3. Europe
- 3.1. United Kingdom
- 3.2. Germany
- 3.3. France
- 3.4. Italy
- 3.5. Spain
- 3.6. Russia
- 3.7. Benelux
- 3.8. Nordics
- 3.9. Rest of Europe
-
4. Middle East & Africa
- 4.1. Turkey
- 4.2. Israel
- 4.3. GCC
- 4.4. North Africa
- 4.5. South Africa
- 4.6. Rest of Middle East & Africa
-
5. Asia Pacific
- 5.1. China
- 5.2. India
- 5.3. Japan
- 5.4. South Korea
- 5.5. ASEAN
- 5.6. Oceania
- 5.7. Rest of Asia Pacific
Hong Kong Data Center Industry REPORT HIGHLIGHTS
| Aspects | Details |
|---|---|
| Study Period | 2019-2033 |
| Base Year | 2024 |
| Estimated Year | 2025 |
| Forecast Period | 2025-2033 |
| Historical Period | 2019-2024 |
| Growth Rate | CAGR of 21.06% from 2019-2033 |
| Segmentation |
|
Table of Contents
- 1. Introduction
- 1.1. Research Scope
- 1.2. Market Segmentation
- 1.3. Research Methodology
- 1.4. Definitions and Assumptions
- 2. Executive Summary
- 2.1. Introduction
- 3. Market Dynamics
- 3.1. Introduction
- 3.2. Market Drivers
- 3.2.1. Rise of E-Commerce; Flourishing Startup Culture
- 3.3. Market Restrains
- 3.3.1. Slow Penetration Rate in Developing Countries
- 3.4. Market Trends
- 3.4.1. OTHER KEY INDUSTRY TRENDS COVERED IN THE REPORT
- 4. Market Factor Analysis
- 4.1. Porters Five Forces
- 4.2. Supply/Value Chain
- 4.3. PESTEL analysis
- 4.4. Market Entropy
- 4.5. Patent/Trademark Analysis
- 5. Global Hong Kong Data Center Industry Analysis, Insights and Forecast, 2019-2031
- 5.1. Market Analysis, Insights and Forecast - by Hotspot
- 5.1.1. Chai Wan
- 5.1.2. Shatin
- 5.1.3. Tseun Wan
- 5.1.4. Tseung Kwan O
- 5.1.5. Rest of Hong Kong
- 5.2. Market Analysis, Insights and Forecast - by Data Center Size
- 5.2.1. Large
- 5.2.2. Massive
- 5.2.3. Medium
- 5.2.4. Mega
- 5.2.5. Small
- 5.3. Market Analysis, Insights and Forecast - by Tier Type
- 5.3.1. Tier 1 and 2
- 5.3.2. Tier 3
- 5.3.3. Tier 4
- 5.4. Market Analysis, Insights and Forecast - by Absorption
- 5.4.1. Non-Utilized
- 5.5. Market Analysis, Insights and Forecast - by Colocation Type
- 5.5.1. Hyperscale
- 5.5.2. Retail
- 5.5.3. Wholesale
- 5.6. Market Analysis, Insights and Forecast - by End User
- 5.6.1. BFSI
- 5.6.2. Cloud
- 5.6.3. E-Commerce
- 5.6.4. Government
- 5.6.5. Manufacturing
- 5.6.6. Media & Entertainment
- 5.6.7. Telecom
- 5.6.8. Other End User
- 5.7. Market Analysis, Insights and Forecast - by Region
- 5.7.1. North America
- 5.7.2. South America
- 5.7.3. Europe
- 5.7.4. Middle East & Africa
- 5.7.5. Asia Pacific
- 5.1. Market Analysis, Insights and Forecast - by Hotspot
- 6. North America Hong Kong Data Center Industry Analysis, Insights and Forecast, 2019-2031
- 6.1. Market Analysis, Insights and Forecast - by Hotspot
- 6.1.1. Chai Wan
- 6.1.2. Shatin
- 6.1.3. Tseun Wan
- 6.1.4. Tseung Kwan O
- 6.1.5. Rest of Hong Kong
- 6.2. Market Analysis, Insights and Forecast - by Data Center Size
- 6.2.1. Large
- 6.2.2. Massive
- 6.2.3. Medium
- 6.2.4. Mega
- 6.2.5. Small
- 6.3. Market Analysis, Insights and Forecast - by Tier Type
- 6.3.1. Tier 1 and 2
- 6.3.2. Tier 3
- 6.3.3. Tier 4
- 6.4. Market Analysis, Insights and Forecast - by Absorption
- 6.4.1. Non-Utilized
- 6.5. Market Analysis, Insights and Forecast - by Colocation Type
- 6.5.1. Hyperscale
- 6.5.2. Retail
- 6.5.3. Wholesale
- 6.6. Market Analysis, Insights and Forecast - by End User
- 6.6.1. BFSI
- 6.6.2. Cloud
- 6.6.3. E-Commerce
- 6.6.4. Government
- 6.6.5. Manufacturing
- 6.6.6. Media & Entertainment
- 6.6.7. Telecom
- 6.6.8. Other End User
- 6.1. Market Analysis, Insights and Forecast - by Hotspot
- 7. South America Hong Kong Data Center Industry Analysis, Insights and Forecast, 2019-2031
- 7.1. Market Analysis, Insights and Forecast - by Hotspot
- 7.1.1. Chai Wan
- 7.1.2. Shatin
- 7.1.3. Tseun Wan
- 7.1.4. Tseung Kwan O
- 7.1.5. Rest of Hong Kong
- 7.2. Market Analysis, Insights and Forecast - by Data Center Size
- 7.2.1. Large
- 7.2.2. Massive
- 7.2.3. Medium
- 7.2.4. Mega
- 7.2.5. Small
- 7.3. Market Analysis, Insights and Forecast - by Tier Type
- 7.3.1. Tier 1 and 2
- 7.3.2. Tier 3
- 7.3.3. Tier 4
- 7.4. Market Analysis, Insights and Forecast - by Absorption
- 7.4.1. Non-Utilized
- 7.5. Market Analysis, Insights and Forecast - by Colocation Type
- 7.5.1. Hyperscale
- 7.5.2. Retail
- 7.5.3. Wholesale
- 7.6. Market Analysis, Insights and Forecast - by End User
- 7.6.1. BFSI
- 7.6.2. Cloud
- 7.6.3. E-Commerce
- 7.6.4. Government
- 7.6.5. Manufacturing
- 7.6.6. Media & Entertainment
- 7.6.7. Telecom
- 7.6.8. Other End User
- 7.1. Market Analysis, Insights and Forecast - by Hotspot
- 8. Europe Hong Kong Data Center Industry Analysis, Insights and Forecast, 2019-2031
- 8.1. Market Analysis, Insights and Forecast - by Hotspot
- 8.1.1. Chai Wan
- 8.1.2. Shatin
- 8.1.3. Tseun Wan
- 8.1.4. Tseung Kwan O
- 8.1.5. Rest of Hong Kong
- 8.2. Market Analysis, Insights and Forecast - by Data Center Size
- 8.2.1. Large
- 8.2.2. Massive
- 8.2.3. Medium
- 8.2.4. Mega
- 8.2.5. Small
- 8.3. Market Analysis, Insights and Forecast - by Tier Type
- 8.3.1. Tier 1 and 2
- 8.3.2. Tier 3
- 8.3.3. Tier 4
- 8.4. Market Analysis, Insights and Forecast - by Absorption
- 8.4.1. Non-Utilized
- 8.5. Market Analysis, Insights and Forecast - by Colocation Type
- 8.5.1. Hyperscale
- 8.5.2. Retail
- 8.5.3. Wholesale
- 8.6. Market Analysis, Insights and Forecast - by End User
- 8.6.1. BFSI
- 8.6.2. Cloud
- 8.6.3. E-Commerce
- 8.6.4. Government
- 8.6.5. Manufacturing
- 8.6.6. Media & Entertainment
- 8.6.7. Telecom
- 8.6.8. Other End User
- 8.1. Market Analysis, Insights and Forecast - by Hotspot
- 9. Middle East & Africa Hong Kong Data Center Industry Analysis, Insights and Forecast, 2019-2031
- 9.1. Market Analysis, Insights and Forecast - by Hotspot
- 9.1.1. Chai Wan
- 9.1.2. Shatin
- 9.1.3. Tseun Wan
- 9.1.4. Tseung Kwan O
- 9.1.5. Rest of Hong Kong
- 9.2. Market Analysis, Insights and Forecast - by Data Center Size
- 9.2.1. Large
- 9.2.2. Massive
- 9.2.3. Medium
- 9.2.4. Mega
- 9.2.5. Small
- 9.3. Market Analysis, Insights and Forecast - by Tier Type
- 9.3.1. Tier 1 and 2
- 9.3.2. Tier 3
- 9.3.3. Tier 4
- 9.4. Market Analysis, Insights and Forecast - by Absorption
- 9.4.1. Non-Utilized
- 9.5. Market Analysis, Insights and Forecast - by Colocation Type
- 9.5.1. Hyperscale
- 9.5.2. Retail
- 9.5.3. Wholesale
- 9.6. Market Analysis, Insights and Forecast - by End User
- 9.6.1. BFSI
- 9.6.2. Cloud
- 9.6.3. E-Commerce
- 9.6.4. Government
- 9.6.5. Manufacturing
- 9.6.6. Media & Entertainment
- 9.6.7. Telecom
- 9.6.8. Other End User
- 9.1. Market Analysis, Insights and Forecast - by Hotspot
- 10. Asia Pacific Hong Kong Data Center Industry Analysis, Insights and Forecast, 2019-2031
- 10.1. Market Analysis, Insights and Forecast - by Hotspot
- 10.1.1. Chai Wan
- 10.1.2. Shatin
- 10.1.3. Tseun Wan
- 10.1.4. Tseung Kwan O
- 10.1.5. Rest of Hong Kong
- 10.2. Market Analysis, Insights and Forecast - by Data Center Size
- 10.2.1. Large
- 10.2.2. Massive
- 10.2.3. Medium
- 10.2.4. Mega
- 10.2.5. Small
- 10.3. Market Analysis, Insights and Forecast - by Tier Type
- 10.3.1. Tier 1 and 2
- 10.3.2. Tier 3
- 10.3.3. Tier 4
- 10.4. Market Analysis, Insights and Forecast - by Absorption
- 10.4.1. Non-Utilized
- 10.5. Market Analysis, Insights and Forecast - by Colocation Type
- 10.5.1. Hyperscale
- 10.5.2. Retail
- 10.5.3. Wholesale
- 10.6. Market Analysis, Insights and Forecast - by End User
- 10.6.1. BFSI
- 10.6.2. Cloud
- 10.6.3. E-Commerce
- 10.6.4. Government
- 10.6.5. Manufacturing
- 10.6.6. Media & Entertainment
- 10.6.7. Telecom
- 10.6.8. Other End User
- 10.1. Market Analysis, Insights and Forecast - by Hotspot
- 11. Competitive Analysis
- 11.1. Global Market Share Analysis 2024
- 11.2. Company Profiles
- 11.2.1 China Mobile International Ltd
- 11.2.1.1. Overview
- 11.2.1.2. Products
- 11.2.1.3. SWOT Analysis
- 11.2.1.4. Recent Developments
- 11.2.1.5. Financials (Based on Availability)
- 11.2.2 Equinix Inc
- 11.2.2.1. Overview
- 11.2.2.2. Products
- 11.2.2.3. SWOT Analysis
- 11.2.2.4. Recent Developments
- 11.2.2.5. Financials (Based on Availability)
- 11.2.3 Rackspace Technology Inc
- 11.2.3.1. Overview
- 11.2.3.2. Products
- 11.2.3.3. SWOT Analysis
- 11.2.3.4. Recent Developments
- 11.2.3.5. Financials (Based on Availability)
- 11.2.4 Zenlayer Inc5 4 LIST OF COMPANIES STUDIE
- 11.2.4.1. Overview
- 11.2.4.2. Products
- 11.2.4.3. SWOT Analysis
- 11.2.4.4. Recent Developments
- 11.2.4.5. Financials (Based on Availability)
- 11.2.5 Vantage Data Centers LLC
- 11.2.5.1. Overview
- 11.2.5.2. Products
- 11.2.5.3. SWOT Analysis
- 11.2.5.4. Recent Developments
- 11.2.5.5. Financials (Based on Availability)
- 11.2.6 SuneVision Holdings Ltd
- 11.2.6.1. Overview
- 11.2.6.2. Products
- 11.2.6.3. SWOT Analysis
- 11.2.6.4. Recent Developments
- 11.2.6.5. Financials (Based on Availability)
- 11.2.7 Digital Realty Trust Inc
- 11.2.7.1. Overview
- 11.2.7.2. Products
- 11.2.7.3. SWOT Analysis
- 11.2.7.4. Recent Developments
- 11.2.7.5. Financials (Based on Availability)
- 11.2.8 AirTrunk Operating Pty Ltd
- 11.2.8.1. Overview
- 11.2.8.2. Products
- 11.2.8.3. SWOT Analysis
- 11.2.8.4. Recent Developments
- 11.2.8.5. Financials (Based on Availability)
- 11.2.9 Hostdime
- 11.2.9.1. Overview
- 11.2.9.2. Products
- 11.2.9.3. SWOT Analysis
- 11.2.9.4. Recent Developments
- 11.2.9.5. Financials (Based on Availability)
- 11.2.10 BDx Data Center Pte Ltd
- 11.2.10.1. Overview
- 11.2.10.2. Products
- 11.2.10.3. SWOT Analysis
- 11.2.10.4. Recent Developments
- 11.2.10.5. Financials (Based on Availability)
- 11.2.11 Global Switch Holdings Limited
- 11.2.11.1. Overview
- 11.2.11.2. Products
- 11.2.11.3. SWOT Analysis
- 11.2.11.4. Recent Developments
- 11.2.11.5. Financials (Based on Availability)
- 11.2.12 NTT Ltd
- 11.2.12.1. Overview
- 11.2.12.2. Products
- 11.2.12.3. SWOT Analysis
- 11.2.12.4. Recent Developments
- 11.2.12.5. Financials (Based on Availability)
- 11.2.1 China Mobile International Ltd
List of Figures
- Figure 1: Global Hong Kong Data Center Industry Revenue Breakdown (Million, %) by Region 2024 & 2032
- Figure 2: Global Hong Kong Data Center Industry Volume Breakdown (K Unit, %) by Region 2024 & 2032
- Figure 3: Hong Kong Hong Kong Data Center Industry Revenue (Million), by Country 2024 & 2032
- Figure 4: Hong Kong Hong Kong Data Center Industry Volume (K Unit), by Country 2024 & 2032
- Figure 5: Hong Kong Hong Kong Data Center Industry Revenue Share (%), by Country 2024 & 2032
- Figure 6: Hong Kong Hong Kong Data Center Industry Volume Share (%), by Country 2024 & 2032
- Figure 7: North America Hong Kong Data Center Industry Revenue (Million), by Hotspot 2024 & 2032
- Figure 8: North America Hong Kong Data Center Industry Volume (K Unit), by Hotspot 2024 & 2032
- Figure 9: North America Hong Kong Data Center Industry Revenue Share (%), by Hotspot 2024 & 2032
- Figure 10: North America Hong Kong Data Center Industry Volume Share (%), by Hotspot 2024 & 2032
- Figure 11: North America Hong Kong Data Center Industry Revenue (Million), by Data Center Size 2024 & 2032
- Figure 12: North America Hong Kong Data Center Industry Volume (K Unit), by Data Center Size 2024 & 2032
- Figure 13: North America Hong Kong Data Center Industry Revenue Share (%), by Data Center Size 2024 & 2032
- Figure 14: North America Hong Kong Data Center Industry Volume Share (%), by Data Center Size 2024 & 2032
- Figure 15: North America Hong Kong Data Center Industry Revenue (Million), by Tier Type 2024 & 2032
- Figure 16: North America Hong Kong Data Center Industry Volume (K Unit), by Tier Type 2024 & 2032
- Figure 17: North America Hong Kong Data Center Industry Revenue Share (%), by Tier Type 2024 & 2032
- Figure 18: North America Hong Kong Data Center Industry Volume Share (%), by Tier Type 2024 & 2032
- Figure 19: North America Hong Kong Data Center Industry Revenue (Million), by Absorption 2024 & 2032
- Figure 20: North America Hong Kong Data Center Industry Volume (K Unit), by Absorption 2024 & 2032
- Figure 21: North America Hong Kong Data Center Industry Revenue Share (%), by Absorption 2024 & 2032
- Figure 22: North America Hong Kong Data Center Industry Volume Share (%), by Absorption 2024 & 2032
- Figure 23: North America Hong Kong Data Center Industry Revenue (Million), by Colocation Type 2024 & 2032
- Figure 24: North America Hong Kong Data Center Industry Volume (K Unit), by Colocation Type 2024 & 2032
- Figure 25: North America Hong Kong Data Center Industry Revenue Share (%), by Colocation Type 2024 & 2032
- Figure 26: North America Hong Kong Data Center Industry Volume Share (%), by Colocation Type 2024 & 2032
- Figure 27: North America Hong Kong Data Center Industry Revenue (Million), by End User 2024 & 2032
- Figure 28: North America Hong Kong Data Center Industry Volume (K Unit), by End User 2024 & 2032
- Figure 29: North America Hong Kong Data Center Industry Revenue Share (%), by End User 2024 & 2032
- Figure 30: North America Hong Kong Data Center Industry Volume Share (%), by End User 2024 & 2032
- Figure 31: North America Hong Kong Data Center Industry Revenue (Million), by Country 2024 & 2032
- Figure 32: North America Hong Kong Data Center Industry Volume (K Unit), by Country 2024 & 2032
- Figure 33: North America Hong Kong Data Center Industry Revenue Share (%), by Country 2024 & 2032
- Figure 34: North America Hong Kong Data Center Industry Volume Share (%), by Country 2024 & 2032
- Figure 35: South America Hong Kong Data Center Industry Revenue (Million), by Hotspot 2024 & 2032
- Figure 36: South America Hong Kong Data Center Industry Volume (K Unit), by Hotspot 2024 & 2032
- Figure 37: South America Hong Kong Data Center Industry Revenue Share (%), by Hotspot 2024 & 2032
- Figure 38: South America Hong Kong Data Center Industry Volume Share (%), by Hotspot 2024 & 2032
- Figure 39: South America Hong Kong Data Center Industry Revenue (Million), by Data Center Size 2024 & 2032
- Figure 40: South America Hong Kong Data Center Industry Volume (K Unit), by Data Center Size 2024 & 2032
- Figure 41: South America Hong Kong Data Center Industry Revenue Share (%), by Data Center Size 2024 & 2032
- Figure 42: South America Hong Kong Data Center Industry Volume Share (%), by Data Center Size 2024 & 2032
- Figure 43: South America Hong Kong Data Center Industry Revenue (Million), by Tier Type 2024 & 2032
- Figure 44: South America Hong Kong Data Center Industry Volume (K Unit), by Tier Type 2024 & 2032
- Figure 45: South America Hong Kong Data Center Industry Revenue Share (%), by Tier Type 2024 & 2032
- Figure 46: South America Hong Kong Data Center Industry Volume Share (%), by Tier Type 2024 & 2032
- Figure 47: South America Hong Kong Data Center Industry Revenue (Million), by Absorption 2024 & 2032
- Figure 48: South America Hong Kong Data Center Industry Volume (K Unit), by Absorption 2024 & 2032
- Figure 49: South America Hong Kong Data Center Industry Revenue Share (%), by Absorption 2024 & 2032
- Figure 50: South America Hong Kong Data Center Industry Volume Share (%), by Absorption 2024 & 2032
- Figure 51: South America Hong Kong Data Center Industry Revenue (Million), by Colocation Type 2024 & 2032
- Figure 52: South America Hong Kong Data Center Industry Volume (K Unit), by Colocation Type 2024 & 2032
- Figure 53: South America Hong Kong Data Center Industry Revenue Share (%), by Colocation Type 2024 & 2032
- Figure 54: South America Hong Kong Data Center Industry Volume Share (%), by Colocation Type 2024 & 2032
- Figure 55: South America Hong Kong Data Center Industry Revenue (Million), by End User 2024 & 2032
- Figure 56: South America Hong Kong Data Center Industry Volume (K Unit), by End User 2024 & 2032
- Figure 57: South America Hong Kong Data Center Industry Revenue Share (%), by End User 2024 & 2032
- Figure 58: South America Hong Kong Data Center Industry Volume Share (%), by End User 2024 & 2032
- Figure 59: South America Hong Kong Data Center Industry Revenue (Million), by Country 2024 & 2032
- Figure 60: South America Hong Kong Data Center Industry Volume (K Unit), by Country 2024 & 2032
- Figure 61: South America Hong Kong Data Center Industry Revenue Share (%), by Country 2024 & 2032
- Figure 62: South America Hong Kong Data Center Industry Volume Share (%), by Country 2024 & 2032
- Figure 63: Europe Hong Kong Data Center Industry Revenue (Million), by Hotspot 2024 & 2032
- Figure 64: Europe Hong Kong Data Center Industry Volume (K Unit), by Hotspot 2024 & 2032
- Figure 65: Europe Hong Kong Data Center Industry Revenue Share (%), by Hotspot 2024 & 2032
- Figure 66: Europe Hong Kong Data Center Industry Volume Share (%), by Hotspot 2024 & 2032
- Figure 67: Europe Hong Kong Data Center Industry Revenue (Million), by Data Center Size 2024 & 2032
- Figure 68: Europe Hong Kong Data Center Industry Volume (K Unit), by Data Center Size 2024 & 2032
- Figure 69: Europe Hong Kong Data Center Industry Revenue Share (%), by Data Center Size 2024 & 2032
- Figure 70: Europe Hong Kong Data Center Industry Volume Share (%), by Data Center Size 2024 & 2032
- Figure 71: Europe Hong Kong Data Center Industry Revenue (Million), by Tier Type 2024 & 2032
- Figure 72: Europe Hong Kong Data Center Industry Volume (K Unit), by Tier Type 2024 & 2032
- Figure 73: Europe Hong Kong Data Center Industry Revenue Share (%), by Tier Type 2024 & 2032
- Figure 74: Europe Hong Kong Data Center Industry Volume Share (%), by Tier Type 2024 & 2032
- Figure 75: Europe Hong Kong Data Center Industry Revenue (Million), by Absorption 2024 & 2032
- Figure 76: Europe Hong Kong Data Center Industry Volume (K Unit), by Absorption 2024 & 2032
- Figure 77: Europe Hong Kong Data Center Industry Revenue Share (%), by Absorption 2024 & 2032
- Figure 78: Europe Hong Kong Data Center Industry Volume Share (%), by Absorption 2024 & 2032
- Figure 79: Europe Hong Kong Data Center Industry Revenue (Million), by Colocation Type 2024 & 2032
- Figure 80: Europe Hong Kong Data Center Industry Volume (K Unit), by Colocation Type 2024 & 2032
- Figure 81: Europe Hong Kong Data Center Industry Revenue Share (%), by Colocation Type 2024 & 2032
- Figure 82: Europe Hong Kong Data Center Industry Volume Share (%), by Colocation Type 2024 & 2032
- Figure 83: Europe Hong Kong Data Center Industry Revenue (Million), by End User 2024 & 2032
- Figure 84: Europe Hong Kong Data Center Industry Volume (K Unit), by End User 2024 & 2032
- Figure 85: Europe Hong Kong Data Center Industry Revenue Share (%), by End User 2024 & 2032
- Figure 86: Europe Hong Kong Data Center Industry Volume Share (%), by End User 2024 & 2032
- Figure 87: Europe Hong Kong Data Center Industry Revenue (Million), by Country 2024 & 2032
- Figure 88: Europe Hong Kong Data Center Industry Volume (K Unit), by Country 2024 & 2032
- Figure 89: Europe Hong Kong Data Center Industry Revenue Share (%), by Country 2024 & 2032
- Figure 90: Europe Hong Kong Data Center Industry Volume Share (%), by Country 2024 & 2032
- Figure 91: Middle East & Africa Hong Kong Data Center Industry Revenue (Million), by Hotspot 2024 & 2032
- Figure 92: Middle East & Africa Hong Kong Data Center Industry Volume (K Unit), by Hotspot 2024 & 2032
- Figure 93: Middle East & Africa Hong Kong Data Center Industry Revenue Share (%), by Hotspot 2024 & 2032
- Figure 94: Middle East & Africa Hong Kong Data Center Industry Volume Share (%), by Hotspot 2024 & 2032
- Figure 95: Middle East & Africa Hong Kong Data Center Industry Revenue (Million), by Data Center Size 2024 & 2032
- Figure 96: Middle East & Africa Hong Kong Data Center Industry Volume (K Unit), by Data Center Size 2024 & 2032
- Figure 97: Middle East & Africa Hong Kong Data Center Industry Revenue Share (%), by Data Center Size 2024 & 2032
- Figure 98: Middle East & Africa Hong Kong Data Center Industry Volume Share (%), by Data Center Size 2024 & 2032
- Figure 99: Middle East & Africa Hong Kong Data Center Industry Revenue (Million), by Tier Type 2024 & 2032
- Figure 100: Middle East & Africa Hong Kong Data Center Industry Volume (K Unit), by Tier Type 2024 & 2032
- Figure 101: Middle East & Africa Hong Kong Data Center Industry Revenue Share (%), by Tier Type 2024 & 2032
- Figure 102: Middle East & Africa Hong Kong Data Center Industry Volume Share (%), by Tier Type 2024 & 2032
- Figure 103: Middle East & Africa Hong Kong Data Center Industry Revenue (Million), by Absorption 2024 & 2032
- Figure 104: Middle East & Africa Hong Kong Data Center Industry Volume (K Unit), by Absorption 2024 & 2032
- Figure 105: Middle East & Africa Hong Kong Data Center Industry Revenue Share (%), by Absorption 2024 & 2032
- Figure 106: Middle East & Africa Hong Kong Data Center Industry Volume Share (%), by Absorption 2024 & 2032
- Figure 107: Middle East & Africa Hong Kong Data Center Industry Revenue (Million), by Colocation Type 2024 & 2032
- Figure 108: Middle East & Africa Hong Kong Data Center Industry Volume (K Unit), by Colocation Type 2024 & 2032
- Figure 109: Middle East & Africa Hong Kong Data Center Industry Revenue Share (%), by Colocation Type 2024 & 2032
- Figure 110: Middle East & Africa Hong Kong Data Center Industry Volume Share (%), by Colocation Type 2024 & 2032
- Figure 111: Middle East & Africa Hong Kong Data Center Industry Revenue (Million), by End User 2024 & 2032
- Figure 112: Middle East & Africa Hong Kong Data Center Industry Volume (K Unit), by End User 2024 & 2032
- Figure 113: Middle East & Africa Hong Kong Data Center Industry Revenue Share (%), by End User 2024 & 2032
- Figure 114: Middle East & Africa Hong Kong Data Center Industry Volume Share (%), by End User 2024 & 2032
- Figure 115: Middle East & Africa Hong Kong Data Center Industry Revenue (Million), by Country 2024 & 2032
- Figure 116: Middle East & Africa Hong Kong Data Center Industry Volume (K Unit), by Country 2024 & 2032
- Figure 117: Middle East & Africa Hong Kong Data Center Industry Revenue Share (%), by Country 2024 & 2032
- Figure 118: Middle East & Africa Hong Kong Data Center Industry Volume Share (%), by Country 2024 & 2032
- Figure 119: Asia Pacific Hong Kong Data Center Industry Revenue (Million), by Hotspot 2024 & 2032
- Figure 120: Asia Pacific Hong Kong Data Center Industry Volume (K Unit), by Hotspot 2024 & 2032
- Figure 121: Asia Pacific Hong Kong Data Center Industry Revenue Share (%), by Hotspot 2024 & 2032
- Figure 122: Asia Pacific Hong Kong Data Center Industry Volume Share (%), by Hotspot 2024 & 2032
- Figure 123: Asia Pacific Hong Kong Data Center Industry Revenue (Million), by Data Center Size 2024 & 2032
- Figure 124: Asia Pacific Hong Kong Data Center Industry Volume (K Unit), by Data Center Size 2024 & 2032
- Figure 125: Asia Pacific Hong Kong Data Center Industry Revenue Share (%), by Data Center Size 2024 & 2032
- Figure 126: Asia Pacific Hong Kong Data Center Industry Volume Share (%), by Data Center Size 2024 & 2032
- Figure 127: Asia Pacific Hong Kong Data Center Industry Revenue (Million), by Tier Type 2024 & 2032
- Figure 128: Asia Pacific Hong Kong Data Center Industry Volume (K Unit), by Tier Type 2024 & 2032
- Figure 129: Asia Pacific Hong Kong Data Center Industry Revenue Share (%), by Tier Type 2024 & 2032
- Figure 130: Asia Pacific Hong Kong Data Center Industry Volume Share (%), by Tier Type 2024 & 2032
- Figure 131: Asia Pacific Hong Kong Data Center Industry Revenue (Million), by Absorption 2024 & 2032
- Figure 132: Asia Pacific Hong Kong Data Center Industry Volume (K Unit), by Absorption 2024 & 2032
- Figure 133: Asia Pacific Hong Kong Data Center Industry Revenue Share (%), by Absorption 2024 & 2032
- Figure 134: Asia Pacific Hong Kong Data Center Industry Volume Share (%), by Absorption 2024 & 2032
- Figure 135: Asia Pacific Hong Kong Data Center Industry Revenue (Million), by Colocation Type 2024 & 2032
- Figure 136: Asia Pacific Hong Kong Data Center Industry Volume (K Unit), by Colocation Type 2024 & 2032
- Figure 137: Asia Pacific Hong Kong Data Center Industry Revenue Share (%), by Colocation Type 2024 & 2032
- Figure 138: Asia Pacific Hong Kong Data Center Industry Volume Share (%), by Colocation Type 2024 & 2032
- Figure 139: Asia Pacific Hong Kong Data Center Industry Revenue (Million), by End User 2024 & 2032
- Figure 140: Asia Pacific Hong Kong Data Center Industry Volume (K Unit), by End User 2024 & 2032
- Figure 141: Asia Pacific Hong Kong Data Center Industry Revenue Share (%), by End User 2024 & 2032
- Figure 142: Asia Pacific Hong Kong Data Center Industry Volume Share (%), by End User 2024 & 2032
- Figure 143: Asia Pacific Hong Kong Data Center Industry Revenue (Million), by Country 2024 & 2032
- Figure 144: Asia Pacific Hong Kong Data Center Industry Volume (K Unit), by Country 2024 & 2032
- Figure 145: Asia Pacific Hong Kong Data Center Industry Revenue Share (%), by Country 2024 & 2032
- Figure 146: Asia Pacific Hong Kong Data Center Industry Volume Share (%), by Country 2024 & 2032
List of Tables
- Table 1: Global Hong Kong Data Center Industry Revenue Million Forecast, by Region 2019 & 2032
- Table 2: Global Hong Kong Data Center Industry Volume K Unit Forecast, by Region 2019 & 2032
- Table 3: Global Hong Kong Data Center Industry Revenue Million Forecast, by Hotspot 2019 & 2032
- Table 4: Global Hong Kong Data Center Industry Volume K Unit Forecast, by Hotspot 2019 & 2032
- Table 5: Global Hong Kong Data Center Industry Revenue Million Forecast, by Data Center Size 2019 & 2032
- Table 6: Global Hong Kong Data Center Industry Volume K Unit Forecast, by Data Center Size 2019 & 2032
- Table 7: Global Hong Kong Data Center Industry Revenue Million Forecast, by Tier Type 2019 & 2032
- Table 8: Global Hong Kong Data Center Industry Volume K Unit Forecast, by Tier Type 2019 & 2032
- Table 9: Global Hong Kong Data Center Industry Revenue Million Forecast, by Absorption 2019 & 2032
- Table 10: Global Hong Kong Data Center Industry Volume K Unit Forecast, by Absorption 2019 & 2032
- Table 11: Global Hong Kong Data Center Industry Revenue Million Forecast, by Colocation Type 2019 & 2032
- Table 12: Global Hong Kong Data Center Industry Volume K Unit Forecast, by Colocation Type 2019 & 2032
- Table 13: Global Hong Kong Data Center Industry Revenue Million Forecast, by End User 2019 & 2032
- Table 14: Global Hong Kong Data Center Industry Volume K Unit Forecast, by End User 2019 & 2032
- Table 15: Global Hong Kong Data Center Industry Revenue Million Forecast, by Region 2019 & 2032
- Table 16: Global Hong Kong Data Center Industry Volume K Unit Forecast, by Region 2019 & 2032
- Table 17: Global Hong Kong Data Center Industry Revenue Million Forecast, by Country 2019 & 2032
- Table 18: Global Hong Kong Data Center Industry Volume K Unit Forecast, by Country 2019 & 2032
- Table 19: Global Hong Kong Data Center Industry Revenue Million Forecast, by Hotspot 2019 & 2032
- Table 20: Global Hong Kong Data Center Industry Volume K Unit Forecast, by Hotspot 2019 & 2032
- Table 21: Global Hong Kong Data Center Industry Revenue Million Forecast, by Data Center Size 2019 & 2032
- Table 22: Global Hong Kong Data Center Industry Volume K Unit Forecast, by Data Center Size 2019 & 2032
- Table 23: Global Hong Kong Data Center Industry Revenue Million Forecast, by Tier Type 2019 & 2032
- Table 24: Global Hong Kong Data Center Industry Volume K Unit Forecast, by Tier Type 2019 & 2032
- Table 25: Global Hong Kong Data Center Industry Revenue Million Forecast, by Absorption 2019 & 2032
- Table 26: Global Hong Kong Data Center Industry Volume K Unit Forecast, by Absorption 2019 & 2032
- Table 27: Global Hong Kong Data Center Industry Revenue Million Forecast, by Colocation Type 2019 & 2032
- Table 28: Global Hong Kong Data Center Industry Volume K Unit Forecast, by Colocation Type 2019 & 2032
- Table 29: Global Hong Kong Data Center Industry Revenue Million Forecast, by End User 2019 & 2032
- Table 30: Global Hong Kong Data Center Industry Volume K Unit Forecast, by End User 2019 & 2032
- Table 31: Global Hong Kong Data Center Industry Revenue Million Forecast, by Country 2019 & 2032
- Table 32: Global Hong Kong Data Center Industry Volume K Unit Forecast, by Country 2019 & 2032
- Table 33: United States Hong Kong Data Center Industry Revenue (Million) Forecast, by Application 2019 & 2032
- Table 34: United States Hong Kong Data Center Industry Volume (K Unit) Forecast, by Application 2019 & 2032
- Table 35: Canada Hong Kong Data Center Industry Revenue (Million) Forecast, by Application 2019 & 2032
- Table 36: Canada Hong Kong Data Center Industry Volume (K Unit) Forecast, by Application 2019 & 2032
- Table 37: Mexico Hong Kong Data Center Industry Revenue (Million) Forecast, by Application 2019 & 2032
- Table 38: Mexico Hong Kong Data Center Industry Volume (K Unit) Forecast, by Application 2019 & 2032
- Table 39: Global Hong Kong Data Center Industry Revenue Million Forecast, by Hotspot 2019 & 2032
- Table 40: Global Hong Kong Data Center Industry Volume K Unit Forecast, by Hotspot 2019 & 2032
- Table 41: Global Hong Kong Data Center Industry Revenue Million Forecast, by Data Center Size 2019 & 2032
- Table 42: Global Hong Kong Data Center Industry Volume K Unit Forecast, by Data Center Size 2019 & 2032
- Table 43: Global Hong Kong Data Center Industry Revenue Million Forecast, by Tier Type 2019 & 2032
- Table 44: Global Hong Kong Data Center Industry Volume K Unit Forecast, by Tier Type 2019 & 2032
- Table 45: Global Hong Kong Data Center Industry Revenue Million Forecast, by Absorption 2019 & 2032
- Table 46: Global Hong Kong Data Center Industry Volume K Unit Forecast, by Absorption 2019 & 2032
- Table 47: Global Hong Kong Data Center Industry Revenue Million Forecast, by Colocation Type 2019 & 2032
- Table 48: Global Hong Kong Data Center Industry Volume K Unit Forecast, by Colocation Type 2019 & 2032
- Table 49: Global Hong Kong Data Center Industry Revenue Million Forecast, by End User 2019 & 2032
- Table 50: Global Hong Kong Data Center Industry Volume K Unit Forecast, by End User 2019 & 2032
- Table 51: Global Hong Kong Data Center Industry Revenue Million Forecast, by Country 2019 & 2032
- Table 52: Global Hong Kong Data Center Industry Volume K Unit Forecast, by Country 2019 & 2032
- Table 53: Brazil Hong Kong Data Center Industry Revenue (Million) Forecast, by Application 2019 & 2032
- Table 54: Brazil Hong Kong Data Center Industry Volume (K Unit) Forecast, by Application 2019 & 2032
- Table 55: Argentina Hong Kong Data Center Industry Revenue (Million) Forecast, by Application 2019 & 2032
- Table 56: Argentina Hong Kong Data Center Industry Volume (K Unit) Forecast, by Application 2019 & 2032
- Table 57: Rest of South America Hong Kong Data Center Industry Revenue (Million) Forecast, by Application 2019 & 2032
- Table 58: Rest of South America Hong Kong Data Center Industry Volume (K Unit) Forecast, by Application 2019 & 2032
- Table 59: Global Hong Kong Data Center Industry Revenue Million Forecast, by Hotspot 2019 & 2032
- Table 60: Global Hong Kong Data Center Industry Volume K Unit Forecast, by Hotspot 2019 & 2032
- Table 61: Global Hong Kong Data Center Industry Revenue Million Forecast, by Data Center Size 2019 & 2032
- Table 62: Global Hong Kong Data Center Industry Volume K Unit Forecast, by Data Center Size 2019 & 2032
- Table 63: Global Hong Kong Data Center Industry Revenue Million Forecast, by Tier Type 2019 & 2032
- Table 64: Global Hong Kong Data Center Industry Volume K Unit Forecast, by Tier Type 2019 & 2032
- Table 65: Global Hong Kong Data Center Industry Revenue Million Forecast, by Absorption 2019 & 2032
- Table 66: Global Hong Kong Data Center Industry Volume K Unit Forecast, by Absorption 2019 & 2032
- Table 67: Global Hong Kong Data Center Industry Revenue Million Forecast, by Colocation Type 2019 & 2032
- Table 68: Global Hong Kong Data Center Industry Volume K Unit Forecast, by Colocation Type 2019 & 2032
- Table 69: Global Hong Kong Data Center Industry Revenue Million Forecast, by End User 2019 & 2032
- Table 70: Global Hong Kong Data Center Industry Volume K Unit Forecast, by End User 2019 & 2032
- Table 71: Global Hong Kong Data Center Industry Revenue Million Forecast, by Country 2019 & 2032
- Table 72: Global Hong Kong Data Center Industry Volume K Unit Forecast, by Country 2019 & 2032
- Table 73: United Kingdom Hong Kong Data Center Industry Revenue (Million) Forecast, by Application 2019 & 2032
- Table 74: United Kingdom Hong Kong Data Center Industry Volume (K Unit) Forecast, by Application 2019 & 2032
- Table 75: Germany Hong Kong Data Center Industry Revenue (Million) Forecast, by Application 2019 & 2032
- Table 76: Germany Hong Kong Data Center Industry Volume (K Unit) Forecast, by Application 2019 & 2032
- Table 77: France Hong Kong Data Center Industry Revenue (Million) Forecast, by Application 2019 & 2032
- Table 78: France Hong Kong Data Center Industry Volume (K Unit) Forecast, by Application 2019 & 2032
- Table 79: Italy Hong Kong Data Center Industry Revenue (Million) Forecast, by Application 2019 & 2032
- Table 80: Italy Hong Kong Data Center Industry Volume (K Unit) Forecast, by Application 2019 & 2032
- Table 81: Spain Hong Kong Data Center Industry Revenue (Million) Forecast, by Application 2019 & 2032
- Table 82: Spain Hong Kong Data Center Industry Volume (K Unit) Forecast, by Application 2019 & 2032
- Table 83: Russia Hong Kong Data Center Industry Revenue (Million) Forecast, by Application 2019 & 2032
- Table 84: Russia Hong Kong Data Center Industry Volume (K Unit) Forecast, by Application 2019 & 2032
- Table 85: Benelux Hong Kong Data Center Industry Revenue (Million) Forecast, by Application 2019 & 2032
- Table 86: Benelux Hong Kong Data Center Industry Volume (K Unit) Forecast, by Application 2019 & 2032
- Table 87: Nordics Hong Kong Data Center Industry Revenue (Million) Forecast, by Application 2019 & 2032
- Table 88: Nordics Hong Kong Data Center Industry Volume (K Unit) Forecast, by Application 2019 & 2032
- Table 89: Rest of Europe Hong Kong Data Center Industry Revenue (Million) Forecast, by Application 2019 & 2032
- Table 90: Rest of Europe Hong Kong Data Center Industry Volume (K Unit) Forecast, by Application 2019 & 2032
- Table 91: Global Hong Kong Data Center Industry Revenue Million Forecast, by Hotspot 2019 & 2032
- Table 92: Global Hong Kong Data Center Industry Volume K Unit Forecast, by Hotspot 2019 & 2032
- Table 93: Global Hong Kong Data Center Industry Revenue Million Forecast, by Data Center Size 2019 & 2032
- Table 94: Global Hong Kong Data Center Industry Volume K Unit Forecast, by Data Center Size 2019 & 2032
- Table 95: Global Hong Kong Data Center Industry Revenue Million Forecast, by Tier Type 2019 & 2032
- Table 96: Global Hong Kong Data Center Industry Volume K Unit Forecast, by Tier Type 2019 & 2032
- Table 97: Global Hong Kong Data Center Industry Revenue Million Forecast, by Absorption 2019 & 2032
- Table 98: Global Hong Kong Data Center Industry Volume K Unit Forecast, by Absorption 2019 & 2032
- Table 99: Global Hong Kong Data Center Industry Revenue Million Forecast, by Colocation Type 2019 & 2032
- Table 100: Global Hong Kong Data Center Industry Volume K Unit Forecast, by Colocation Type 2019 & 2032
- Table 101: Global Hong Kong Data Center Industry Revenue Million Forecast, by End User 2019 & 2032
- Table 102: Global Hong Kong Data Center Industry Volume K Unit Forecast, by End User 2019 & 2032
- Table 103: Global Hong Kong Data Center Industry Revenue Million Forecast, by Country 2019 & 2032
- Table 104: Global Hong Kong Data Center Industry Volume K Unit Forecast, by Country 2019 & 2032
- Table 105: Turkey Hong Kong Data Center Industry Revenue (Million) Forecast, by Application 2019 & 2032
- Table 106: Turkey Hong Kong Data Center Industry Volume (K Unit) Forecast, by Application 2019 & 2032
- Table 107: Israel Hong Kong Data Center Industry Revenue (Million) Forecast, by Application 2019 & 2032
- Table 108: Israel Hong Kong Data Center Industry Volume (K Unit) Forecast, by Application 2019 & 2032
- Table 109: GCC Hong Kong Data Center Industry Revenue (Million) Forecast, by Application 2019 & 2032
- Table 110: GCC Hong Kong Data Center Industry Volume (K Unit) Forecast, by Application 2019 & 2032
- Table 111: North Africa Hong Kong Data Center Industry Revenue (Million) Forecast, by Application 2019 & 2032
- Table 112: North Africa Hong Kong Data Center Industry Volume (K Unit) Forecast, by Application 2019 & 2032
- Table 113: South Africa Hong Kong Data Center Industry Revenue (Million) Forecast, by Application 2019 & 2032
- Table 114: South Africa Hong Kong Data Center Industry Volume (K Unit) Forecast, by Application 2019 & 2032
- Table 115: Rest of Middle East & Africa Hong Kong Data Center Industry Revenue (Million) Forecast, by Application 2019 & 2032
- Table 116: Rest of Middle East & Africa Hong Kong Data Center Industry Volume (K Unit) Forecast, by Application 2019 & 2032
- Table 117: Global Hong Kong Data Center Industry Revenue Million Forecast, by Hotspot 2019 & 2032
- Table 118: Global Hong Kong Data Center Industry Volume K Unit Forecast, by Hotspot 2019 & 2032
- Table 119: Global Hong Kong Data Center Industry Revenue Million Forecast, by Data Center Size 2019 & 2032
- Table 120: Global Hong Kong Data Center Industry Volume K Unit Forecast, by Data Center Size 2019 & 2032
- Table 121: Global Hong Kong Data Center Industry Revenue Million Forecast, by Tier Type 2019 & 2032
- Table 122: Global Hong Kong Data Center Industry Volume K Unit Forecast, by Tier Type 2019 & 2032
- Table 123: Global Hong Kong Data Center Industry Revenue Million Forecast, by Absorption 2019 & 2032
- Table 124: Global Hong Kong Data Center Industry Volume K Unit Forecast, by Absorption 2019 & 2032
- Table 125: Global Hong Kong Data Center Industry Revenue Million Forecast, by Colocation Type 2019 & 2032
- Table 126: Global Hong Kong Data Center Industry Volume K Unit Forecast, by Colocation Type 2019 & 2032
- Table 127: Global Hong Kong Data Center Industry Revenue Million Forecast, by End User 2019 & 2032
- Table 128: Global Hong Kong Data Center Industry Volume K Unit Forecast, by End User 2019 & 2032
- Table 129: Global Hong Kong Data Center Industry Revenue Million Forecast, by Country 2019 & 2032
- Table 130: Global Hong Kong Data Center Industry Volume K Unit Forecast, by Country 2019 & 2032
- Table 131: China Hong Kong Data Center Industry Revenue (Million) Forecast, by Application 2019 & 2032
- Table 132: China Hong Kong Data Center Industry Volume (K Unit) Forecast, by Application 2019 & 2032
- Table 133: India Hong Kong Data Center Industry Revenue (Million) Forecast, by Application 2019 & 2032
- Table 134: India Hong Kong Data Center Industry Volume (K Unit) Forecast, by Application 2019 & 2032
- Table 135: Japan Hong Kong Data Center Industry Revenue (Million) Forecast, by Application 2019 & 2032
- Table 136: Japan Hong Kong Data Center Industry Volume (K Unit) Forecast, by Application 2019 & 2032
- Table 137: South Korea Hong Kong Data Center Industry Revenue (Million) Forecast, by Application 2019 & 2032
- Table 138: South Korea Hong Kong Data Center Industry Volume (K Unit) Forecast, by Application 2019 & 2032
- Table 139: ASEAN Hong Kong Data Center Industry Revenue (Million) Forecast, by Application 2019 & 2032
- Table 140: ASEAN Hong Kong Data Center Industry Volume (K Unit) Forecast, by Application 2019 & 2032
- Table 141: Oceania Hong Kong Data Center Industry Revenue (Million) Forecast, by Application 2019 & 2032
- Table 142: Oceania Hong Kong Data Center Industry Volume (K Unit) Forecast, by Application 2019 & 2032
- Table 143: Rest of Asia Pacific Hong Kong Data Center Industry Revenue (Million) Forecast, by Application 2019 & 2032
- Table 144: Rest of Asia Pacific Hong Kong Data Center Industry Volume (K Unit) Forecast, by Application 2019 & 2032
Frequently Asked Questions
1. What is the projected Compound Annual Growth Rate (CAGR) of the Hong Kong Data Center Industry?
The projected CAGR is approximately 21.06%.
2. Which companies are prominent players in the Hong Kong Data Center Industry?
Key companies in the market include China Mobile International Ltd, Equinix Inc, Rackspace Technology Inc, Zenlayer Inc5 4 LIST OF COMPANIES STUDIE, Vantage Data Centers LLC, SuneVision Holdings Ltd, Digital Realty Trust Inc, AirTrunk Operating Pty Ltd, Hostdime, BDx Data Center Pte Ltd, Global Switch Holdings Limited, NTT Ltd.
3. What are the main segments of the Hong Kong Data Center Industry?
The market segments include Hotspot, Data Center Size, Tier Type, Absorption, Colocation Type, End User.
4. Can you provide details about the market size?
The market size is estimated to be USD XX Million as of 2022.
5. What are some drivers contributing to market growth?
Rise of E-Commerce; Flourishing Startup Culture.
6. What are the notable trends driving market growth?
OTHER KEY INDUSTRY TRENDS COVERED IN THE REPORT.
7. Are there any restraints impacting market growth?
Slow Penetration Rate in Developing Countries.
8. Can you provide examples of recent developments in the market?
November 2022: The company had announced the opening of its new regional office in Kowloon, Hong Kong. The office would help the company strengthen its expansion, and would cater business needs such as engineering, construction, and sales in the APAC region.November 2022: The company announced the launch of BDx Indonesia, following the completion of a USD 300 million joint venture agreement with PT Indosat Tbk (Indosat Ooredoo Hutchison or IOH) and PT Aplikanusa Lintasarta, Big Data Exchange (BDx).August 2022: Global Switch announced plans of selling its announced plans of selling its USD11 billion business. The companies which plan to purchase the business are EQR, PAG, KKR, Gaw Capital and Stonepeak.
9. What pricing options are available for accessing the report?
Pricing options include single-user, multi-user, and enterprise licenses priced at USD 3800, USD 4500, and USD 5800 respectively.
10. Is the market size provided in terms of value or volume?
The market size is provided in terms of value, measured in Million and volume, measured in K Unit.
11. Are there any specific market keywords associated with the report?
Yes, the market keyword associated with the report is "Hong Kong Data Center Industry," which aids in identifying and referencing the specific market segment covered.
12. How do I determine which pricing option suits my needs best?
The pricing options vary based on user requirements and access needs. Individual users may opt for single-user licenses, while businesses requiring broader access may choose multi-user or enterprise licenses for cost-effective access to the report.
13. Are there any additional resources or data provided in the Hong Kong Data Center Industry report?
While the report offers comprehensive insights, it's advisable to review the specific contents or supplementary materials provided to ascertain if additional resources or data are available.
14. How can I stay updated on further developments or reports in the Hong Kong Data Center Industry?
To stay informed about further developments, trends, and reports in the Hong Kong Data Center Industry, consider subscribing to industry newsletters, following relevant companies and organizations, or regularly checking reputable industry news sources and publications.
Methodology
Step 1 - Identification of Relevant Samples Size from Population Database


Step 2 - Approaches for Defining Global Market Size (Value, Volume* & Price*)

Note*: In applicable scenarios
Step 3 - Data Sources
Primary Research
- Web Analytics
- Survey Reports
- Research Institute
- Latest Research Reports
- Opinion Leaders
Secondary Research
- Annual Reports
- White Paper
- Latest Press Release
- Industry Association
- Paid Database
- Investor Presentations

Step 4 - Data Triangulation
Involves using different sources of information in order to increase the validity of a study
These sources are likely to be stakeholders in a program - participants, other researchers, program staff, other community members, and so on.
Then we put all data in single framework & apply various statistical tools to find out the dynamic on the market.
During the analysis stage, feedback from the stakeholder groups would be compared to determine areas of agreement as well as areas of divergence


