

Key Insights
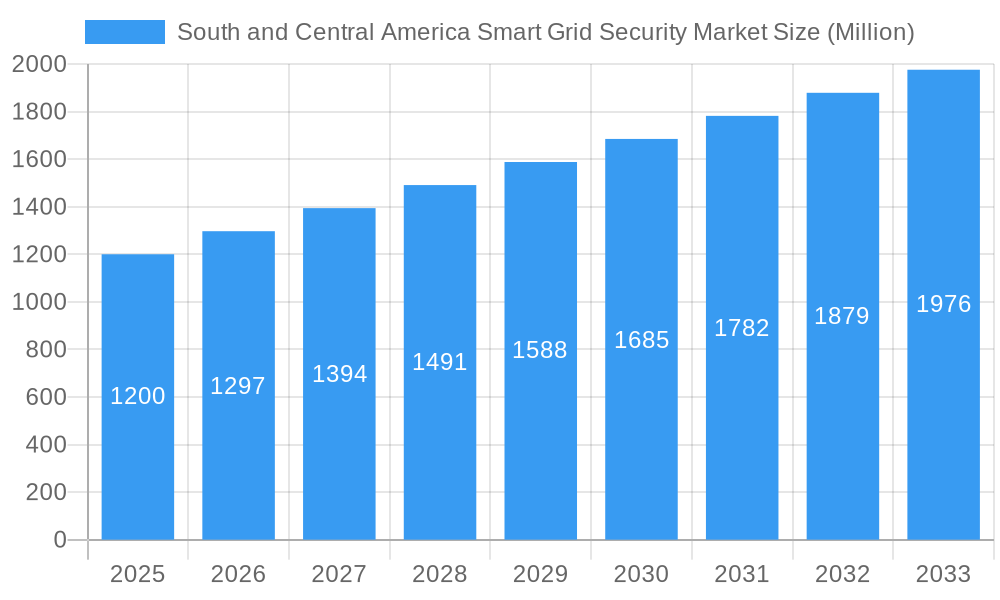
The South and Central America smart grid security market is projected for significant expansion, propelled by the increasing deployment of smart meters and the critical need to protect energy infrastructure. With an estimated market size of $667.75 million in the base year 2025, the region anticipates a Compound Annual Growth Rate (CAGR) of 10.35% through 2033. This growth is driven by substantial investments in modernizing power grids, enhancing energy efficiency, and improving grid reliability across key nations such as Brazil, Mexico, and Argentina. The widespread adoption of smart gas, water, and electricity meters necessitates advanced security solutions to mitigate cyberattacks, data breaches, and unauthorized access. These sophisticated metering infrastructures collect extensive sensitive consumer data, making robust cybersecurity measures essential for utility providers and regulatory bodies.
South and Central America Smart Grid Security Market Market Size (In Million)
Key growth catalysts include government mandates promoting smart grid implementation, heightened awareness of cybersecurity threats within the energy sector, and the demand for real-time grid monitoring and control. The growing complexity of grid operations and the increasing interconnectedness of devices underscore the necessity for comprehensive smart grid security solutions. These encompass network security, data encryption, identity management, and intrusion detection systems. Emerging innovations like AI and machine learning for proactive threat detection, blockchain for secure data exchange, and edge computing for localized security processing are poised to significantly influence market dynamics. However, potential constraints include high implementation costs, a scarcity of skilled cybersecurity professionals, and evolving regulatory frameworks. Nevertheless, the paramount importance of smart grid security in ensuring national energy resilience and maintaining consumer trust will sustain robust market growth throughout the region.
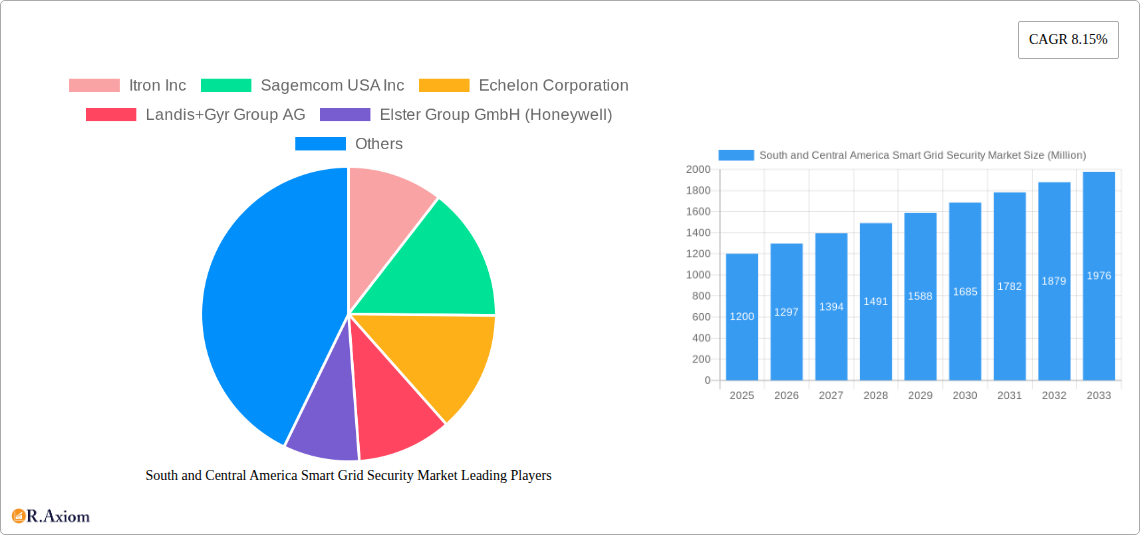
South and Central America Smart Grid Security Market Company Market Share
This comprehensive market research report offers an in-depth analysis of the South and Central America Smart Grid Security Market, examining current trends, growth drivers, challenges, and opportunities. The report covers the historical period from 2019 to 2024, with the base year set at 2025, and provides a detailed forecast extending to 2033. Our objective is to provide industry stakeholders with actionable intelligence for strategic decision-making in this rapidly evolving market.
South and Central America Smart Grid Security Market Market Concentration & Innovation
The South and Central America Smart Grid Security Market exhibits a moderately concentrated landscape, with key players investing heavily in research and development to enhance the security and reliability of smart grid infrastructure. Innovation is primarily driven by the escalating need to protect critical energy and utility networks from sophisticated cyber threats, alongside government mandates for grid modernization and digitalization. Regulatory frameworks, while evolving, are increasingly emphasizing cybersecurity standards and data privacy, thereby influencing product development and market entry strategies. Substitute technologies, such as traditional grid management systems, are gradually being phased out as the benefits of smart grid solutions become more apparent. End-user trends are characterized by a growing demand for resilient, efficient, and secure energy delivery, leading to increased adoption of smart metering and advanced grid analytics. Mergers and acquisitions (M&A) are a significant aspect of market consolidation, with deal values expected to rise as larger companies seek to acquire innovative technologies and expand their regional presence. For instance, Itron Inc.'s strategic partnership with Accell in June 2020 underscores the trend of collaborative growth and regional expansion within the Latin American smart grid security market. The overall market share distribution is influenced by the penetration of smart meters and the adoption rate of advanced cybersecurity solutions across various utilities.
South and Central America Smart Grid Security Market Industry Trends & Insights
The South and Central America Smart Grid Security Market is poised for robust expansion, fueled by a confluence of technological advancements, increasing cybersecurity concerns, and supportive government initiatives. The market is witnessing significant growth driven by the imperative to modernize aging grid infrastructure, enhance operational efficiency, and improve energy distribution reliability. Technological disruptions, such as the proliferation of IoT devices, the integration of AI and machine learning for threat detection, and the adoption of blockchain for secure data management, are transforming the smart grid landscape. Consumer preferences are shifting towards a greater demand for reliable power supply, reduced energy wastage, and increased control over their energy consumption, which smart grid technologies effectively address. Competitive dynamics are intensifying as both established technology providers and emerging cybersecurity specialists vie for market share. The market penetration of smart meters, a foundational element of smart grids, is steadily increasing, creating a larger attack surface that necessitates robust security solutions. The projected Compound Annual Growth Rate (CAGR) for the forecast period highlights the substantial potential within this market. Key trends include the increasing investment in advanced metering infrastructure (AMI) that requires sophisticated security protocols to safeguard against data breaches and unauthorized access. Furthermore, the growing adoption of distributed energy resources (DERs) and the complexity of managing bidirectional energy flows demand advanced security frameworks. Utilities are increasingly prioritizing solutions that offer real-time monitoring, anomaly detection, and proactive threat mitigation to ensure grid stability and resilience. The market also sees a growing emphasis on developing secure communication protocols and encryption standards to protect sensitive grid data transmitted across vast networks. The rising sophistication of cyber threats, including ransomware and denial-of-service attacks targeting critical infrastructure, is a primary catalyst for the adoption of comprehensive smart grid security solutions.
Dominant Markets & Segments in South and Central America Smart Grid Security Market
The South and Central America Smart Grid Security Market is experiencing significant growth across its various segments, with a discernible dominance in specific regions and meter types. Brazil and Mexico are emerging as the leading markets due to their large populations, extensive energy grids, and proactive government initiatives aimed at modernizing their utility infrastructure. The Smart Electricity Meter segment, in particular, holds a dominant position. This is driven by widespread government mandates for smart meter deployment, aimed at improving billing accuracy, reducing transmission losses, and enabling dynamic pricing mechanisms. The economic policies in these nations favor investments in energy infrastructure upgrades, directly impacting the demand for smart grid security solutions.
- Brazil: As the largest economy in South America, Brazil's commitment to smart grid development is a major growth engine. Initiatives to integrate renewable energy sources and enhance grid resilience are driving the adoption of smart electricity meters and associated security technologies. High electricity consumption and the need for efficient grid management further bolster this segment.
- Mexico: Mexico's focus on energy sector reforms and attracting foreign investment has spurred significant growth in smart grid deployments. The government's ambitious targets for smart meter installation are creating substantial opportunities for smart grid security providers. The demand for secure data transmission and protection against cyber threats is paramount.
- Argentina: While facing economic fluctuations, Argentina is also investing in smart grid technologies to improve energy efficiency and reliability. The adoption of smart electricity meters is gaining traction, supported by initiatives to modernize the national grid.
- Chile: Chile's strong emphasis on renewable energy integration and its advanced technological adoption make it a significant market for smart grid security. The country's robust regulatory framework supports the deployment of secure smart metering solutions.
- Rest of South and Central America: Emerging economies within the region are gradually increasing their investment in smart grid infrastructure, presenting a growing, albeit fragmented, market for smart grid security solutions.
The Smart Gas Meter and Smart Water Meter segments are also experiencing robust growth, albeit at a slightly slower pace than electricity meters. The drivers for these segments include the need for improved resource management, leak detection, and accurate billing. Countries like Brazil and Mexico are also leading the adoption of smart gas and water meters, driven by aging infrastructure and the desire for more efficient utility operations. The economic policies and infrastructure development plans in these nations are crucial in shaping the dominance of specific meter types and geographical regions within the smart grid security market. The competitive landscape within these dominant segments is characterized by a blend of global players and regional specialists offering a range of cybersecurity solutions tailored to the specific needs of smart meters.
South and Central America Smart Grid Security Market Product Developments
Product developments in the South and Central America Smart Grid Security Market are focused on creating robust, scalable, and intelligent solutions to safeguard critical energy infrastructure. Innovations are centered on advanced threat detection systems, secure communication protocols, and data encryption technologies tailored for smart meters and grid management platforms. Companies are emphasizing solutions that offer real-time monitoring, anomaly detection, and proactive incident response capabilities. The competitive advantage lies in developing cybersecurity solutions that are compliant with evolving regional regulations and can seamlessly integrate with existing smart grid architectures, thereby enhancing the overall resilience and security of utility operations across the region.
Report Scope & Segmentation Analysis
This report meticulously analyzes the South and Central America Smart Grid Security Market, segmenting it by meter type and geographical region. The meter types covered include Smart Gas Meter, Smart Water Meter, and Smart Electricity Meter. Geographically, the market is divided into Brazil, Mexico, Argentina, Chile, and the Rest of South and Central America. Each segment is analyzed for its current market size, projected growth rates, and competitive dynamics. For instance, the Smart Electricity Meter segment in Brazil is expected to witness substantial market expansion due to ongoing grid modernization projects and government-led smart meter deployment programs. The competitive landscape within each segment is further examined to understand the strategies and market positioning of key players.
Key Drivers of South and Central America Smart Grid Security Market Growth
The growth of the South and Central America Smart Grid Security Market is primarily driven by several interconnected factors. Firstly, the increasing frequency and sophistication of cyber threats targeting critical infrastructure necessitate robust security solutions to protect energy grids from disruptions and data breaches. Secondly, government initiatives and regulatory mandates in countries like Brazil and Mexico are promoting the modernization of energy networks and the deployment of smart meters, which in turn drives demand for associated security technologies. Thirdly, the growing adoption of renewable energy sources and distributed energy resources (DERs) introduces new complexities in grid management, requiring advanced security frameworks to ensure stability and reliability. Furthermore, utilities are prioritizing operational efficiency and cost reduction, making smart grid solutions, underpinned by strong security, an attractive investment.
Challenges in the South and Central America Smart Grid Security Market Sector
Despite the promising growth prospects, the South and Central America Smart Grid Security Market faces several challenges. A significant barrier is the varying maturity of cybersecurity regulations across different countries, leading to a fragmented compliance landscape. The high cost of implementing advanced security solutions can be a deterrent for smaller utilities or those operating in economically constrained regions. Furthermore, a persistent shortage of skilled cybersecurity professionals in the region limits the effective deployment and management of sophisticated security systems. Supply chain disruptions and the reliance on imported technologies can also pose challenges. Finally, the ongoing threat of sophisticated cyberattacks, coupled with the increasing complexity of smart grid architectures, creates a continuous need for evolving and adaptable security measures.
Emerging Opportunities in South and Central America Smart Grid Security Market
Emerging opportunities within the South and Central America Smart Grid Security Market are multifaceted. The rapid growth of the Internet of Things (IoT) in the energy sector presents new avenues for securing connected devices and data streams. The increasing focus on smart city initiatives across the region will further accelerate the demand for integrated smart grid security solutions. Advancements in Artificial Intelligence (AI) and Machine Learning (ML) offer promising opportunities for developing predictive threat intelligence and automated incident response systems. Moreover, the growing adoption of electric vehicles (EVs) and the associated charging infrastructure will necessitate enhanced grid security to manage the increased load and ensure reliable power supply. Collaboration between public and private sectors is also creating new opportunities for developing and deploying innovative security solutions tailored to the unique needs of the region.
Leading Players in the South and Central America Smart Grid Security Market Market
- Itron Inc.
- Sagemcom USA Inc.
- Echelon Corporation
- Landis+Gyr Group AG
- Elster Group GmbH (Honeywell)
- Arad Group
- Diehl Stiftung & Co KG
- General Electric Company
- Kamstrup AS
- Zenner International GmbH & Co KG
- Sensus USA Inc.
- Wasion Group Holdings
Key Developments in South and Central America Smart Grid Security Market Industry
- June 2020 - Itron Inc. announced partnership with Accell, as Itron's regional partner and lead distributor for the Latin America region. As part of the agreement, Accell will manufacture devices sold in Latin America and provide services and support for those products. By partnering with Accell in Latin America, Itron furthers its strategy to enhance flexibility to capitalize on other opportunities. Accell is better situated to serve customers, partners and deliver new levels of success in the region.
- January 2020 - Kamstrup completed the acquisition of a smaller Danish software company Blue Control. The acquisition and investment in Blue Control is part of its long-term strategy to increase its growth within digital solutions for the water industry. At the same time it is about supporting a company in developing their product and business.
Strategic Outlook for South and Central America Smart Grid Security Market Market
The strategic outlook for the South and Central America Smart Grid Security Market is one of sustained growth and increasing sophistication. The market will be driven by the continuous need to enhance grid resilience against evolving cyber threats and the ongoing digital transformation of the energy sector. Strategic investments in advanced cybersecurity technologies, such as AI-powered threat detection and blockchain for secure data integrity, will be crucial. Partnerships and collaborations between technology providers, utilities, and government bodies will play a pivotal role in accelerating adoption and fostering innovation. The increasing adoption of smart meters across all utility sectors will further solidify the market's foundation. Furthermore, the growing emphasis on energy independence and the integration of renewable energy sources will necessitate robust and secure grid management systems, presenting significant future market potential and opportunities for proactive industry players.
South and Central America Smart Grid Security Market Segmentation
-
1. Smart Gas Meter
- 1.1. Brazil
- 1.2. Mexico
- 1.3. Argentina
- 1.4. Chile
- 1.5. Rest of South and Central America
-
2. Smart Water Meter
- 2.1. Brazil
- 2.2. Mexico
- 2.3. Argentina
- 2.4. Chile
- 2.5. Rest of South and Central America
-
3. Smart Electricity Meter
- 3.1. Brazil
- 3.2. Mexico
- 3.3. Argentina
- 3.4. Chile
- 3.5. Rest of South and Central America
South and Central America Smart Grid Security Market Segmentation By Geography
-
1. North America
- 1.1. United States
- 1.2. Canada
- 1.3. Mexico
-
2. South America
- 2.1. Brazil
- 2.2. Argentina
- 2.3. Rest of South America
-
3. Europe
- 3.1. United Kingdom
- 3.2. Germany
- 3.3. France
- 3.4. Italy
- 3.5. Spain
- 3.6. Russia
- 3.7. Benelux
- 3.8. Nordics
- 3.9. Rest of Europe
-
4. Middle East & Africa
- 4.1. Turkey
- 4.2. Israel
- 4.3. GCC
- 4.4. North Africa
- 4.5. South Africa
- 4.6. Rest of Middle East & Africa
-
5. Asia Pacific
- 5.1. China
- 5.2. India
- 5.3. Japan
- 5.4. South Korea
- 5.5. ASEAN
- 5.6. Oceania
- 5.7. Rest of Asia Pacific
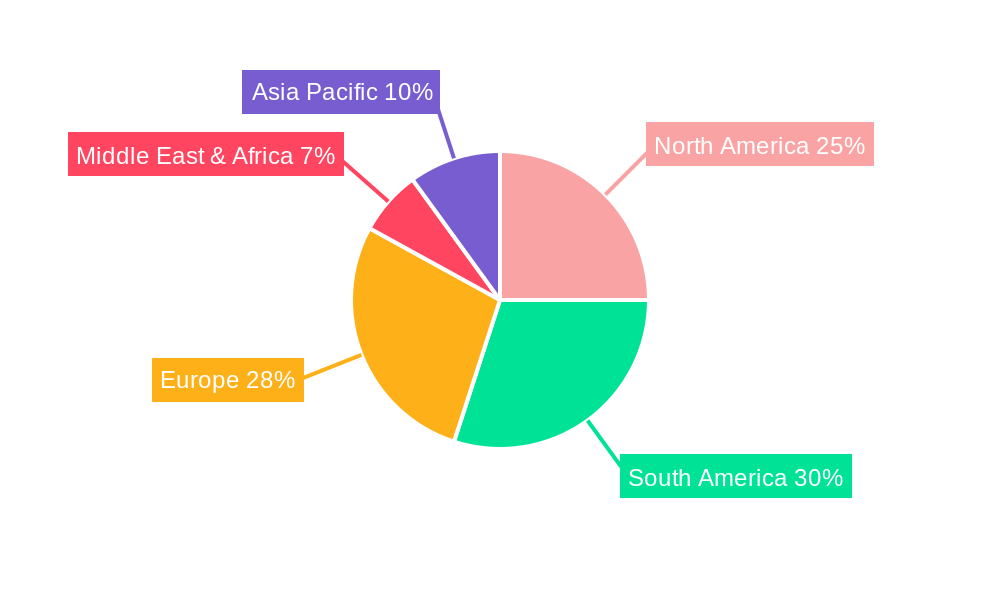
South and Central America Smart Grid Security Market Regional Market Share
Geographic Coverage of South and Central America Smart Grid Security Market
South and Central America Smart Grid Security Market REPORT HIGHLIGHTS
| Aspects | Details |
|---|---|
| Study Period | 2020-2034 |
| Base Year | 2025 |
| Estimated Year | 2026 |
| Forecast Period | 2026-2034 |
| Historical Period | 2020-2025 |
| Growth Rate | CAGR of 10.35% from 2020-2034 |
| Segmentation |
|
Table of Contents
- 1. Introduction
- 1.1. Research Scope
- 1.2. Market Segmentation
- 1.3. Research Objective
- 1.4. Definitions and Assumptions
- 2. Executive Summary
- 2.1. Market Snapshot
- 3. Market Dynamics
- 3.1. Market Drivers
- 3.2. Market Restrains
- 3.3. Market Trends
- 3.4. Market Opportunities
- 4. Market Factor Analysis
- 4.1. Porters Five Forces
- 4.1.1. Bargaining Power of Suppliers
- 4.1.2. Bargaining Power of Buyers
- 4.1.3. Threat of New Entrants
- 4.1.4. Threat of Substitutes
- 4.1.5. Competitive Rivalry
- 4.2. PESTEL analysis
- 4.3. BCG Analysis
- 4.3.1. Stars (High Growth, High Market Share)
- 4.3.2. Cash Cows (Low Growth, High Market Share)
- 4.3.3. Question Mark (High Growth, Low Market Share)
- 4.3.4. Dogs (Low Growth, Low Market Share)
- 4.4. Ansoff Matrix Analysis
- 4.5. Supply Chain Analysis
- 4.6. Regulatory Landscape
- 4.7. Current Market Potential and Opportunity Assessment (TAM–SAM–SOM Framework)
- 4.8. RAX Analyst Note
- 4.1. Porters Five Forces
- 5. Market Analysis, Insights and Forecast 2021-2033
- 5.1. Market Analysis, Insights and Forecast - by Smart Gas Meter
- 5.1.1. Brazil
- 5.1.2. Mexico
- 5.1.3. Argentina
- 5.1.4. Chile
- 5.1.5. Rest of South and Central America
- 5.2. Market Analysis, Insights and Forecast - by Smart Water Meter
- 5.2.1. Brazil
- 5.2.2. Mexico
- 5.2.3. Argentina
- 5.2.4. Chile
- 5.2.5. Rest of South and Central America
- 5.3. Market Analysis, Insights and Forecast - by Smart Electricity Meter
- 5.3.1. Brazil
- 5.3.2. Mexico
- 5.3.3. Argentina
- 5.3.4. Chile
- 5.3.5. Rest of South and Central America
- 5.4. Market Analysis, Insights and Forecast - by Region
- 5.4.1. North America
- 5.4.2. South America
- 5.4.3. Europe
- 5.4.4. Middle East & Africa
- 5.4.5. Asia Pacific
- 5.1. Market Analysis, Insights and Forecast - by Smart Gas Meter
- 6. Global South and Central America Smart Grid Security Market Analysis, Insights and Forecast, 2021-2033
- 6.1. Market Analysis, Insights and Forecast - by Smart Gas Meter
- 6.1.1. Brazil
- 6.1.2. Mexico
- 6.1.3. Argentina
- 6.1.4. Chile
- 6.1.5. Rest of South and Central America
- 6.2. Market Analysis, Insights and Forecast - by Smart Water Meter
- 6.2.1. Brazil
- 6.2.2. Mexico
- 6.2.3. Argentina
- 6.2.4. Chile
- 6.2.5. Rest of South and Central America
- 6.3. Market Analysis, Insights and Forecast - by Smart Electricity Meter
- 6.3.1. Brazil
- 6.3.2. Mexico
- 6.3.3. Argentina
- 6.3.4. Chile
- 6.3.5. Rest of South and Central America
- 6.1. Market Analysis, Insights and Forecast - by Smart Gas Meter
- 7. North America South and Central America Smart Grid Security Market Analysis, Insights and Forecast, 2020-2032
- 7.1. Market Analysis, Insights and Forecast - by Smart Gas Meter
- 7.1.1. Brazil
- 7.1.2. Mexico
- 7.1.3. Argentina
- 7.1.4. Chile
- 7.1.5. Rest of South and Central America
- 7.2. Market Analysis, Insights and Forecast - by Smart Water Meter
- 7.2.1. Brazil
- 7.2.2. Mexico
- 7.2.3. Argentina
- 7.2.4. Chile
- 7.2.5. Rest of South and Central America
- 7.3. Market Analysis, Insights and Forecast - by Smart Electricity Meter
- 7.3.1. Brazil
- 7.3.2. Mexico
- 7.3.3. Argentina
- 7.3.4. Chile
- 7.3.5. Rest of South and Central America
- 7.1. Market Analysis, Insights and Forecast - by Smart Gas Meter
- 8. South America South and Central America Smart Grid Security Market Analysis, Insights and Forecast, 2020-2032
- 8.1. Market Analysis, Insights and Forecast - by Smart Gas Meter
- 8.1.1. Brazil
- 8.1.2. Mexico
- 8.1.3. Argentina
- 8.1.4. Chile
- 8.1.5. Rest of South and Central America
- 8.2. Market Analysis, Insights and Forecast - by Smart Water Meter
- 8.2.1. Brazil
- 8.2.2. Mexico
- 8.2.3. Argentina
- 8.2.4. Chile
- 8.2.5. Rest of South and Central America
- 8.3. Market Analysis, Insights and Forecast - by Smart Electricity Meter
- 8.3.1. Brazil
- 8.3.2. Mexico
- 8.3.3. Argentina
- 8.3.4. Chile
- 8.3.5. Rest of South and Central America
- 8.1. Market Analysis, Insights and Forecast - by Smart Gas Meter
- 9. Europe South and Central America Smart Grid Security Market Analysis, Insights and Forecast, 2020-2032
- 9.1. Market Analysis, Insights and Forecast - by Smart Gas Meter
- 9.1.1. Brazil
- 9.1.2. Mexico
- 9.1.3. Argentina
- 9.1.4. Chile
- 9.1.5. Rest of South and Central America
- 9.2. Market Analysis, Insights and Forecast - by Smart Water Meter
- 9.2.1. Brazil
- 9.2.2. Mexico
- 9.2.3. Argentina
- 9.2.4. Chile
- 9.2.5. Rest of South and Central America
- 9.3. Market Analysis, Insights and Forecast - by Smart Electricity Meter
- 9.3.1. Brazil
- 9.3.2. Mexico
- 9.3.3. Argentina
- 9.3.4. Chile
- 9.3.5. Rest of South and Central America
- 9.1. Market Analysis, Insights and Forecast - by Smart Gas Meter
- 10. Middle East & Africa South and Central America Smart Grid Security Market Analysis, Insights and Forecast, 2020-2032
- 10.1. Market Analysis, Insights and Forecast - by Smart Gas Meter
- 10.1.1. Brazil
- 10.1.2. Mexico
- 10.1.3. Argentina
- 10.1.4. Chile
- 10.1.5. Rest of South and Central America
- 10.2. Market Analysis, Insights and Forecast - by Smart Water Meter
- 10.2.1. Brazil
- 10.2.2. Mexico
- 10.2.3. Argentina
- 10.2.4. Chile
- 10.2.5. Rest of South and Central America
- 10.3. Market Analysis, Insights and Forecast - by Smart Electricity Meter
- 10.3.1. Brazil
- 10.3.2. Mexico
- 10.3.3. Argentina
- 10.3.4. Chile
- 10.3.5. Rest of South and Central America
- 10.1. Market Analysis, Insights and Forecast - by Smart Gas Meter
- 11. Asia Pacific South and Central America Smart Grid Security Market Analysis, Insights and Forecast, 2020-2032
- 11.1. Market Analysis, Insights and Forecast - by Smart Gas Meter
- 11.1.1. Brazil
- 11.1.2. Mexico
- 11.1.3. Argentina
- 11.1.4. Chile
- 11.1.5. Rest of South and Central America
- 11.2. Market Analysis, Insights and Forecast - by Smart Water Meter
- 11.2.1. Brazil
- 11.2.2. Mexico
- 11.2.3. Argentina
- 11.2.4. Chile
- 11.2.5. Rest of South and Central America
- 11.3. Market Analysis, Insights and Forecast - by Smart Electricity Meter
- 11.3.1. Brazil
- 11.3.2. Mexico
- 11.3.3. Argentina
- 11.3.4. Chile
- 11.3.5. Rest of South and Central America
- 11.1. Market Analysis, Insights and Forecast - by Smart Gas Meter
- 12. Competitive Analysis
- 12.1. Company Profiles
- 12.1.1 Itron Inc
- 12.1.1.1. Company Overview
- 12.1.1.2. Products
- 12.1.1.3. Company Financials
- 12.1.1.4. SWOT Analysis
- 12.1.2 Sagemcom USA Inc
- 12.1.2.1. Company Overview
- 12.1.2.2. Products
- 12.1.2.3. Company Financials
- 12.1.2.4. SWOT Analysis
- 12.1.3 Echelon Corporation
- 12.1.3.1. Company Overview
- 12.1.3.2. Products
- 12.1.3.3. Company Financials
- 12.1.3.4. SWOT Analysis
- 12.1.4 Landis+Gyr Group AG
- 12.1.4.1. Company Overview
- 12.1.4.2. Products
- 12.1.4.3. Company Financials
- 12.1.4.4. SWOT Analysis
- 12.1.5 Elster Group GmbH (Honeywell)
- 12.1.5.1. Company Overview
- 12.1.5.2. Products
- 12.1.5.3. Company Financials
- 12.1.5.4. SWOT Analysis
- 12.1.6 Arad Group
- 12.1.6.1. Company Overview
- 12.1.6.2. Products
- 12.1.6.3. Company Financials
- 12.1.6.4. SWOT Analysis
- 12.1.7 Diehl Stiftung & Co KG
- 12.1.7.1. Company Overview
- 12.1.7.2. Products
- 12.1.7.3. Company Financials
- 12.1.7.4. SWOT Analysis
- 12.1.8 General Electric Compan
- 12.1.8.1. Company Overview
- 12.1.8.2. Products
- 12.1.8.3. Company Financials
- 12.1.8.4. SWOT Analysis
- 12.1.9 Kamstrup AS
- 12.1.9.1. Company Overview
- 12.1.9.2. Products
- 12.1.9.3. Company Financials
- 12.1.9.4. SWOT Analysis
- 12.1.10 Zenner International GmbH & Co KG
- 12.1.10.1. Company Overview
- 12.1.10.2. Products
- 12.1.10.3. Company Financials
- 12.1.10.4. SWOT Analysis
- 12.1.11 Sensus USA Inc
- 12.1.11.1. Company Overview
- 12.1.11.2. Products
- 12.1.11.3. Company Financials
- 12.1.11.4. SWOT Analysis
- 12.1.12 Wasion Group Holdings
- 12.1.12.1. Company Overview
- 12.1.12.2. Products
- 12.1.12.3. Company Financials
- 12.1.12.4. SWOT Analysis
- 12.1.1 Itron Inc
- 12.2. Market Entropy
- 12.2.1 Company's Key Areas Served
- 12.2.2 Recent Developments
- 12.3. Company Market Share Analysis 2025
- 12.3.1 Top 5 Companies Market Share Analysis
- 12.3.2 Top 3 Companies Market Share Analysis
- 12.4. List of Potential Customers
- 13. Research Methodology
List of Figures
- Figure 1: Global South and Central America Smart Grid Security Market Revenue Breakdown (million, %) by Region 2025 & 2033
- Figure 2: Global South and Central America Smart Grid Security Market Volume Breakdown (Million, %) by Region 2025 & 2033
- Figure 3: North America South and Central America Smart Grid Security Market Revenue (million), by Smart Gas Meter 2025 & 2033
- Figure 4: North America South and Central America Smart Grid Security Market Volume (Million), by Smart Gas Meter 2025 & 2033
- Figure 5: North America South and Central America Smart Grid Security Market Revenue Share (%), by Smart Gas Meter 2025 & 2033
- Figure 6: North America South and Central America Smart Grid Security Market Volume Share (%), by Smart Gas Meter 2025 & 2033
- Figure 7: North America South and Central America Smart Grid Security Market Revenue (million), by Smart Water Meter 2025 & 2033
- Figure 8: North America South and Central America Smart Grid Security Market Volume (Million), by Smart Water Meter 2025 & 2033
- Figure 9: North America South and Central America Smart Grid Security Market Revenue Share (%), by Smart Water Meter 2025 & 2033
- Figure 10: North America South and Central America Smart Grid Security Market Volume Share (%), by Smart Water Meter 2025 & 2033
- Figure 11: North America South and Central America Smart Grid Security Market Revenue (million), by Smart Electricity Meter 2025 & 2033
- Figure 12: North America South and Central America Smart Grid Security Market Volume (Million), by Smart Electricity Meter 2025 & 2033
- Figure 13: North America South and Central America Smart Grid Security Market Revenue Share (%), by Smart Electricity Meter 2025 & 2033
- Figure 14: North America South and Central America Smart Grid Security Market Volume Share (%), by Smart Electricity Meter 2025 & 2033
- Figure 15: North America South and Central America Smart Grid Security Market Revenue (million), by Country 2025 & 2033
- Figure 16: North America South and Central America Smart Grid Security Market Volume (Million), by Country 2025 & 2033
- Figure 17: North America South and Central America Smart Grid Security Market Revenue Share (%), by Country 2025 & 2033
- Figure 18: North America South and Central America Smart Grid Security Market Volume Share (%), by Country 2025 & 2033
- Figure 19: South America South and Central America Smart Grid Security Market Revenue (million), by Smart Gas Meter 2025 & 2033
- Figure 20: South America South and Central America Smart Grid Security Market Volume (Million), by Smart Gas Meter 2025 & 2033
- Figure 21: South America South and Central America Smart Grid Security Market Revenue Share (%), by Smart Gas Meter 2025 & 2033
- Figure 22: South America South and Central America Smart Grid Security Market Volume Share (%), by Smart Gas Meter 2025 & 2033
- Figure 23: South America South and Central America Smart Grid Security Market Revenue (million), by Smart Water Meter 2025 & 2033
- Figure 24: South America South and Central America Smart Grid Security Market Volume (Million), by Smart Water Meter 2025 & 2033
- Figure 25: South America South and Central America Smart Grid Security Market Revenue Share (%), by Smart Water Meter 2025 & 2033
- Figure 26: South America South and Central America Smart Grid Security Market Volume Share (%), by Smart Water Meter 2025 & 2033
- Figure 27: South America South and Central America Smart Grid Security Market Revenue (million), by Smart Electricity Meter 2025 & 2033
- Figure 28: South America South and Central America Smart Grid Security Market Volume (Million), by Smart Electricity Meter 2025 & 2033
- Figure 29: South America South and Central America Smart Grid Security Market Revenue Share (%), by Smart Electricity Meter 2025 & 2033
- Figure 30: South America South and Central America Smart Grid Security Market Volume Share (%), by Smart Electricity Meter 2025 & 2033
- Figure 31: South America South and Central America Smart Grid Security Market Revenue (million), by Country 2025 & 2033
- Figure 32: South America South and Central America Smart Grid Security Market Volume (Million), by Country 2025 & 2033
- Figure 33: South America South and Central America Smart Grid Security Market Revenue Share (%), by Country 2025 & 2033
- Figure 34: South America South and Central America Smart Grid Security Market Volume Share (%), by Country 2025 & 2033
- Figure 35: Europe South and Central America Smart Grid Security Market Revenue (million), by Smart Gas Meter 2025 & 2033
- Figure 36: Europe South and Central America Smart Grid Security Market Volume (Million), by Smart Gas Meter 2025 & 2033
- Figure 37: Europe South and Central America Smart Grid Security Market Revenue Share (%), by Smart Gas Meter 2025 & 2033
- Figure 38: Europe South and Central America Smart Grid Security Market Volume Share (%), by Smart Gas Meter 2025 & 2033
- Figure 39: Europe South and Central America Smart Grid Security Market Revenue (million), by Smart Water Meter 2025 & 2033
- Figure 40: Europe South and Central America Smart Grid Security Market Volume (Million), by Smart Water Meter 2025 & 2033
- Figure 41: Europe South and Central America Smart Grid Security Market Revenue Share (%), by Smart Water Meter 2025 & 2033
- Figure 42: Europe South and Central America Smart Grid Security Market Volume Share (%), by Smart Water Meter 2025 & 2033
- Figure 43: Europe South and Central America Smart Grid Security Market Revenue (million), by Smart Electricity Meter 2025 & 2033
- Figure 44: Europe South and Central America Smart Grid Security Market Volume (Million), by Smart Electricity Meter 2025 & 2033
- Figure 45: Europe South and Central America Smart Grid Security Market Revenue Share (%), by Smart Electricity Meter 2025 & 2033
- Figure 46: Europe South and Central America Smart Grid Security Market Volume Share (%), by Smart Electricity Meter 2025 & 2033
- Figure 47: Europe South and Central America Smart Grid Security Market Revenue (million), by Country 2025 & 2033
- Figure 48: Europe South and Central America Smart Grid Security Market Volume (Million), by Country 2025 & 2033
- Figure 49: Europe South and Central America Smart Grid Security Market Revenue Share (%), by Country 2025 & 2033
- Figure 50: Europe South and Central America Smart Grid Security Market Volume Share (%), by Country 2025 & 2033
- Figure 51: Middle East & Africa South and Central America Smart Grid Security Market Revenue (million), by Smart Gas Meter 2025 & 2033
- Figure 52: Middle East & Africa South and Central America Smart Grid Security Market Volume (Million), by Smart Gas Meter 2025 & 2033
- Figure 53: Middle East & Africa South and Central America Smart Grid Security Market Revenue Share (%), by Smart Gas Meter 2025 & 2033
- Figure 54: Middle East & Africa South and Central America Smart Grid Security Market Volume Share (%), by Smart Gas Meter 2025 & 2033
- Figure 55: Middle East & Africa South and Central America Smart Grid Security Market Revenue (million), by Smart Water Meter 2025 & 2033
- Figure 56: Middle East & Africa South and Central America Smart Grid Security Market Volume (Million), by Smart Water Meter 2025 & 2033
- Figure 57: Middle East & Africa South and Central America Smart Grid Security Market Revenue Share (%), by Smart Water Meter 2025 & 2033
- Figure 58: Middle East & Africa South and Central America Smart Grid Security Market Volume Share (%), by Smart Water Meter 2025 & 2033
- Figure 59: Middle East & Africa South and Central America Smart Grid Security Market Revenue (million), by Smart Electricity Meter 2025 & 2033
- Figure 60: Middle East & Africa South and Central America Smart Grid Security Market Volume (Million), by Smart Electricity Meter 2025 & 2033
- Figure 61: Middle East & Africa South and Central America Smart Grid Security Market Revenue Share (%), by Smart Electricity Meter 2025 & 2033
- Figure 62: Middle East & Africa South and Central America Smart Grid Security Market Volume Share (%), by Smart Electricity Meter 2025 & 2033
- Figure 63: Middle East & Africa South and Central America Smart Grid Security Market Revenue (million), by Country 2025 & 2033
- Figure 64: Middle East & Africa South and Central America Smart Grid Security Market Volume (Million), by Country 2025 & 2033
- Figure 65: Middle East & Africa South and Central America Smart Grid Security Market Revenue Share (%), by Country 2025 & 2033
- Figure 66: Middle East & Africa South and Central America Smart Grid Security Market Volume Share (%), by Country 2025 & 2033
- Figure 67: Asia Pacific South and Central America Smart Grid Security Market Revenue (million), by Smart Gas Meter 2025 & 2033
- Figure 68: Asia Pacific South and Central America Smart Grid Security Market Volume (Million), by Smart Gas Meter 2025 & 2033
- Figure 69: Asia Pacific South and Central America Smart Grid Security Market Revenue Share (%), by Smart Gas Meter 2025 & 2033
- Figure 70: Asia Pacific South and Central America Smart Grid Security Market Volume Share (%), by Smart Gas Meter 2025 & 2033
- Figure 71: Asia Pacific South and Central America Smart Grid Security Market Revenue (million), by Smart Water Meter 2025 & 2033
- Figure 72: Asia Pacific South and Central America Smart Grid Security Market Volume (Million), by Smart Water Meter 2025 & 2033
- Figure 73: Asia Pacific South and Central America Smart Grid Security Market Revenue Share (%), by Smart Water Meter 2025 & 2033
- Figure 74: Asia Pacific South and Central America Smart Grid Security Market Volume Share (%), by Smart Water Meter 2025 & 2033
- Figure 75: Asia Pacific South and Central America Smart Grid Security Market Revenue (million), by Smart Electricity Meter 2025 & 2033
- Figure 76: Asia Pacific South and Central America Smart Grid Security Market Volume (Million), by Smart Electricity Meter 2025 & 2033
- Figure 77: Asia Pacific South and Central America Smart Grid Security Market Revenue Share (%), by Smart Electricity Meter 2025 & 2033
- Figure 78: Asia Pacific South and Central America Smart Grid Security Market Volume Share (%), by Smart Electricity Meter 2025 & 2033
- Figure 79: Asia Pacific South and Central America Smart Grid Security Market Revenue (million), by Country 2025 & 2033
- Figure 80: Asia Pacific South and Central America Smart Grid Security Market Volume (Million), by Country 2025 & 2033
- Figure 81: Asia Pacific South and Central America Smart Grid Security Market Revenue Share (%), by Country 2025 & 2033
- Figure 82: Asia Pacific South and Central America Smart Grid Security Market Volume Share (%), by Country 2025 & 2033
List of Tables
- Table 1: Global South and Central America Smart Grid Security Market Revenue million Forecast, by Smart Gas Meter 2020 & 2033
- Table 2: Global South and Central America Smart Grid Security Market Volume Million Forecast, by Smart Gas Meter 2020 & 2033
- Table 3: Global South and Central America Smart Grid Security Market Revenue million Forecast, by Smart Water Meter 2020 & 2033
- Table 4: Global South and Central America Smart Grid Security Market Volume Million Forecast, by Smart Water Meter 2020 & 2033
- Table 5: Global South and Central America Smart Grid Security Market Revenue million Forecast, by Smart Electricity Meter 2020 & 2033
- Table 6: Global South and Central America Smart Grid Security Market Volume Million Forecast, by Smart Electricity Meter 2020 & 2033
- Table 7: Global South and Central America Smart Grid Security Market Revenue million Forecast, by Region 2020 & 2033
- Table 8: Global South and Central America Smart Grid Security Market Volume Million Forecast, by Region 2020 & 2033
- Table 9: Global South and Central America Smart Grid Security Market Revenue million Forecast, by Smart Gas Meter 2020 & 2033
- Table 10: Global South and Central America Smart Grid Security Market Volume Million Forecast, by Smart Gas Meter 2020 & 2033
- Table 11: Global South and Central America Smart Grid Security Market Revenue million Forecast, by Smart Water Meter 2020 & 2033
- Table 12: Global South and Central America Smart Grid Security Market Volume Million Forecast, by Smart Water Meter 2020 & 2033
- Table 13: Global South and Central America Smart Grid Security Market Revenue million Forecast, by Smart Electricity Meter 2020 & 2033
- Table 14: Global South and Central America Smart Grid Security Market Volume Million Forecast, by Smart Electricity Meter 2020 & 2033
- Table 15: Global South and Central America Smart Grid Security Market Revenue million Forecast, by Country 2020 & 2033
- Table 16: Global South and Central America Smart Grid Security Market Volume Million Forecast, by Country 2020 & 2033
- Table 17: United States South and Central America Smart Grid Security Market Revenue (million) Forecast, by Application 2020 & 2033
- Table 18: United States South and Central America Smart Grid Security Market Volume (Million) Forecast, by Application 2020 & 2033
- Table 19: Canada South and Central America Smart Grid Security Market Revenue (million) Forecast, by Application 2020 & 2033
- Table 20: Canada South and Central America Smart Grid Security Market Volume (Million) Forecast, by Application 2020 & 2033
- Table 21: Mexico South and Central America Smart Grid Security Market Revenue (million) Forecast, by Application 2020 & 2033
- Table 22: Mexico South and Central America Smart Grid Security Market Volume (Million) Forecast, by Application 2020 & 2033
- Table 23: Global South and Central America Smart Grid Security Market Revenue million Forecast, by Smart Gas Meter 2020 & 2033
- Table 24: Global South and Central America Smart Grid Security Market Volume Million Forecast, by Smart Gas Meter 2020 & 2033
- Table 25: Global South and Central America Smart Grid Security Market Revenue million Forecast, by Smart Water Meter 2020 & 2033
- Table 26: Global South and Central America Smart Grid Security Market Volume Million Forecast, by Smart Water Meter 2020 & 2033
- Table 27: Global South and Central America Smart Grid Security Market Revenue million Forecast, by Smart Electricity Meter 2020 & 2033
- Table 28: Global South and Central America Smart Grid Security Market Volume Million Forecast, by Smart Electricity Meter 2020 & 2033
- Table 29: Global South and Central America Smart Grid Security Market Revenue million Forecast, by Country 2020 & 2033
- Table 30: Global South and Central America Smart Grid Security Market Volume Million Forecast, by Country 2020 & 2033
- Table 31: Brazil South and Central America Smart Grid Security Market Revenue (million) Forecast, by Application 2020 & 2033
- Table 32: Brazil South and Central America Smart Grid Security Market Volume (Million) Forecast, by Application 2020 & 2033
- Table 33: Argentina South and Central America Smart Grid Security Market Revenue (million) Forecast, by Application 2020 & 2033
- Table 34: Argentina South and Central America Smart Grid Security Market Volume (Million) Forecast, by Application 2020 & 2033
- Table 35: Rest of South America South and Central America Smart Grid Security Market Revenue (million) Forecast, by Application 2020 & 2033
- Table 36: Rest of South America South and Central America Smart Grid Security Market Volume (Million) Forecast, by Application 2020 & 2033
- Table 37: Global South and Central America Smart Grid Security Market Revenue million Forecast, by Smart Gas Meter 2020 & 2033
- Table 38: Global South and Central America Smart Grid Security Market Volume Million Forecast, by Smart Gas Meter 2020 & 2033
- Table 39: Global South and Central America Smart Grid Security Market Revenue million Forecast, by Smart Water Meter 2020 & 2033
- Table 40: Global South and Central America Smart Grid Security Market Volume Million Forecast, by Smart Water Meter 2020 & 2033
- Table 41: Global South and Central America Smart Grid Security Market Revenue million Forecast, by Smart Electricity Meter 2020 & 2033
- Table 42: Global South and Central America Smart Grid Security Market Volume Million Forecast, by Smart Electricity Meter 2020 & 2033
- Table 43: Global South and Central America Smart Grid Security Market Revenue million Forecast, by Country 2020 & 2033
- Table 44: Global South and Central America Smart Grid Security Market Volume Million Forecast, by Country 2020 & 2033
- Table 45: United Kingdom South and Central America Smart Grid Security Market Revenue (million) Forecast, by Application 2020 & 2033
- Table 46: United Kingdom South and Central America Smart Grid Security Market Volume (Million) Forecast, by Application 2020 & 2033
- Table 47: Germany South and Central America Smart Grid Security Market Revenue (million) Forecast, by Application 2020 & 2033
- Table 48: Germany South and Central America Smart Grid Security Market Volume (Million) Forecast, by Application 2020 & 2033
- Table 49: France South and Central America Smart Grid Security Market Revenue (million) Forecast, by Application 2020 & 2033
- Table 50: France South and Central America Smart Grid Security Market Volume (Million) Forecast, by Application 2020 & 2033
- Table 51: Italy South and Central America Smart Grid Security Market Revenue (million) Forecast, by Application 2020 & 2033
- Table 52: Italy South and Central America Smart Grid Security Market Volume (Million) Forecast, by Application 2020 & 2033
- Table 53: Spain South and Central America Smart Grid Security Market Revenue (million) Forecast, by Application 2020 & 2033
- Table 54: Spain South and Central America Smart Grid Security Market Volume (Million) Forecast, by Application 2020 & 2033
- Table 55: Russia South and Central America Smart Grid Security Market Revenue (million) Forecast, by Application 2020 & 2033
- Table 56: Russia South and Central America Smart Grid Security Market Volume (Million) Forecast, by Application 2020 & 2033
- Table 57: Benelux South and Central America Smart Grid Security Market Revenue (million) Forecast, by Application 2020 & 2033
- Table 58: Benelux South and Central America Smart Grid Security Market Volume (Million) Forecast, by Application 2020 & 2033
- Table 59: Nordics South and Central America Smart Grid Security Market Revenue (million) Forecast, by Application 2020 & 2033
- Table 60: Nordics South and Central America Smart Grid Security Market Volume (Million) Forecast, by Application 2020 & 2033
- Table 61: Rest of Europe South and Central America Smart Grid Security Market Revenue (million) Forecast, by Application 2020 & 2033
- Table 62: Rest of Europe South and Central America Smart Grid Security Market Volume (Million) Forecast, by Application 2020 & 2033
- Table 63: Global South and Central America Smart Grid Security Market Revenue million Forecast, by Smart Gas Meter 2020 & 2033
- Table 64: Global South and Central America Smart Grid Security Market Volume Million Forecast, by Smart Gas Meter 2020 & 2033
- Table 65: Global South and Central America Smart Grid Security Market Revenue million Forecast, by Smart Water Meter 2020 & 2033
- Table 66: Global South and Central America Smart Grid Security Market Volume Million Forecast, by Smart Water Meter 2020 & 2033
- Table 67: Global South and Central America Smart Grid Security Market Revenue million Forecast, by Smart Electricity Meter 2020 & 2033
- Table 68: Global South and Central America Smart Grid Security Market Volume Million Forecast, by Smart Electricity Meter 2020 & 2033
- Table 69: Global South and Central America Smart Grid Security Market Revenue million Forecast, by Country 2020 & 2033
- Table 70: Global South and Central America Smart Grid Security Market Volume Million Forecast, by Country 2020 & 2033
- Table 71: Turkey South and Central America Smart Grid Security Market Revenue (million) Forecast, by Application 2020 & 2033
- Table 72: Turkey South and Central America Smart Grid Security Market Volume (Million) Forecast, by Application 2020 & 2033
- Table 73: Israel South and Central America Smart Grid Security Market Revenue (million) Forecast, by Application 2020 & 2033
- Table 74: Israel South and Central America Smart Grid Security Market Volume (Million) Forecast, by Application 2020 & 2033
- Table 75: GCC South and Central America Smart Grid Security Market Revenue (million) Forecast, by Application 2020 & 2033
- Table 76: GCC South and Central America Smart Grid Security Market Volume (Million) Forecast, by Application 2020 & 2033
- Table 77: North Africa South and Central America Smart Grid Security Market Revenue (million) Forecast, by Application 2020 & 2033
- Table 78: North Africa South and Central America Smart Grid Security Market Volume (Million) Forecast, by Application 2020 & 2033
- Table 79: South Africa South and Central America Smart Grid Security Market Revenue (million) Forecast, by Application 2020 & 2033
- Table 80: South Africa South and Central America Smart Grid Security Market Volume (Million) Forecast, by Application 2020 & 2033
- Table 81: Rest of Middle East & Africa South and Central America Smart Grid Security Market Revenue (million) Forecast, by Application 2020 & 2033
- Table 82: Rest of Middle East & Africa South and Central America Smart Grid Security Market Volume (Million) Forecast, by Application 2020 & 2033
- Table 83: Global South and Central America Smart Grid Security Market Revenue million Forecast, by Smart Gas Meter 2020 & 2033
- Table 84: Global South and Central America Smart Grid Security Market Volume Million Forecast, by Smart Gas Meter 2020 & 2033
- Table 85: Global South and Central America Smart Grid Security Market Revenue million Forecast, by Smart Water Meter 2020 & 2033
- Table 86: Global South and Central America Smart Grid Security Market Volume Million Forecast, by Smart Water Meter 2020 & 2033
- Table 87: Global South and Central America Smart Grid Security Market Revenue million Forecast, by Smart Electricity Meter 2020 & 2033
- Table 88: Global South and Central America Smart Grid Security Market Volume Million Forecast, by Smart Electricity Meter 2020 & 2033
- Table 89: Global South and Central America Smart Grid Security Market Revenue million Forecast, by Country 2020 & 2033
- Table 90: Global South and Central America Smart Grid Security Market Volume Million Forecast, by Country 2020 & 2033
- Table 91: China South and Central America Smart Grid Security Market Revenue (million) Forecast, by Application 2020 & 2033
- Table 92: China South and Central America Smart Grid Security Market Volume (Million) Forecast, by Application 2020 & 2033
- Table 93: India South and Central America Smart Grid Security Market Revenue (million) Forecast, by Application 2020 & 2033
- Table 94: India South and Central America Smart Grid Security Market Volume (Million) Forecast, by Application 2020 & 2033
- Table 95: Japan South and Central America Smart Grid Security Market Revenue (million) Forecast, by Application 2020 & 2033
- Table 96: Japan South and Central America Smart Grid Security Market Volume (Million) Forecast, by Application 2020 & 2033
- Table 97: South Korea South and Central America Smart Grid Security Market Revenue (million) Forecast, by Application 2020 & 2033
- Table 98: South Korea South and Central America Smart Grid Security Market Volume (Million) Forecast, by Application 2020 & 2033
- Table 99: ASEAN South and Central America Smart Grid Security Market Revenue (million) Forecast, by Application 2020 & 2033
- Table 100: ASEAN South and Central America Smart Grid Security Market Volume (Million) Forecast, by Application 2020 & 2033
- Table 101: Oceania South and Central America Smart Grid Security Market Revenue (million) Forecast, by Application 2020 & 2033
- Table 102: Oceania South and Central America Smart Grid Security Market Volume (Million) Forecast, by Application 2020 & 2033
- Table 103: Rest of Asia Pacific South and Central America Smart Grid Security Market Revenue (million) Forecast, by Application 2020 & 2033
- Table 104: Rest of Asia Pacific South and Central America Smart Grid Security Market Volume (Million) Forecast, by Application 2020 & 2033
Frequently Asked Questions
1. What is the projected Compound Annual Growth Rate (CAGR) of the South and Central America Smart Grid Security Market?
The projected CAGR is approximately 10.35%.
2. Which companies are prominent players in the South and Central America Smart Grid Security Market?
Key companies in the market include Itron Inc, Sagemcom USA Inc, Echelon Corporation, Landis+Gyr Group AG, Elster Group GmbH (Honeywell), Arad Group, Diehl Stiftung & Co KG, General Electric Compan, Kamstrup AS, Zenner International GmbH & Co KG, Sensus USA Inc, Wasion Group Holdings.
3. What are the main segments of the South and Central America Smart Grid Security Market?
The market segments include Smart Gas Meter, Smart Water Meter, Smart Electricity Meter.
4. Can you provide details about the market size?
The market size is estimated to be USD 667.75 million as of 2022.
5. What are some drivers contributing to market growth?
Increased Investments in Smart Grid Projects; Need for Improvement in Utility Usage and Efficiency; Supportive Government Regulations; Growth in Smart City Deployment; Demand for Sustainable Utility Supply to All End Users.
6. What are the notable trends driving market growth?
Need for Improvement in Utility Efficiency to Drive the Market.
7. Are there any restraints impacting market growth?
High Costs and Security Concerns; Integration Difficulties with Smart Meters; Lack of Capital Investment for Infrastructure Installation and Lack of ROI; Utility Supplier Switching Costs.
8. Can you provide examples of recent developments in the market?
June 2020- Itron Inc. announced partnership with Accell, as Itron's regional partner and lead distributor for the Latin America region. As part of the agreement, Accell will manufacture devices sold in Latin America and provide services and support for those products. By partnering with Accell in Latin America, Itron furthers its strategy to enhance flexibility to capitalize on other opportunities. Accell is better situated to serve customers, partners and deliver new levels of success in the region.
9. What pricing options are available for accessing the report?
Pricing options include single-user, multi-user, and enterprise licenses priced at USD 3800, USD 4500, and USD 5800 respectively.
10. Is the market size provided in terms of value or volume?
The market size is provided in terms of value, measured in million and volume, measured in Million.
11. Are there any specific market keywords associated with the report?
Yes, the market keyword associated with the report is "South and Central America Smart Grid Security Market," which aids in identifying and referencing the specific market segment covered.
12. How do I determine which pricing option suits my needs best?
The pricing options vary based on user requirements and access needs. Individual users may opt for single-user licenses, while businesses requiring broader access may choose multi-user or enterprise licenses for cost-effective access to the report.
13. Are there any additional resources or data provided in the South and Central America Smart Grid Security Market report?
While the report offers comprehensive insights, it's advisable to review the specific contents or supplementary materials provided to ascertain if additional resources or data are available.
14. How can I stay updated on further developments or reports in the South and Central America Smart Grid Security Market?
To stay informed about further developments, trends, and reports in the South and Central America Smart Grid Security Market, consider subscribing to industry newsletters, following relevant companies and organizations, or regularly checking reputable industry news sources and publications.
Methodology
Step 1 - Identification of Relevant Samples Size from Population Database


Step 2 - Approaches for Defining Global Market Size (Value, Volume* & Price*)

Note*: In applicable scenarios
Step 3 - Data Sources
Primary Research
- Web Analytics
- Survey Reports
- Research Institute
- Latest Research Reports
- Opinion Leaders
Secondary Research
- Annual Reports
- White Paper
- Latest Press Release
- Industry Association
- Paid Database
- Investor Presentations

Step 4 - Data Triangulation
Involves using different sources of information in order to increase the validity of a study
These sources are likely to be stakeholders in a program - participants, other researchers, program staff, other community members, and so on.
Then we put all data in single framework & apply various statistical tools to find out the dynamic on the market.
During the analysis stage, feedback from the stakeholder groups would be compared to determine areas of agreement as well as areas of divergence