

Key Insights
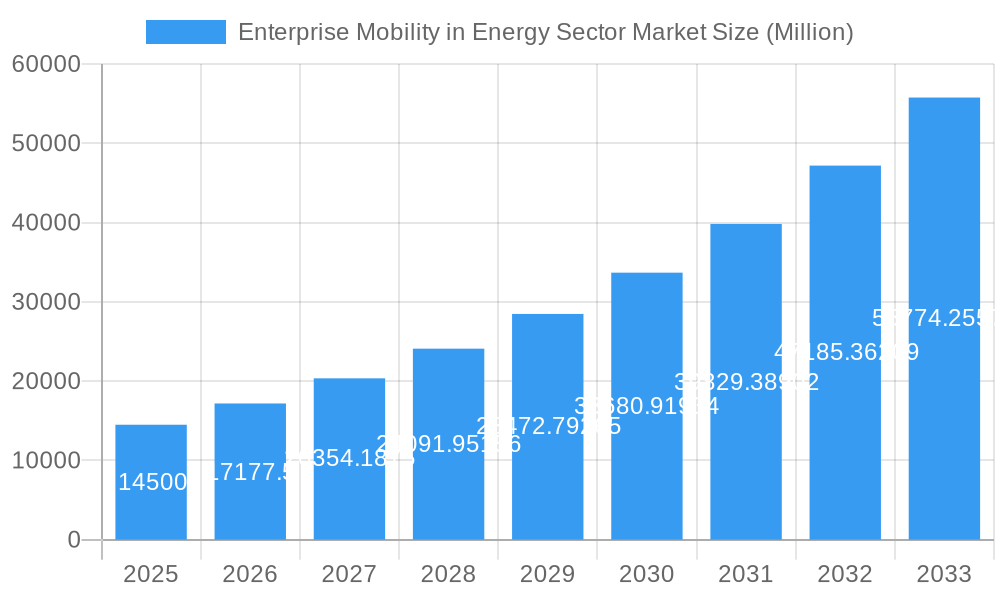
The Enterprise Mobility in the Energy Sector market is set for substantial growth, projected to reach 33990.05 million by 2025, driven by a compelling CAGR of 19.7%. This expansion is propelled by the energy sector's increasing embrace of digital transformation to boost operational efficiency, optimize field services, and ensure real-time data access. Enhanced safety and compliance in hazardous environments, alongside the demand for remote monitoring and control of critical infrastructure, are key growth factors. The integration of IoT, AI, and cloud technologies is further enabling sophisticated mobile solutions for asset management, predictive maintenance, and energy distribution.
Enterprise Mobility in Energy Sector Market Market Size (In Billion)
The market is segmented by device into Smartphones, Laptops, and Tablets, with Smartphones expected to lead due to their portability. Deployment options include On-Premise and Cloud, with Cloud solutions gaining favor for their scalability and cost-effectiveness. Emerging trends like BYOD policies, specialized industrial mobile applications, and enhanced cybersecurity for mobile endpoints are shaping market dynamics. Restraints include high initial infrastructure investment, cybersecurity risks, and the need for comprehensive employee training. Leading companies are investing in R&D for tailored enterprise mobility solutions for the energy sector, with North America and Europe anticipated to be leading adoption regions.
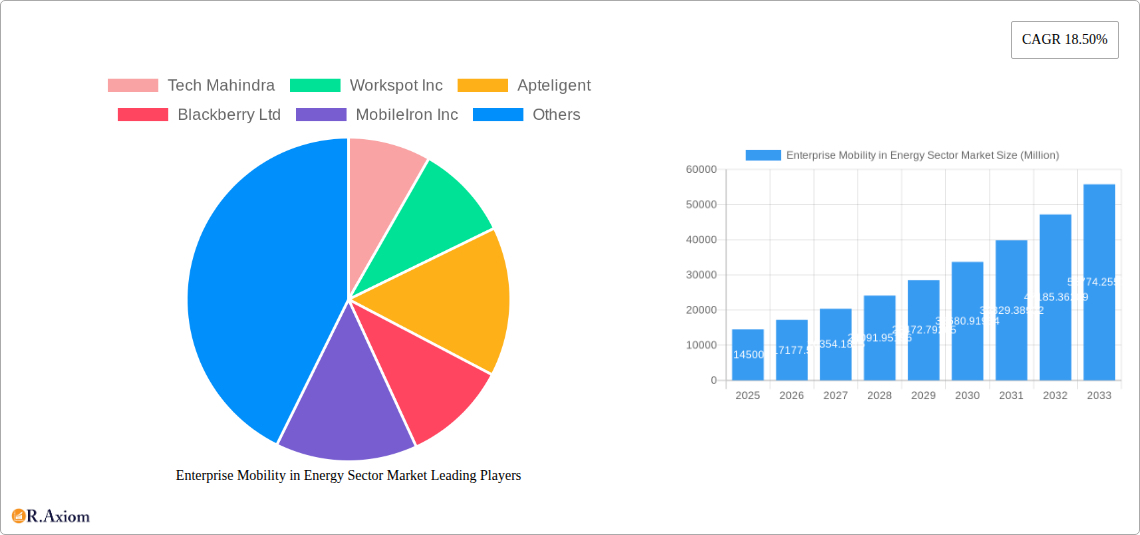
Enterprise Mobility in Energy Sector Market Company Market Share
This report provides a comprehensive analysis of the Enterprise Mobility in the Energy Sector market from 2019 to 2033, with 2025 as the base year. The energy sector's digital transformation necessitates enterprise mobility solutions for improved efficiency, safety, and innovation across all operational stages. This research offers critical insights into market dynamics, growth drivers, emerging opportunities, and the competitive landscape.
Enterprise Mobility in Energy Sector Market Market Concentration & Innovation
The Enterprise Mobility in Energy Sector Market exhibits a moderate to high level of concentration, with a few key players dominating market share. Innovation is primarily driven by advancements in 5G technology, IoT integration for real-time data monitoring, AI-powered analytics for predictive maintenance, and enhanced cybersecurity solutions. Regulatory frameworks, including data privacy laws and industry-specific safety standards, play a significant role in shaping market strategies. Product substitutes, such as legacy systems and manual processes, are gradually being phased out as the benefits of enterprise mobility become more evident. End-user trends point towards a growing demand for ruggedized devices, intuitive user interfaces, and seamless integration with existing IT infrastructure. Merger and acquisition (M&A) activities are expected to continue as larger players seek to expand their technological capabilities and market reach. Notable M&A deal values in the historical period have been in the range of $xx Million to $xx Million, indicating consolidation and strategic growth initiatives.
- Key Innovation Drivers:
- 5G and IoT integration for enhanced connectivity and data collection.
- AI and Machine Learning for predictive analytics and operational optimization.
- Advanced cybersecurity solutions to protect sensitive energy infrastructure data.
- Development of specialized ruggedized mobile devices for harsh environments.
- Regulatory Impact:
- Compliance with data privacy regulations (e.g., GDPR, CCPA).
- Adherence to industry-specific safety and operational standards.
- Government initiatives promoting digital transformation in the energy sector.
- M&A Trends:
- Acquisition of specialized mobility solution providers by larger IT firms.
- Strategic partnerships to co-develop innovative solutions.
- Focus on acquiring companies with strong intellectual property in energy sector mobility.
Enterprise Mobility in Energy Sector Market Industry Trends & Insights
The Enterprise Mobility in Energy Sector Market is poised for substantial growth, driven by an escalating need for operational agility, remote workforce management, and real-time data accessibility within the energy industry. The Compound Annual Growth Rate (CAGR) for the forecast period is projected to be approximately xx%, indicating robust expansion. Market penetration is steadily increasing as energy companies recognize the critical role of mobility in optimizing workflows, enhancing worker safety through real-time alerts and location tracking, and improving asset management. The digital transformation initiatives spurred by volatile energy prices and the imperative for sustainable energy practices are further accelerating the adoption of enterprise mobility solutions. Technological disruptions, including the pervasive adoption of cloud computing, the proliferation of edge computing for localized data processing, and the integration of augmented reality (AR) for field service operations, are reshaping the market landscape. Consumer preferences within the enterprise environment are shifting towards user-friendly, intuitive applications that streamline complex tasks and reduce training overhead. Competitive dynamics are characterized by intense innovation, strategic partnerships, and a focus on providing end-to-end solutions that address the unique challenges of the energy sector, from upstream exploration to downstream distribution. The market is witnessing increased investment in mobile device management (MDM) and mobile application management (MAM) solutions to ensure security and compliance. The demand for mobile solutions that can withstand extreme environmental conditions and provide reliable connectivity in remote locations is a significant trend. Furthermore, the integration of mobility with digital twin technology is emerging as a key differentiator for proactive asset monitoring and maintenance. The development of specialized mobile applications for field data collection, safety inspections, and emergency response is also a prominent trend. The increasing adoption of BYOD (Bring Your Own Device) policies, coupled with robust security measures, is another factor influencing the market. The shift towards renewable energy sources, such as solar and wind, is also creating new demands for mobile solutions to manage distributed assets and optimize energy generation.
Dominant Markets & Segments in Enterprise Mobility in Energy Sector Market
The North America region is currently the dominant market for Enterprise Mobility solutions in the Energy Sector, with the United States leading the charge. This dominance can be attributed to a robust energy infrastructure, significant investments in digital transformation by major oil, gas, and renewable energy companies, and a proactive regulatory environment that encourages technological adoption. Economic policies supporting innovation and infrastructure development further bolster this leadership.
- Dominant Region: North America
- Key Country: United States
- Drivers of Dominance:
- Presence of major global energy corporations with substantial IT budgets.
- Early adoption of advanced technologies like IoT and AI in the energy value chain.
- Favorable government initiatives and research and development funding.
- Extensive existing energy infrastructure requiring advanced management solutions.
- High smartphone and laptop penetration rates across the workforce.
The Cloud deployment model is emerging as the most significant segment, outpacing on-premise solutions. This shift is driven by the inherent scalability, cost-effectiveness, and accessibility offered by cloud platforms. Energy companies are increasingly leveraging cloud-based mobility solutions for their flexibility in managing vast amounts of data generated from remote operations and for facilitating seamless collaboration among distributed teams.
- Dominant Deployment Model: Cloud
- Drivers of Dominance:
- Scalability to handle fluctuating data volumes from energy operations.
- Reduced IT infrastructure costs and maintenance overhead.
- Enhanced accessibility for field personnel from remote locations.
- Faster deployment and updates of mobile applications.
- Improved disaster recovery and business continuity capabilities.
- Drivers of Dominance:
In terms of device segments, Smartphones are leading the adoption due to their ubiquitous nature and the increasing array of specialized ruggedized smartphones designed for harsh industrial environments. However, Laptops remain crucial for more complex data analysis and reporting tasks performed by engineers and management. Tablets are gaining traction for field inspections, data entry, and providing larger interactive displays for technical documentation.
- Dominant Device Segment: Smartphones
- Drivers of Dominance:
- Portability and ease of use for field personnel.
- Availability of specialized ruggedized and intrinsically safe devices.
- Extensive app ecosystem for various energy sector functions.
- Increasing processing power and connectivity options.
- Drivers of Dominance:
Enterprise Mobility in Energy Sector Market Product Developments
Product developments in the Enterprise Mobility in Energy Sector Market are characterized by a focus on enhancing field worker productivity, improving safety protocols, and optimizing asset performance through connected devices and intelligent applications. Innovations include the development of advanced mobile applications for real-time monitoring of critical infrastructure, predictive maintenance alerts, and remote diagnostics. The integration of augmented reality (AR) with mobile devices allows field technicians to overlay digital information onto physical assets, aiding in complex repair and maintenance tasks. Furthermore, the evolution of ruggedized mobile devices with extended battery life, enhanced durability, and superior connectivity in challenging environments is a key trend, ensuring reliable operation in oil rigs, power plants, and remote substations.
Report Scope & Segmentation Analysis
This report meticulously analyzes the Enterprise Mobility in Energy Sector Market across several key segmentations to provide granular insights. The Device segmentation includes Smartphones, Laptops, and Tablets. The Deployment segmentation categorizes solutions into On-Premise and Cloud. Each segment's market size, projected growth, and competitive dynamics have been thoroughly evaluated.
- Device Segmentation:
- Smartphones: Expected to dominate in terms of unit shipments due to their portability and the increasing availability of specialized industrial-grade devices.
- Laptops: Will continue to be essential for complex data analysis, reporting, and back-office operations within energy companies.
- Tablets: Their market share is growing significantly, offering a balance of portability and screen real estate for interactive field applications.
- Deployment Segmentation:
- Cloud: Projected to experience the highest growth rate due to its scalability, cost-effectiveness, and flexibility, becoming the preferred deployment model for most energy enterprises.
- On-Premise: Will continue to be relevant for organizations with strict data security and regulatory compliance requirements that necessitate localized control.
Key Drivers of Enterprise Mobility in Energy Sector Market Growth
The growth of the Enterprise Mobility in Energy Sector Market is propelled by several critical factors. Firstly, the increasing digitalization and automation across the energy value chain necessitate mobile solutions for real-time data access and control. Secondly, the imperative to enhance worker safety in hazardous environments, through features like remote monitoring, emergency alerts, and location tracking, is a significant driver. Thirdly, the need for improved operational efficiency, including streamlined field service operations, optimized asset management, and reduced downtime, is pushing adoption. Finally, government initiatives promoting smart grids, renewable energy integration, and cybersecurity in critical infrastructure further fuel market expansion.
Challenges in the Enterprise Mobility in Energy Sector Market Sector
Despite robust growth prospects, the Enterprise Mobility in Energy Sector Market faces several challenges. Securing sensitive operational data from cyber threats and ensuring compliance with stringent data privacy regulations remain paramount concerns. The high cost of implementing and maintaining advanced mobility solutions, especially in remote and harsh operating conditions, can be a barrier for some organizations. Furthermore, the integration of new mobility platforms with legacy IT systems often proves complex and time-consuming. The availability of a skilled workforce capable of managing and leveraging these advanced technologies also presents a challenge, necessitating continuous training and development initiatives.
Emerging Opportunities in Enterprise Mobility in Energy Sector Market
Emerging opportunities in the Enterprise Mobility in Energy Sector Market are abundant. The rapid expansion of the renewable energy sector (solar, wind, and hydrogen) is creating new demands for mobile solutions to manage distributed assets and optimize generation. The adoption of IoT devices and sensors in the energy infrastructure presents a massive opportunity for mobile platforms to collect and analyze real-time data for predictive maintenance and anomaly detection. Furthermore, the integration of Artificial Intelligence (AI) and Machine Learning (ML) into mobile applications offers enhanced insights for decision-making and operational optimization. The growing trend of remote operations and the need for connected worker solutions in challenging environments also present significant growth avenues.
Leading Players in the Enterprise Mobility in Energy Sector Market Market
- Tech Mahindra
- Workspot Inc
- Apteligent
- Blackberry Ltd
- MobileIron Inc
- TCS Private Limited
- McAfee Inc
- Cisco Systems Inc
- Microsoft Corporation
- Tylr Mobile Inc
- Oracle Corporation
- VMware Inc
- Broadcom Inc (Symantec Corporation)
- Citrix Systems Inc
- SAP SE
Key Developments in Enterprise Mobility in Energy Sector Market Industry
- 2023 November: Microsoft launched enhanced cloud-based security features for enterprise mobile devices, improving data protection for energy companies.
- 2023 September: Cisco Systems Inc. announced expanded IoT integration capabilities for its mobile networking solutions, targeting critical infrastructure in the energy sector.
- 2023 July: VMware Inc. unveiled new solutions for managing and securing mobile applications in hybrid cloud environments, addressing the evolving needs of energy enterprises.
- 2023 May: Oracle Corporation released new updates to its enterprise mobility management suite, focusing on AI-driven analytics for operational efficiency in the energy sector.
- 2023 March: SAP SE introduced advanced analytics dashboards for mobile field service operations, aiming to improve response times and resource allocation in the energy industry.
- 2022 December: Blackberry Ltd. announced a strategic partnership with a major oil and gas company to enhance the security of their mobile operations.
- 2022 October: TCS Private Limited acquired a specialized mobility solutions firm to strengthen its offerings for the energy sector.
- 2022 August: McAfee Inc. released new cybersecurity protocols for mobile devices used in critical energy infrastructure.
- 2022 June: Workspot Inc. launched a new platform for secure cloud-based access to desktop applications for field engineers in the energy sector.
- 2022 April: Tech Mahindra expanded its enterprise mobility services portfolio with a focus on IoT integration for the energy sector.
Strategic Outlook for Enterprise Mobility in Energy Sector Market Market
The strategic outlook for the Enterprise Mobility in Energy Sector Market is overwhelmingly positive, driven by the ongoing digital transformation across the global energy landscape. Key growth catalysts include the increasing demand for real-time data visibility, the imperative for enhanced worker safety, and the pursuit of greater operational efficiency. The continued evolution of technologies like 5G, IoT, and AI will further unlock new possibilities for connected and intelligent mobile solutions. Energy companies that strategically invest in robust enterprise mobility platforms will be well-positioned to navigate market complexities, optimize resource utilization, and achieve sustainable growth in the coming years. The focus will increasingly shift towards integrated, end-to-end mobility solutions that encompass device management, application development, security, and data analytics.
Enterprise Mobility in Energy Sector Market Segmentation
-
1. Device
- 1.1. Smartphones
- 1.2. Laptops
- 1.3. Tablets
-
2. Deployment
- 2.1. On-Premise
- 2.2. Cloud
Enterprise Mobility in Energy Sector Market Segmentation By Geography
- 1. North America
- 2. Europe
- 3. Asia Pacific
- 4. Latin America
- 5. Middle East
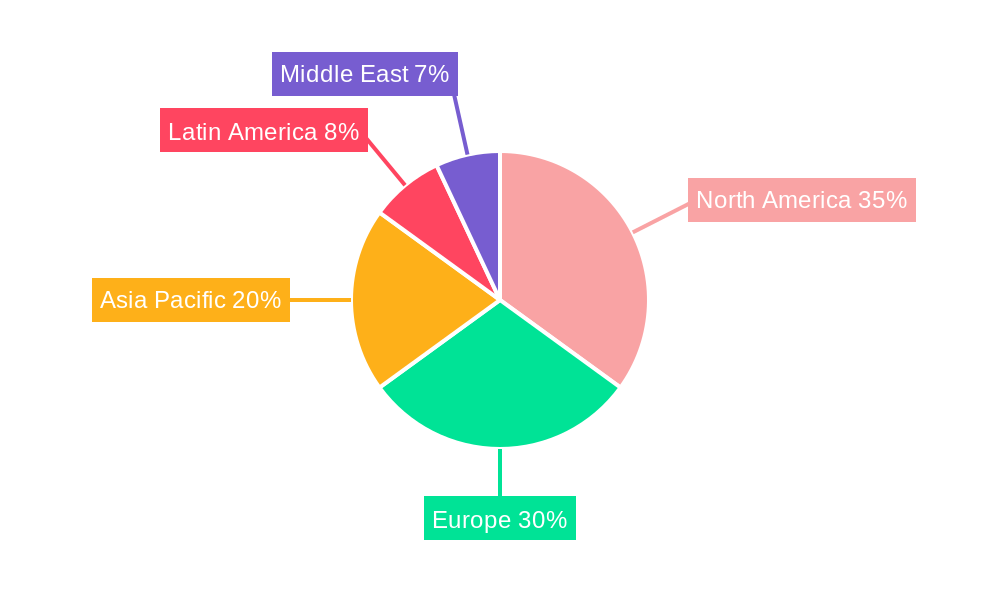
Enterprise Mobility in Energy Sector Market Regional Market Share
Geographic Coverage of Enterprise Mobility in Energy Sector Market
Enterprise Mobility in Energy Sector Market REPORT HIGHLIGHTS
| Aspects | Details |
|---|---|
| Study Period | 2020-2034 |
| Base Year | 2025 |
| Estimated Year | 2026 |
| Forecast Period | 2026-2034 |
| Historical Period | 2020-2025 |
| Growth Rate | CAGR of 19.7% from 2020-2034 |
| Segmentation |
|
Table of Contents
- 1. Introduction
- 1.1. Research Scope
- 1.2. Market Segmentation
- 1.3. Research Objective
- 1.4. Definitions and Assumptions
- 2. Executive Summary
- 2.1. Market Snapshot
- 3. Market Dynamics
- 3.1. Market Drivers
- 3.2. Market Restrains
- 3.3. Market Trends
- 3.4. Market Opportunities
- 4. Market Factor Analysis
- 4.1. Porters Five Forces
- 4.1.1. Bargaining Power of Suppliers
- 4.1.2. Bargaining Power of Buyers
- 4.1.3. Threat of New Entrants
- 4.1.4. Threat of Substitutes
- 4.1.5. Competitive Rivalry
- 4.2. PESTEL analysis
- 4.3. BCG Analysis
- 4.3.1. Stars (High Growth, High Market Share)
- 4.3.2. Cash Cows (Low Growth, High Market Share)
- 4.3.3. Question Mark (High Growth, Low Market Share)
- 4.3.4. Dogs (Low Growth, Low Market Share)
- 4.4. Ansoff Matrix Analysis
- 4.5. Supply Chain Analysis
- 4.6. Regulatory Landscape
- 4.7. Current Market Potential and Opportunity Assessment (TAM–SAM–SOM Framework)
- 4.8. RAX Analyst Note
- 4.1. Porters Five Forces
- 5. Market Analysis, Insights and Forecast 2021-2033
- 5.1. Market Analysis, Insights and Forecast - by Device
- 5.1.1. Smartphones
- 5.1.2. Laptops
- 5.1.3. Tablets
- 5.2. Market Analysis, Insights and Forecast - by Deployment
- 5.2.1. On-Premise
- 5.2.2. Cloud
- 5.3. Market Analysis, Insights and Forecast - by Region
- 5.3.1. North America
- 5.3.2. Europe
- 5.3.3. Asia Pacific
- 5.3.4. Latin America
- 5.3.5. Middle East
- 5.1. Market Analysis, Insights and Forecast - by Device
- 6. Global Enterprise Mobility in Energy Sector Market Analysis, Insights and Forecast, 2021-2033
- 6.1. Market Analysis, Insights and Forecast - by Device
- 6.1.1. Smartphones
- 6.1.2. Laptops
- 6.1.3. Tablets
- 6.2. Market Analysis, Insights and Forecast - by Deployment
- 6.2.1. On-Premise
- 6.2.2. Cloud
- 6.1. Market Analysis, Insights and Forecast - by Device
- 7. North America Enterprise Mobility in Energy Sector Market Analysis, Insights and Forecast, 2020-2032
- 7.1. Market Analysis, Insights and Forecast - by Device
- 7.1.1. Smartphones
- 7.1.2. Laptops
- 7.1.3. Tablets
- 7.2. Market Analysis, Insights and Forecast - by Deployment
- 7.2.1. On-Premise
- 7.2.2. Cloud
- 7.1. Market Analysis, Insights and Forecast - by Device
- 8. Europe Enterprise Mobility in Energy Sector Market Analysis, Insights and Forecast, 2020-2032
- 8.1. Market Analysis, Insights and Forecast - by Device
- 8.1.1. Smartphones
- 8.1.2. Laptops
- 8.1.3. Tablets
- 8.2. Market Analysis, Insights and Forecast - by Deployment
- 8.2.1. On-Premise
- 8.2.2. Cloud
- 8.1. Market Analysis, Insights and Forecast - by Device
- 9. Asia Pacific Enterprise Mobility in Energy Sector Market Analysis, Insights and Forecast, 2020-2032
- 9.1. Market Analysis, Insights and Forecast - by Device
- 9.1.1. Smartphones
- 9.1.2. Laptops
- 9.1.3. Tablets
- 9.2. Market Analysis, Insights and Forecast - by Deployment
- 9.2.1. On-Premise
- 9.2.2. Cloud
- 9.1. Market Analysis, Insights and Forecast - by Device
- 10. Latin America Enterprise Mobility in Energy Sector Market Analysis, Insights and Forecast, 2020-2032
- 10.1. Market Analysis, Insights and Forecast - by Device
- 10.1.1. Smartphones
- 10.1.2. Laptops
- 10.1.3. Tablets
- 10.2. Market Analysis, Insights and Forecast - by Deployment
- 10.2.1. On-Premise
- 10.2.2. Cloud
- 10.1. Market Analysis, Insights and Forecast - by Device
- 11. Middle East Enterprise Mobility in Energy Sector Market Analysis, Insights and Forecast, 2020-2032
- 11.1. Market Analysis, Insights and Forecast - by Device
- 11.1.1. Smartphones
- 11.1.2. Laptops
- 11.1.3. Tablets
- 11.2. Market Analysis, Insights and Forecast - by Deployment
- 11.2.1. On-Premise
- 11.2.2. Cloud
- 11.1. Market Analysis, Insights and Forecast - by Device
- 12. Competitive Analysis
- 12.1. Company Profiles
- 12.1.1 Tech Mahindra
- 12.1.1.1. Company Overview
- 12.1.1.2. Products
- 12.1.1.3. Company Financials
- 12.1.1.4. SWOT Analysis
- 12.1.2 Workspot Inc
- 12.1.2.1. Company Overview
- 12.1.2.2. Products
- 12.1.2.3. Company Financials
- 12.1.2.4. SWOT Analysis
- 12.1.3 Apteligent
- 12.1.3.1. Company Overview
- 12.1.3.2. Products
- 12.1.3.3. Company Financials
- 12.1.3.4. SWOT Analysis
- 12.1.4 Blackberry Ltd
- 12.1.4.1. Company Overview
- 12.1.4.2. Products
- 12.1.4.3. Company Financials
- 12.1.4.4. SWOT Analysis
- 12.1.5 MobileIron Inc
- 12.1.5.1. Company Overview
- 12.1.5.2. Products
- 12.1.5.3. Company Financials
- 12.1.5.4. SWOT Analysis
- 12.1.6 TCS Private Limited
- 12.1.6.1. Company Overview
- 12.1.6.2. Products
- 12.1.6.3. Company Financials
- 12.1.6.4. SWOT Analysis
- 12.1.7 McAfee Inc
- 12.1.7.1. Company Overview
- 12.1.7.2. Products
- 12.1.7.3. Company Financials
- 12.1.7.4. SWOT Analysis
- 12.1.8 Cisco Systems Inc
- 12.1.8.1. Company Overview
- 12.1.8.2. Products
- 12.1.8.3. Company Financials
- 12.1.8.4. SWOT Analysis
- 12.1.9 Microsoft Corporation
- 12.1.9.1. Company Overview
- 12.1.9.2. Products
- 12.1.9.3. Company Financials
- 12.1.9.4. SWOT Analysis
- 12.1.10 Tylr Mobile Inc
- 12.1.10.1. Company Overview
- 12.1.10.2. Products
- 12.1.10.3. Company Financials
- 12.1.10.4. SWOT Analysis
- 12.1.11 Oracle Corporation
- 12.1.11.1. Company Overview
- 12.1.11.2. Products
- 12.1.11.3. Company Financials
- 12.1.11.4. SWOT Analysis
- 12.1.12 VMware Inc
- 12.1.12.1. Company Overview
- 12.1.12.2. Products
- 12.1.12.3. Company Financials
- 12.1.12.4. SWOT Analysis
- 12.1.13 Broadcom Inc (Symantec Corporation)
- 12.1.13.1. Company Overview
- 12.1.13.2. Products
- 12.1.13.3. Company Financials
- 12.1.13.4. SWOT Analysis
- 12.1.14 Citrix Systems Inc
- 12.1.14.1. Company Overview
- 12.1.14.2. Products
- 12.1.14.3. Company Financials
- 12.1.14.4. SWOT Analysis
- 12.1.15 SAP SE
- 12.1.15.1. Company Overview
- 12.1.15.2. Products
- 12.1.15.3. Company Financials
- 12.1.15.4. SWOT Analysis
- 12.1.1 Tech Mahindra
- 12.2. Market Entropy
- 12.2.1 Company's Key Areas Served
- 12.2.2 Recent Developments
- 12.3. Company Market Share Analysis 2025
- 12.3.1 Top 5 Companies Market Share Analysis
- 12.3.2 Top 3 Companies Market Share Analysis
- 12.4. List of Potential Customers
- 13. Research Methodology
List of Figures
- Figure 1: Global Enterprise Mobility in Energy Sector Market Revenue Breakdown (million, %) by Region 2025 & 2033
- Figure 2: North America Enterprise Mobility in Energy Sector Market Revenue (million), by Device 2025 & 2033
- Figure 3: North America Enterprise Mobility in Energy Sector Market Revenue Share (%), by Device 2025 & 2033
- Figure 4: North America Enterprise Mobility in Energy Sector Market Revenue (million), by Deployment 2025 & 2033
- Figure 5: North America Enterprise Mobility in Energy Sector Market Revenue Share (%), by Deployment 2025 & 2033
- Figure 6: North America Enterprise Mobility in Energy Sector Market Revenue (million), by Country 2025 & 2033
- Figure 7: North America Enterprise Mobility in Energy Sector Market Revenue Share (%), by Country 2025 & 2033
- Figure 8: Europe Enterprise Mobility in Energy Sector Market Revenue (million), by Device 2025 & 2033
- Figure 9: Europe Enterprise Mobility in Energy Sector Market Revenue Share (%), by Device 2025 & 2033
- Figure 10: Europe Enterprise Mobility in Energy Sector Market Revenue (million), by Deployment 2025 & 2033
- Figure 11: Europe Enterprise Mobility in Energy Sector Market Revenue Share (%), by Deployment 2025 & 2033
- Figure 12: Europe Enterprise Mobility in Energy Sector Market Revenue (million), by Country 2025 & 2033
- Figure 13: Europe Enterprise Mobility in Energy Sector Market Revenue Share (%), by Country 2025 & 2033
- Figure 14: Asia Pacific Enterprise Mobility in Energy Sector Market Revenue (million), by Device 2025 & 2033
- Figure 15: Asia Pacific Enterprise Mobility in Energy Sector Market Revenue Share (%), by Device 2025 & 2033
- Figure 16: Asia Pacific Enterprise Mobility in Energy Sector Market Revenue (million), by Deployment 2025 & 2033
- Figure 17: Asia Pacific Enterprise Mobility in Energy Sector Market Revenue Share (%), by Deployment 2025 & 2033
- Figure 18: Asia Pacific Enterprise Mobility in Energy Sector Market Revenue (million), by Country 2025 & 2033
- Figure 19: Asia Pacific Enterprise Mobility in Energy Sector Market Revenue Share (%), by Country 2025 & 2033
- Figure 20: Latin America Enterprise Mobility in Energy Sector Market Revenue (million), by Device 2025 & 2033
- Figure 21: Latin America Enterprise Mobility in Energy Sector Market Revenue Share (%), by Device 2025 & 2033
- Figure 22: Latin America Enterprise Mobility in Energy Sector Market Revenue (million), by Deployment 2025 & 2033
- Figure 23: Latin America Enterprise Mobility in Energy Sector Market Revenue Share (%), by Deployment 2025 & 2033
- Figure 24: Latin America Enterprise Mobility in Energy Sector Market Revenue (million), by Country 2025 & 2033
- Figure 25: Latin America Enterprise Mobility in Energy Sector Market Revenue Share (%), by Country 2025 & 2033
- Figure 26: Middle East Enterprise Mobility in Energy Sector Market Revenue (million), by Device 2025 & 2033
- Figure 27: Middle East Enterprise Mobility in Energy Sector Market Revenue Share (%), by Device 2025 & 2033
- Figure 28: Middle East Enterprise Mobility in Energy Sector Market Revenue (million), by Deployment 2025 & 2033
- Figure 29: Middle East Enterprise Mobility in Energy Sector Market Revenue Share (%), by Deployment 2025 & 2033
- Figure 30: Middle East Enterprise Mobility in Energy Sector Market Revenue (million), by Country 2025 & 2033
- Figure 31: Middle East Enterprise Mobility in Energy Sector Market Revenue Share (%), by Country 2025 & 2033
List of Tables
- Table 1: Global Enterprise Mobility in Energy Sector Market Revenue million Forecast, by Device 2020 & 2033
- Table 2: Global Enterprise Mobility in Energy Sector Market Revenue million Forecast, by Deployment 2020 & 2033
- Table 3: Global Enterprise Mobility in Energy Sector Market Revenue million Forecast, by Region 2020 & 2033
- Table 4: Global Enterprise Mobility in Energy Sector Market Revenue million Forecast, by Device 2020 & 2033
- Table 5: Global Enterprise Mobility in Energy Sector Market Revenue million Forecast, by Deployment 2020 & 2033
- Table 6: Global Enterprise Mobility in Energy Sector Market Revenue million Forecast, by Country 2020 & 2033
- Table 7: Global Enterprise Mobility in Energy Sector Market Revenue million Forecast, by Device 2020 & 2033
- Table 8: Global Enterprise Mobility in Energy Sector Market Revenue million Forecast, by Deployment 2020 & 2033
- Table 9: Global Enterprise Mobility in Energy Sector Market Revenue million Forecast, by Country 2020 & 2033
- Table 10: Global Enterprise Mobility in Energy Sector Market Revenue million Forecast, by Device 2020 & 2033
- Table 11: Global Enterprise Mobility in Energy Sector Market Revenue million Forecast, by Deployment 2020 & 2033
- Table 12: Global Enterprise Mobility in Energy Sector Market Revenue million Forecast, by Country 2020 & 2033
- Table 13: Global Enterprise Mobility in Energy Sector Market Revenue million Forecast, by Device 2020 & 2033
- Table 14: Global Enterprise Mobility in Energy Sector Market Revenue million Forecast, by Deployment 2020 & 2033
- Table 15: Global Enterprise Mobility in Energy Sector Market Revenue million Forecast, by Country 2020 & 2033
- Table 16: Global Enterprise Mobility in Energy Sector Market Revenue million Forecast, by Device 2020 & 2033
- Table 17: Global Enterprise Mobility in Energy Sector Market Revenue million Forecast, by Deployment 2020 & 2033
- Table 18: Global Enterprise Mobility in Energy Sector Market Revenue million Forecast, by Country 2020 & 2033
Frequently Asked Questions
1. What is the projected Compound Annual Growth Rate (CAGR) of the Enterprise Mobility in Energy Sector Market?
The projected CAGR is approximately 19.7%.
2. Which companies are prominent players in the Enterprise Mobility in Energy Sector Market?
Key companies in the market include Tech Mahindra, Workspot Inc, Apteligent, Blackberry Ltd, MobileIron Inc, TCS Private Limited, McAfee Inc, Cisco Systems Inc, Microsoft Corporation, Tylr Mobile Inc, Oracle Corporation, VMware Inc, Broadcom Inc (Symantec Corporation), Citrix Systems Inc, SAP SE.
3. What are the main segments of the Enterprise Mobility in Energy Sector Market?
The market segments include Device, Deployment.
4. Can you provide details about the market size?
The market size is estimated to be USD 33990.05 million as of 2022.
5. What are some drivers contributing to market growth?
; Advancements in Energy Revolution is the Major Driving Factor.
6. What are the notable trends driving market growth?
Smartphones to Dominate the Market.
7. Are there any restraints impacting market growth?
; Security Vulnerability is the Major Discouraging Factor.
8. Can you provide examples of recent developments in the market?
N/A
9. What pricing options are available for accessing the report?
Pricing options include single-user, multi-user, and enterprise licenses priced at USD 4750, USD 5250, and USD 8750 respectively.
10. Is the market size provided in terms of value or volume?
The market size is provided in terms of value, measured in million.
11. Are there any specific market keywords associated with the report?
Yes, the market keyword associated with the report is "Enterprise Mobility in Energy Sector Market," which aids in identifying and referencing the specific market segment covered.
12. How do I determine which pricing option suits my needs best?
The pricing options vary based on user requirements and access needs. Individual users may opt for single-user licenses, while businesses requiring broader access may choose multi-user or enterprise licenses for cost-effective access to the report.
13. Are there any additional resources or data provided in the Enterprise Mobility in Energy Sector Market report?
While the report offers comprehensive insights, it's advisable to review the specific contents or supplementary materials provided to ascertain if additional resources or data are available.
14. How can I stay updated on further developments or reports in the Enterprise Mobility in Energy Sector Market?
To stay informed about further developments, trends, and reports in the Enterprise Mobility in Energy Sector Market, consider subscribing to industry newsletters, following relevant companies and organizations, or regularly checking reputable industry news sources and publications.
Methodology
Step 1 - Identification of Relevant Samples Size from Population Database


Step 2 - Approaches for Defining Global Market Size (Value, Volume* & Price*)

Note*: In applicable scenarios
Step 3 - Data Sources
Primary Research
- Web Analytics
- Survey Reports
- Research Institute
- Latest Research Reports
- Opinion Leaders
Secondary Research
- Annual Reports
- White Paper
- Latest Press Release
- Industry Association
- Paid Database
- Investor Presentations

Step 4 - Data Triangulation
Involves using different sources of information in order to increase the validity of a study
These sources are likely to be stakeholders in a program - participants, other researchers, program staff, other community members, and so on.
Then we put all data in single framework & apply various statistical tools to find out the dynamic on the market.
During the analysis stage, feedback from the stakeholder groups would be compared to determine areas of agreement as well as areas of divergence