
Key Insights
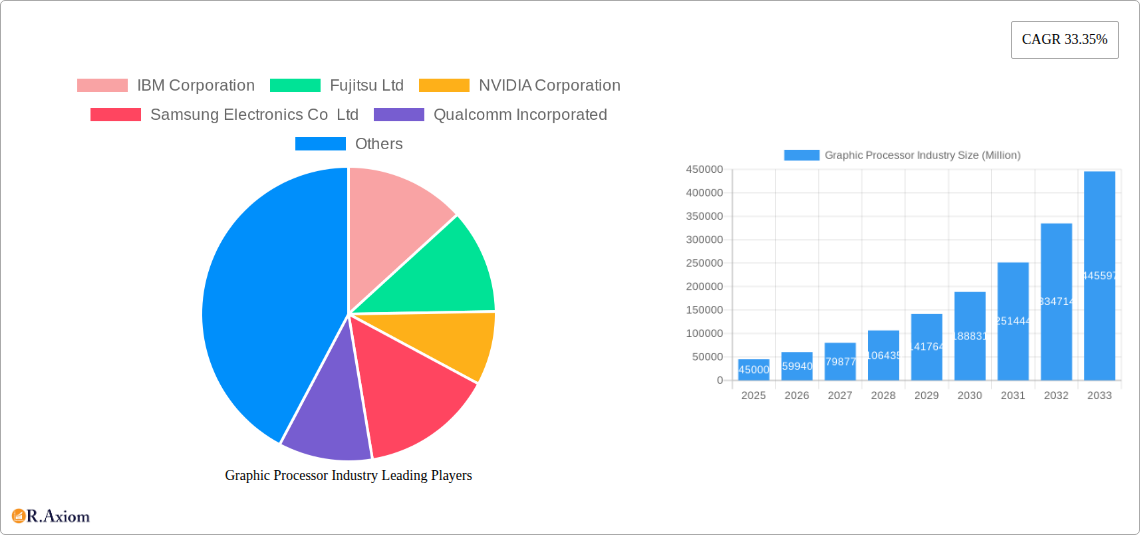
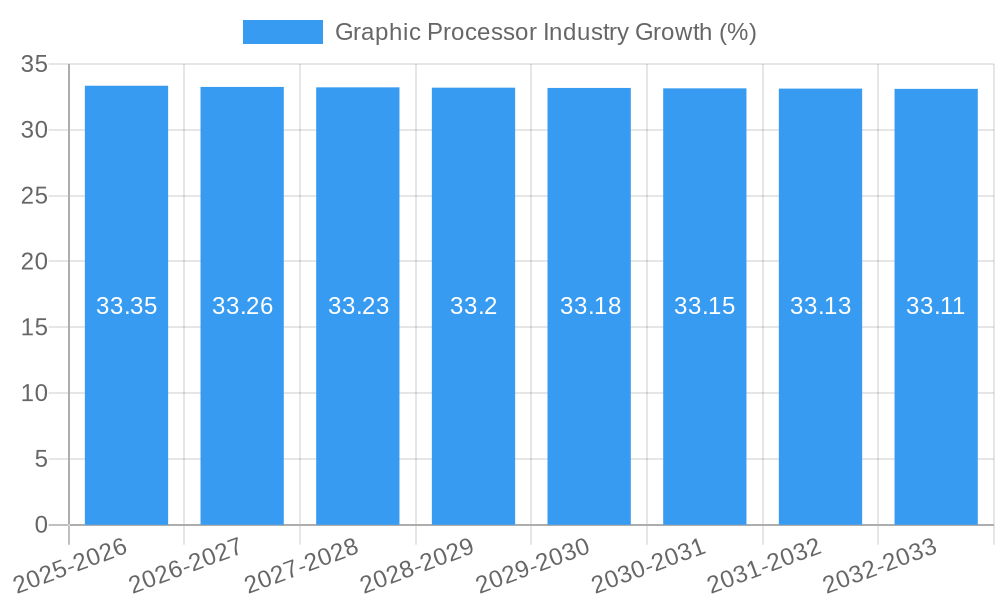
The global Graphic Processor (GPU) market is poised for explosive growth, projected to reach a significant market size with a compound annual growth rate (CAGR) of 33.35% from 2025 to 2033. This robust expansion is primarily fueled by the escalating demand across a diverse range of applications, from smartphones and tablets to high-performance workstations, immersive gaming PCs, and the rapidly evolving automotive sector. The increasing integration of sophisticated graphics capabilities into everyday devices, coupled with the burgeoning media and entertainment industry's reliance on advanced visual rendering, are key drivers. Furthermore, the persistent advancements in AI and machine learning, which heavily leverage GPU power for parallel processing, are creating unprecedented opportunities. The market is also experiencing a strong shift towards cloud-based deployments, offering scalable and accessible graphical power, which further stimulates growth.
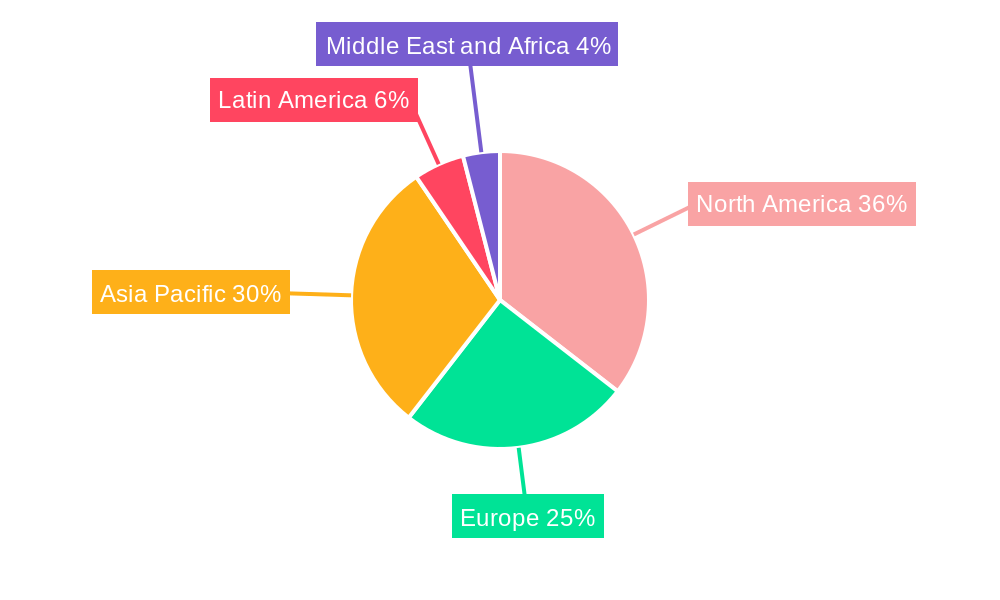
The competitive landscape is characterized by the dominance of established players such as NVIDIA, AMD, Intel, and Qualcomm, alongside the strategic contributions of silicon manufacturing giants like TSMC. Innovation in dedicated graphics cards continues to drive the high-end market, while integrated graphics solutions are becoming increasingly powerful and prevalent in mobile and mainstream computing. Hybrid solutions are emerging as a way to optimize performance and power efficiency. Geographically, North America and Asia Pacific are anticipated to be the leading regions, driven by strong technological adoption, significant investments in R&D, and a large consumer base. However, Europe and other emerging markets are also demonstrating substantial growth potential as digital transformation accelerates across industries. Potential restraints include the high cost of advanced GPU development and manufacturing, alongside ongoing supply chain challenges that could impact availability and pricing, though the overwhelming demand is expected to mitigate these challenges over the forecast period.
Report Description: Global Graphic Processor Industry Market Analysis and Forecast (2019-2033)
Unlock unparalleled insights into the rapidly evolving Graphic Processor Industry with our comprehensive market research report. This in-depth analysis covers the global market from 2019 to 2033, with a base year of 2025 and a detailed forecast period of 2025–2033. We provide granular data on market concentration, innovation drivers, industry trends, dominant segments, product developments, key growth drivers, challenges, emerging opportunities, leading players, and recent key developments. This report is an essential resource for stakeholders seeking to understand market dynamics, competitive landscapes, and future growth trajectories for graphic processing units (GPUs).
Graphic Processor Industry Market Concentration & Innovation
The Graphic Processor Industry exhibits a moderate to high level of market concentration, driven by significant R&D investments and the capital-intensive nature of semiconductor manufacturing. Leading players like NVIDIA Corporation, Advanced Micro Devices Inc., and Intel Corporation dominate market share, accounting for an estimated 70% of the global GPU market value, projected to be over 100 Million. Innovation is primarily fueled by the relentless demand for enhanced visual fidelity in gaming, the proliferation of AI and machine learning applications, and the increasing computational needs of professional workstations and data centers. Regulatory frameworks, such as those concerning semiconductor supply chain resilience and intellectual property rights, play a crucial role in shaping market entry and competitive strategies. Product substitutes, while evolving, are largely confined to integrated graphics solutions for lower-end applications, failing to match the performance of dedicated GPUs. End-user trends lean towards higher performance, greater energy efficiency, and specialized GPU architectures for specific workloads. Mergers and acquisitions (M&A) activities, while less frequent in recent years due to antitrust scrutiny, remain a strategic avenue for consolidation and technology acquisition. Past M&A deals in the semiconductor industry have often exceeded several Million, indicating the substantial value placed on advanced GPU technologies.
Graphic Processor Industry Industry Trends & Insights
The Graphic Processor Industry is experiencing robust growth, propelled by a confluence of technological advancements and expanding application horizons. The overall market is poised for significant expansion, with a projected Compound Annual Growth Rate (CAGR) of approximately 18% from 2025 to 2033. This growth is underpinned by the increasing integration of advanced graphics capabilities across a wide spectrum of devices and industries. The burgeoning demand for immersive gaming experiences, fueled by advancements in virtual reality (VR) and augmented reality (AR) technologies, is a primary market penetration driver, expected to reach over 60% penetration in the gaming PC segment by 2030. Furthermore, the rapid adoption of artificial intelligence (AI) and machine learning (ML) workloads, particularly in data centers and cloud computing environments, necessitates high-performance GPUs for accelerated parallel processing. The automotive sector's increasing reliance on sophisticated in-car infotainment systems and advanced driver-assistance systems (ADAS) is another significant growth catalyst. The mobile segment, comprising smartphones and tablets, continues to evolve with embedded GPUs capable of supporting console-quality graphics and AI-driven features. Technological disruptions, such as the shift towards chiplet architectures and the development of specialized AI accelerators, are redefining product roadmaps and competitive advantages. Consumer preferences are increasingly gravitating towards GPUs offering superior performance-per-watt, real-time ray tracing capabilities, and efficient memory bandwidth, driven by the pursuit of realistic visual experiences and faster processing times. The competitive dynamics are characterized by intense innovation cycles and strategic alliances among key industry players, aiming to capture market share in high-growth segments.
Dominant Markets & Segments in Graphic Processor Industry
The Graphic Processor Industry's dominance is multifaceted, with distinct segments and regions spearheading growth. The Dedicated Graphics Card segment stands out as a primary revenue generator, primarily driven by the insatiable demand from the gaming PC market and professional workstations for high-fidelity graphics and computational power. The projected market size for dedicated graphics cards is estimated to reach over 80 Million by 2025. North America, particularly the United States, is a dominant region, owing to a strong presence of gaming enthusiasts, significant investments in AI research and development, and the concentration of major technology companies.
- Gaming PC: This segment exhibits the highest market penetration and demand for top-tier dedicated graphics cards. The increasing popularity of e-sports and high-definition content consumption further fuels this demand. Key drivers include rising disposable incomes, the availability of high-performance gaming hardware, and continuous software innovation that leverages GPU capabilities.
- Workstations: Professional applications in fields like computer-aided design (CAD), video editing, scientific simulation, and animation rely heavily on powerful GPUs. The growth in these professional sectors, coupled with the need for faster rendering and complex data processing, solidifies this segment's importance. Economic policies that encourage R&D and technological adoption in these industries are crucial.
- Smartphones, Tablets and Notebooks: While often featuring integrated graphics solutions, the premium tiers of these devices are increasingly incorporating more powerful GPUs to support mobile gaming, AR/VR experiences, and AI-powered features. The sheer volume of devices in this segment makes it a significant contributor to overall GPU market share.
- Cloud Deployment: The shift towards cloud computing has created a substantial demand for GPUs in data centers, powering cloud gaming services, AI training and inference, and high-performance computing (HPC) tasks. This segment is experiencing exponential growth, driven by the scalability and accessibility offered by cloud infrastructure. Government initiatives promoting digital transformation and cloud adoption are key drivers.
- Automotives: The automotive industry is emerging as a critical growth area, with GPUs being deployed for advanced infotainment systems, digital cockpits, and autonomous driving technologies. The increasing complexity of vehicle electronics and the drive towards smarter, more connected vehicles are accelerating GPU adoption.
The dominance of these segments is further amplified by ongoing technological innovation and strategic investments by leading companies.
Graphic Processor Industry Product Developments
Recent product developments highlight a trajectory towards increased performance, enhanced power efficiency, and specialized architectures. Samsung Electronics' launch of the first 16-gigabit (Gb) GDDR6 DRAM with 24 gigabits per second (Gbps) speeds, leveraging EUV and advanced process technology, signifies a leap in memory bandwidth crucial for next-generation GPUs. Qualcomm's Snapdragon 8 Gen 2 premium mobile platform, featuring real-time hardware-accelerated ray tracing and an improved Adreno GPU, showcases advancements in mobile gaming graphics and AI capabilities, offering up to 25% faster performance and 40% greater power efficiency. These innovations underscore the industry's commitment to delivering superior visual experiences and accelerating computationally intensive tasks across diverse applications, from gaming to AI and HPC.
Report Scope & Segmentation Analysis
This report offers a comprehensive analysis of the Graphic Processor Industry, segmented across key categories. The Type segmentation includes Dedicated Graphics Card, Integrated Graphics Solutions, and Hybrid Solutions, each catering to different performance requirements and price points. In terms of Deployment, we analyze both On-premise solutions, prevalent in enterprise and high-performance computing environments, and Cloud-based deployments, which are rapidly growing to support scalable, on-demand GPU resources. The Applications segmentation is extensive, covering Smartphones, Tablets and Notebooks, Workstations, Gaming PC, Media and Entertainment, and Automotives, illustrating the diverse end-use markets for graphic processors. Growth projections for these segments indicate strong expansion, with market sizes varying significantly based on adoption rates and technological evolution. For instance, the cloud deployment segment is expected to witness the highest CAGR, driven by the increasing demand for AI and HPC workloads.
Key Drivers of Graphic Processor Industry Growth
Several key drivers are propelling the Graphic Processor Industry forward. The escalating demand for high-fidelity gaming experiences and the rise of virtual and augmented reality technologies necessitate increasingly powerful GPUs. The pervasive integration of AI and machine learning across various sectors, from data analytics to autonomous systems, is a significant growth catalyst, as GPUs are essential for accelerating these computationally intensive workloads. Furthermore, the automotive industry's rapid adoption of advanced driver-assistance systems (ADAS) and sophisticated in-car infotainment systems is creating a substantial new market for GPUs. Advancements in semiconductor manufacturing processes, leading to more powerful and energy-efficient chips, also contribute to market expansion. Finally, increasing consumer spending on personal computing devices and the continuous need for graphical enhancements in professional applications further bolster growth.
Challenges in the Graphic Processor Industry Sector
Despite robust growth, the Graphic Processor Industry faces several significant challenges. Supply chain disruptions, exacerbated by geopolitical factors and the complex global manufacturing network for semiconductors, can lead to production delays and increased costs. The high cost of research and development and manufacturing complex GPUs presents a considerable barrier to entry for new players, contributing to market concentration. Intense competition among established players drives rapid innovation cycles but also puts pressure on profit margins. Regulatory hurdles, particularly concerning mergers and acquisitions and intellectual property protection, can influence strategic decisions. Furthermore, the ongoing semiconductor shortage, though showing signs of easing, has historically impacted production volumes and pricing, posing a persistent concern for market stability.
Emerging Opportunities in Graphic Processor Industry
The Graphic Processor Industry is ripe with emerging opportunities. The burgeoning metaverse and Web3 ecosystems present a significant opportunity for GPUs, requiring advanced rendering and processing capabilities for immersive virtual experiences. The continued expansion of AI and machine learning applications, especially in edge computing and specialized AI accelerators, will drive demand for tailored GPU solutions. The automotive sector's transformation towards autonomous driving and sophisticated in-car digital experiences represents a rapidly growing market segment. Furthermore, advancements in ray tracing technology and the increasing adoption of real-time rendering across industries beyond gaming, such as architecture and product design, offer new avenues for growth. The development of more energy-efficient GPUs and solutions for sustainable computing also presents a key opportunity as environmental concerns become more prominent.
Leading Players in the Graphic Processor Industry Market
- IBM Corporation
- Fujitsu Ltd
- NVIDIA Corporation
- Samsung Electronics Co Ltd
- Qualcomm Incorporated
- Advanced Micro Devices Inc
- Taiwan Semiconductor Manufacturing Company Ltd
- Intel Corporation
- Sony Corporation
- Apple Inc
Key Developments in Graphic Processor Industry Industry
- July 2022: Samsung Electronics launched the first 16-gigabit (Gb) Graphics Double Data Rate 6 (GDDR6) DRAM with processing speeds of 24 gigabits per second (Gbps). This innovation, utilizing extreme ultraviolet (EUV) technology and Samsung's third-generation 10-nanometer-class (1z) process, significantly enhances graphics performance for next-generation graphics cards, laptops, game consoles, AI applications, and high-performance computing (HPC) systems.
- November 2022: Qualcomm Technologies, Inc. launched the Snapdragon 8 Gen 2 premium mobile platform. This platform features ground-breaking AI capabilities and new Snapdragon Elite Gaming features, including real-time hardware-accelerated ray tracing for realistic lighting, reflections, and illuminations in mobile games. The updated Qualcomm Adreno GPU offers up to 25% faster performance, and the Qualcomm Kryo CPU provides up to 40% greater power efficiency, setting a new benchmark for connected computing.
Strategic Outlook for Graphic Processor Industry Market
The strategic outlook for the Graphic Processor Industry is exceptionally positive, driven by sustained innovation and expanding application frontiers. The ongoing digital transformation across industries, coupled with the increasing demand for immersive digital experiences, ensures a continuous need for advanced graphics processing power. Key growth catalysts include the rapid evolution of AI and machine learning, the expansion of the metaverse and Web3 technologies, and the significant technological advancements within the automotive sector. Investments in advanced manufacturing processes, the development of specialized GPU architectures, and strategic partnerships will be crucial for companies to maintain a competitive edge. The industry is poised for substantial growth, with a focus on delivering higher performance, enhanced energy efficiency, and tailored solutions to meet the diverse and evolving needs of its global customer base.
Graphic Processor Industry Segmentation
-
1. Type
- 1.1. Dedicated Graphics Card
- 1.2. Integrated Graphics Solutions
- 1.3. Hybrid Solutions
-
2. Deployement
- 2.1. On-premise
- 2.2. Cloud
-
3. Applications
- 3.1. Smartphones
- 3.2. Tablets and Notebooks
- 3.3. Workstations
- 3.4. Gaming PC
- 3.5. Media and Entertainment
- 3.6. Automotives
Graphic Processor Industry Segmentation By Geography
- 1. North America
- 2. Europe
- 3. Asia Pacific
- 4. Latin America
- 5. Middle East and Africa
Graphic Processor Industry REPORT HIGHLIGHTS
| Aspects | Details |
|---|---|
| Study Period | 2019-2033 |
| Base Year | 2024 |
| Estimated Year | 2025 |
| Forecast Period | 2025-2033 |
| Historical Period | 2019-2024 |
| Growth Rate | CAGR of 33.35% from 2019-2033 |
| Segmentation |
|
Table of Contents
- 1. Introduction
- 1.1. Research Scope
- 1.2. Market Segmentation
- 1.3. Research Methodology
- 1.4. Definitions and Assumptions
- 2. Executive Summary
- 2.1. Introduction
- 3. Market Dynamics
- 3.1. Introduction
- 3.2. Market Drivers
- 3.2.1. Increasing Demand for Graphic Applications; Rise of Geographic Information Systems (GIS) and Immersive Multimedia
- 3.3. Market Restrains
- 3.3.1. Declining Workstation Sales
- 3.4. Market Trends
- 3.4.1. Gaming Industry to Augment Market Growth
- 4. Market Factor Analysis
- 4.1. Porters Five Forces
- 4.2. Supply/Value Chain
- 4.3. PESTEL analysis
- 4.4. Market Entropy
- 4.5. Patent/Trademark Analysis
- 5. Global Graphic Processor Industry Analysis, Insights and Forecast, 2019-2031
- 5.1. Market Analysis, Insights and Forecast - by Type
- 5.1.1. Dedicated Graphics Card
- 5.1.2. Integrated Graphics Solutions
- 5.1.3. Hybrid Solutions
- 5.2. Market Analysis, Insights and Forecast - by Deployement
- 5.2.1. On-premise
- 5.2.2. Cloud
- 5.3. Market Analysis, Insights and Forecast - by Applications
- 5.3.1. Smartphones
- 5.3.2. Tablets and Notebooks
- 5.3.3. Workstations
- 5.3.4. Gaming PC
- 5.3.5. Media and Entertainment
- 5.3.6. Automotives
- 5.4. Market Analysis, Insights and Forecast - by Region
- 5.4.1. North America
- 5.4.2. Europe
- 5.4.3. Asia Pacific
- 5.4.4. Latin America
- 5.4.5. Middle East and Africa
- 5.1. Market Analysis, Insights and Forecast - by Type
- 6. North America Graphic Processor Industry Analysis, Insights and Forecast, 2019-2031
- 6.1. Market Analysis, Insights and Forecast - by Type
- 6.1.1. Dedicated Graphics Card
- 6.1.2. Integrated Graphics Solutions
- 6.1.3. Hybrid Solutions
- 6.2. Market Analysis, Insights and Forecast - by Deployement
- 6.2.1. On-premise
- 6.2.2. Cloud
- 6.3. Market Analysis, Insights and Forecast - by Applications
- 6.3.1. Smartphones
- 6.3.2. Tablets and Notebooks
- 6.3.3. Workstations
- 6.3.4. Gaming PC
- 6.3.5. Media and Entertainment
- 6.3.6. Automotives
- 6.1. Market Analysis, Insights and Forecast - by Type
- 7. Europe Graphic Processor Industry Analysis, Insights and Forecast, 2019-2031
- 7.1. Market Analysis, Insights and Forecast - by Type
- 7.1.1. Dedicated Graphics Card
- 7.1.2. Integrated Graphics Solutions
- 7.1.3. Hybrid Solutions
- 7.2. Market Analysis, Insights and Forecast - by Deployement
- 7.2.1. On-premise
- 7.2.2. Cloud
- 7.3. Market Analysis, Insights and Forecast - by Applications
- 7.3.1. Smartphones
- 7.3.2. Tablets and Notebooks
- 7.3.3. Workstations
- 7.3.4. Gaming PC
- 7.3.5. Media and Entertainment
- 7.3.6. Automotives
- 7.1. Market Analysis, Insights and Forecast - by Type
- 8. Asia Pacific Graphic Processor Industry Analysis, Insights and Forecast, 2019-2031
- 8.1. Market Analysis, Insights and Forecast - by Type
- 8.1.1. Dedicated Graphics Card
- 8.1.2. Integrated Graphics Solutions
- 8.1.3. Hybrid Solutions
- 8.2. Market Analysis, Insights and Forecast - by Deployement
- 8.2.1. On-premise
- 8.2.2. Cloud
- 8.3. Market Analysis, Insights and Forecast - by Applications
- 8.3.1. Smartphones
- 8.3.2. Tablets and Notebooks
- 8.3.3. Workstations
- 8.3.4. Gaming PC
- 8.3.5. Media and Entertainment
- 8.3.6. Automotives
- 8.1. Market Analysis, Insights and Forecast - by Type
- 9. Latin America Graphic Processor Industry Analysis, Insights and Forecast, 2019-2031
- 9.1. Market Analysis, Insights and Forecast - by Type
- 9.1.1. Dedicated Graphics Card
- 9.1.2. Integrated Graphics Solutions
- 9.1.3. Hybrid Solutions
- 9.2. Market Analysis, Insights and Forecast - by Deployement
- 9.2.1. On-premise
- 9.2.2. Cloud
- 9.3. Market Analysis, Insights and Forecast - by Applications
- 9.3.1. Smartphones
- 9.3.2. Tablets and Notebooks
- 9.3.3. Workstations
- 9.3.4. Gaming PC
- 9.3.5. Media and Entertainment
- 9.3.6. Automotives
- 9.1. Market Analysis, Insights and Forecast - by Type
- 10. Middle East and Africa Graphic Processor Industry Analysis, Insights and Forecast, 2019-2031
- 10.1. Market Analysis, Insights and Forecast - by Type
- 10.1.1. Dedicated Graphics Card
- 10.1.2. Integrated Graphics Solutions
- 10.1.3. Hybrid Solutions
- 10.2. Market Analysis, Insights and Forecast - by Deployement
- 10.2.1. On-premise
- 10.2.2. Cloud
- 10.3. Market Analysis, Insights and Forecast - by Applications
- 10.3.1. Smartphones
- 10.3.2. Tablets and Notebooks
- 10.3.3. Workstations
- 10.3.4. Gaming PC
- 10.3.5. Media and Entertainment
- 10.3.6. Automotives
- 10.1. Market Analysis, Insights and Forecast - by Type
- 11. North America Graphic Processor Industry Analysis, Insights and Forecast, 2019-2031
- 11.1. Market Analysis, Insights and Forecast - By Country/Sub-region
- 11.1.1.
- 12. Europe Graphic Processor Industry Analysis, Insights and Forecast, 2019-2031
- 12.1. Market Analysis, Insights and Forecast - By Country/Sub-region
- 12.1.1.
- 13. Asia Pacific Graphic Processor Industry Analysis, Insights and Forecast, 2019-2031
- 13.1. Market Analysis, Insights and Forecast - By Country/Sub-region
- 13.1.1.
- 14. Latin America Graphic Processor Industry Analysis, Insights and Forecast, 2019-2031
- 14.1. Market Analysis, Insights and Forecast - By Country/Sub-region
- 14.1.1.
- 15. Middle East and Africa Graphic Processor Industry Analysis, Insights and Forecast, 2019-2031
- 15.1. Market Analysis, Insights and Forecast - By Country/Sub-region
- 15.1.1.
- 16. Competitive Analysis
- 16.1. Global Market Share Analysis 2024
- 16.2. Company Profiles
- 16.2.1 IBM Corporation
- 16.2.1.1. Overview
- 16.2.1.2. Products
- 16.2.1.3. SWOT Analysis
- 16.2.1.4. Recent Developments
- 16.2.1.5. Financials (Based on Availability)
- 16.2.2 Fujitsu Ltd
- 16.2.2.1. Overview
- 16.2.2.2. Products
- 16.2.2.3. SWOT Analysis
- 16.2.2.4. Recent Developments
- 16.2.2.5. Financials (Based on Availability)
- 16.2.3 NVIDIA Corporation
- 16.2.3.1. Overview
- 16.2.3.2. Products
- 16.2.3.3. SWOT Analysis
- 16.2.3.4. Recent Developments
- 16.2.3.5. Financials (Based on Availability)
- 16.2.4 Samsung Electronics Co Ltd
- 16.2.4.1. Overview
- 16.2.4.2. Products
- 16.2.4.3. SWOT Analysis
- 16.2.4.4. Recent Developments
- 16.2.4.5. Financials (Based on Availability)
- 16.2.5 Qualcomm Incorporated
- 16.2.5.1. Overview
- 16.2.5.2. Products
- 16.2.5.3. SWOT Analysis
- 16.2.5.4. Recent Developments
- 16.2.5.5. Financials (Based on Availability)
- 16.2.6 Advanced Micro Devices Inc
- 16.2.6.1. Overview
- 16.2.6.2. Products
- 16.2.6.3. SWOT Analysis
- 16.2.6.4. Recent Developments
- 16.2.6.5. Financials (Based on Availability)
- 16.2.7 Taiwan Semiconductor Manufacturing Company Ltd
- 16.2.7.1. Overview
- 16.2.7.2. Products
- 16.2.7.3. SWOT Analysis
- 16.2.7.4. Recent Developments
- 16.2.7.5. Financials (Based on Availability)
- 16.2.8 Intel Corporation
- 16.2.8.1. Overview
- 16.2.8.2. Products
- 16.2.8.3. SWOT Analysis
- 16.2.8.4. Recent Developments
- 16.2.8.5. Financials (Based on Availability)
- 16.2.9 Sony Corporation
- 16.2.9.1. Overview
- 16.2.9.2. Products
- 16.2.9.3. SWOT Analysis
- 16.2.9.4. Recent Developments
- 16.2.9.5. Financials (Based on Availability)
- 16.2.10 Apple Inc *List Not Exhaustive
- 16.2.10.1. Overview
- 16.2.10.2. Products
- 16.2.10.3. SWOT Analysis
- 16.2.10.4. Recent Developments
- 16.2.10.5. Financials (Based on Availability)
- 16.2.1 IBM Corporation
List of Figures
- Figure 1: Global Graphic Processor Industry Revenue Breakdown (Million, %) by Region 2024 & 2032
- Figure 2: North America Graphic Processor Industry Revenue (Million), by Country 2024 & 2032
- Figure 3: North America Graphic Processor Industry Revenue Share (%), by Country 2024 & 2032
- Figure 4: Europe Graphic Processor Industry Revenue (Million), by Country 2024 & 2032
- Figure 5: Europe Graphic Processor Industry Revenue Share (%), by Country 2024 & 2032
- Figure 6: Asia Pacific Graphic Processor Industry Revenue (Million), by Country 2024 & 2032
- Figure 7: Asia Pacific Graphic Processor Industry Revenue Share (%), by Country 2024 & 2032
- Figure 8: Latin America Graphic Processor Industry Revenue (Million), by Country 2024 & 2032
- Figure 9: Latin America Graphic Processor Industry Revenue Share (%), by Country 2024 & 2032
- Figure 10: Middle East and Africa Graphic Processor Industry Revenue (Million), by Country 2024 & 2032
- Figure 11: Middle East and Africa Graphic Processor Industry Revenue Share (%), by Country 2024 & 2032
- Figure 12: North America Graphic Processor Industry Revenue (Million), by Type 2024 & 2032
- Figure 13: North America Graphic Processor Industry Revenue Share (%), by Type 2024 & 2032
- Figure 14: North America Graphic Processor Industry Revenue (Million), by Deployement 2024 & 2032
- Figure 15: North America Graphic Processor Industry Revenue Share (%), by Deployement 2024 & 2032
- Figure 16: North America Graphic Processor Industry Revenue (Million), by Applications 2024 & 2032
- Figure 17: North America Graphic Processor Industry Revenue Share (%), by Applications 2024 & 2032
- Figure 18: North America Graphic Processor Industry Revenue (Million), by Country 2024 & 2032
- Figure 19: North America Graphic Processor Industry Revenue Share (%), by Country 2024 & 2032
- Figure 20: Europe Graphic Processor Industry Revenue (Million), by Type 2024 & 2032
- Figure 21: Europe Graphic Processor Industry Revenue Share (%), by Type 2024 & 2032
- Figure 22: Europe Graphic Processor Industry Revenue (Million), by Deployement 2024 & 2032
- Figure 23: Europe Graphic Processor Industry Revenue Share (%), by Deployement 2024 & 2032
- Figure 24: Europe Graphic Processor Industry Revenue (Million), by Applications 2024 & 2032
- Figure 25: Europe Graphic Processor Industry Revenue Share (%), by Applications 2024 & 2032
- Figure 26: Europe Graphic Processor Industry Revenue (Million), by Country 2024 & 2032
- Figure 27: Europe Graphic Processor Industry Revenue Share (%), by Country 2024 & 2032
- Figure 28: Asia Pacific Graphic Processor Industry Revenue (Million), by Type 2024 & 2032
- Figure 29: Asia Pacific Graphic Processor Industry Revenue Share (%), by Type 2024 & 2032
- Figure 30: Asia Pacific Graphic Processor Industry Revenue (Million), by Deployement 2024 & 2032
- Figure 31: Asia Pacific Graphic Processor Industry Revenue Share (%), by Deployement 2024 & 2032
- Figure 32: Asia Pacific Graphic Processor Industry Revenue (Million), by Applications 2024 & 2032
- Figure 33: Asia Pacific Graphic Processor Industry Revenue Share (%), by Applications 2024 & 2032
- Figure 34: Asia Pacific Graphic Processor Industry Revenue (Million), by Country 2024 & 2032
- Figure 35: Asia Pacific Graphic Processor Industry Revenue Share (%), by Country 2024 & 2032
- Figure 36: Latin America Graphic Processor Industry Revenue (Million), by Type 2024 & 2032
- Figure 37: Latin America Graphic Processor Industry Revenue Share (%), by Type 2024 & 2032
- Figure 38: Latin America Graphic Processor Industry Revenue (Million), by Deployement 2024 & 2032
- Figure 39: Latin America Graphic Processor Industry Revenue Share (%), by Deployement 2024 & 2032
- Figure 40: Latin America Graphic Processor Industry Revenue (Million), by Applications 2024 & 2032
- Figure 41: Latin America Graphic Processor Industry Revenue Share (%), by Applications 2024 & 2032
- Figure 42: Latin America Graphic Processor Industry Revenue (Million), by Country 2024 & 2032
- Figure 43: Latin America Graphic Processor Industry Revenue Share (%), by Country 2024 & 2032
- Figure 44: Middle East and Africa Graphic Processor Industry Revenue (Million), by Type 2024 & 2032
- Figure 45: Middle East and Africa Graphic Processor Industry Revenue Share (%), by Type 2024 & 2032
- Figure 46: Middle East and Africa Graphic Processor Industry Revenue (Million), by Deployement 2024 & 2032
- Figure 47: Middle East and Africa Graphic Processor Industry Revenue Share (%), by Deployement 2024 & 2032
- Figure 48: Middle East and Africa Graphic Processor Industry Revenue (Million), by Applications 2024 & 2032
- Figure 49: Middle East and Africa Graphic Processor Industry Revenue Share (%), by Applications 2024 & 2032
- Figure 50: Middle East and Africa Graphic Processor Industry Revenue (Million), by Country 2024 & 2032
- Figure 51: Middle East and Africa Graphic Processor Industry Revenue Share (%), by Country 2024 & 2032
List of Tables
- Table 1: Global Graphic Processor Industry Revenue Million Forecast, by Region 2019 & 2032
- Table 2: Global Graphic Processor Industry Revenue Million Forecast, by Type 2019 & 2032
- Table 3: Global Graphic Processor Industry Revenue Million Forecast, by Deployement 2019 & 2032
- Table 4: Global Graphic Processor Industry Revenue Million Forecast, by Applications 2019 & 2032
- Table 5: Global Graphic Processor Industry Revenue Million Forecast, by Region 2019 & 2032
- Table 6: Global Graphic Processor Industry Revenue Million Forecast, by Country 2019 & 2032
- Table 7: Graphic Processor Industry Revenue (Million) Forecast, by Application 2019 & 2032
- Table 8: Global Graphic Processor Industry Revenue Million Forecast, by Country 2019 & 2032
- Table 9: Graphic Processor Industry Revenue (Million) Forecast, by Application 2019 & 2032
- Table 10: Global Graphic Processor Industry Revenue Million Forecast, by Country 2019 & 2032
- Table 11: Graphic Processor Industry Revenue (Million) Forecast, by Application 2019 & 2032
- Table 12: Global Graphic Processor Industry Revenue Million Forecast, by Country 2019 & 2032
- Table 13: Graphic Processor Industry Revenue (Million) Forecast, by Application 2019 & 2032
- Table 14: Global Graphic Processor Industry Revenue Million Forecast, by Country 2019 & 2032
- Table 15: Graphic Processor Industry Revenue (Million) Forecast, by Application 2019 & 2032
- Table 16: Global Graphic Processor Industry Revenue Million Forecast, by Type 2019 & 2032
- Table 17: Global Graphic Processor Industry Revenue Million Forecast, by Deployement 2019 & 2032
- Table 18: Global Graphic Processor Industry Revenue Million Forecast, by Applications 2019 & 2032
- Table 19: Global Graphic Processor Industry Revenue Million Forecast, by Country 2019 & 2032
- Table 20: Global Graphic Processor Industry Revenue Million Forecast, by Type 2019 & 2032
- Table 21: Global Graphic Processor Industry Revenue Million Forecast, by Deployement 2019 & 2032
- Table 22: Global Graphic Processor Industry Revenue Million Forecast, by Applications 2019 & 2032
- Table 23: Global Graphic Processor Industry Revenue Million Forecast, by Country 2019 & 2032
- Table 24: Global Graphic Processor Industry Revenue Million Forecast, by Type 2019 & 2032
- Table 25: Global Graphic Processor Industry Revenue Million Forecast, by Deployement 2019 & 2032
- Table 26: Global Graphic Processor Industry Revenue Million Forecast, by Applications 2019 & 2032
- Table 27: Global Graphic Processor Industry Revenue Million Forecast, by Country 2019 & 2032
- Table 28: Global Graphic Processor Industry Revenue Million Forecast, by Type 2019 & 2032
- Table 29: Global Graphic Processor Industry Revenue Million Forecast, by Deployement 2019 & 2032
- Table 30: Global Graphic Processor Industry Revenue Million Forecast, by Applications 2019 & 2032
- Table 31: Global Graphic Processor Industry Revenue Million Forecast, by Country 2019 & 2032
- Table 32: Global Graphic Processor Industry Revenue Million Forecast, by Type 2019 & 2032
- Table 33: Global Graphic Processor Industry Revenue Million Forecast, by Deployement 2019 & 2032
- Table 34: Global Graphic Processor Industry Revenue Million Forecast, by Applications 2019 & 2032
- Table 35: Global Graphic Processor Industry Revenue Million Forecast, by Country 2019 & 2032
Frequently Asked Questions
1. What is the projected Compound Annual Growth Rate (CAGR) of the Graphic Processor Industry?
The projected CAGR is approximately 33.35%.
2. Which companies are prominent players in the Graphic Processor Industry?
Key companies in the market include IBM Corporation, Fujitsu Ltd, NVIDIA Corporation, Samsung Electronics Co Ltd, Qualcomm Incorporated, Advanced Micro Devices Inc, Taiwan Semiconductor Manufacturing Company Ltd, Intel Corporation, Sony Corporation, Apple Inc *List Not Exhaustive.
3. What are the main segments of the Graphic Processor Industry?
The market segments include Type, Deployement, Applications.
4. Can you provide details about the market size?
The market size is estimated to be USD XX Million as of 2022.
5. What are some drivers contributing to market growth?
Increasing Demand for Graphic Applications; Rise of Geographic Information Systems (GIS) and Immersive Multimedia.
6. What are the notable trends driving market growth?
Gaming Industry to Augment Market Growth.
7. Are there any restraints impacting market growth?
Declining Workstation Sales.
8. Can you provide examples of recent developments in the market?
July 2022: The first 16-gigabit (Gb) Graphics Double Data Rate 6 (GDDR6) DRAM with processing speeds of 24 gigabits per second (Gbps) was launched by Samsung Electronics. The new memory, which is built using extreme ultraviolet (EUV) technology and Samsung's third-generation 10-nanometer-class (1z) process, is intended to significantly improve graphics performance for next-generation graphics cards (Video Graphics Arrays), laptops, game consoles, artificial intelligence-based applications, and high-performance computing (HPC) systems.
9. What pricing options are available for accessing the report?
Pricing options include single-user, multi-user, and enterprise licenses priced at USD 4750, USD 5250, and USD 8750 respectively.
10. Is the market size provided in terms of value or volume?
The market size is provided in terms of value, measured in Million.
11. Are there any specific market keywords associated with the report?
Yes, the market keyword associated with the report is "Graphic Processor Industry," which aids in identifying and referencing the specific market segment covered.
12. How do I determine which pricing option suits my needs best?
The pricing options vary based on user requirements and access needs. Individual users may opt for single-user licenses, while businesses requiring broader access may choose multi-user or enterprise licenses for cost-effective access to the report.
13. Are there any additional resources or data provided in the Graphic Processor Industry report?
While the report offers comprehensive insights, it's advisable to review the specific contents or supplementary materials provided to ascertain if additional resources or data are available.
14. How can I stay updated on further developments or reports in the Graphic Processor Industry?
To stay informed about further developments, trends, and reports in the Graphic Processor Industry, consider subscribing to industry newsletters, following relevant companies and organizations, or regularly checking reputable industry news sources and publications.
Methodology
Step 1 - Identification of Relevant Samples Size from Population Database


Step 2 - Approaches for Defining Global Market Size (Value, Volume* & Price*)

Note*: In applicable scenarios
Step 3 - Data Sources
Primary Research
- Web Analytics
- Survey Reports
- Research Institute
- Latest Research Reports
- Opinion Leaders
Secondary Research
- Annual Reports
- White Paper
- Latest Press Release
- Industry Association
- Paid Database
- Investor Presentations

Step 4 - Data Triangulation
Involves using different sources of information in order to increase the validity of a study
These sources are likely to be stakeholders in a program - participants, other researchers, program staff, other community members, and so on.
Then we put all data in single framework & apply various statistical tools to find out the dynamic on the market.
During the analysis stage, feedback from the stakeholder groups would be compared to determine areas of agreement as well as areas of divergence


