
Key Insights
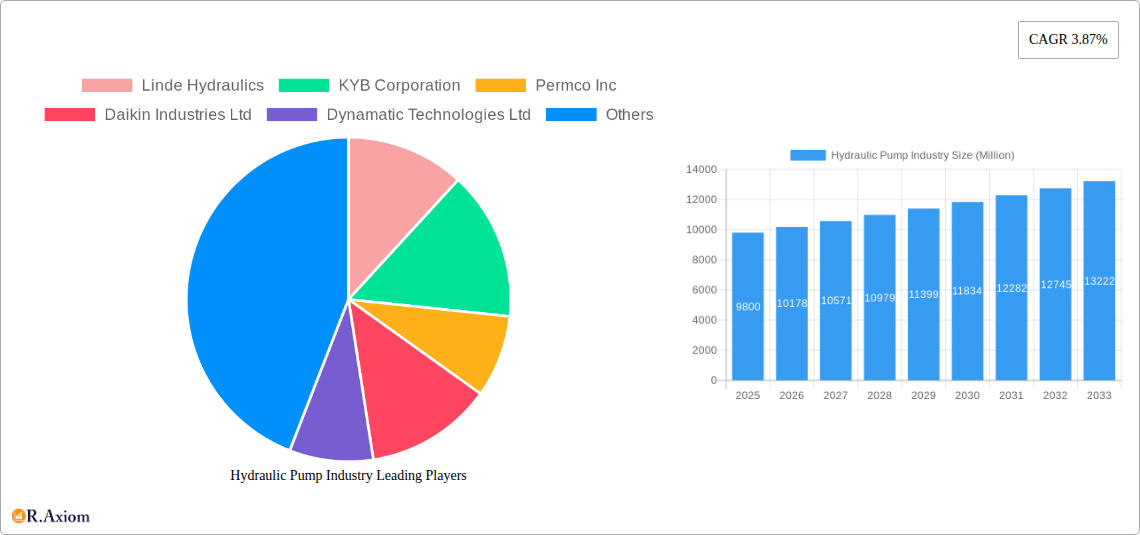
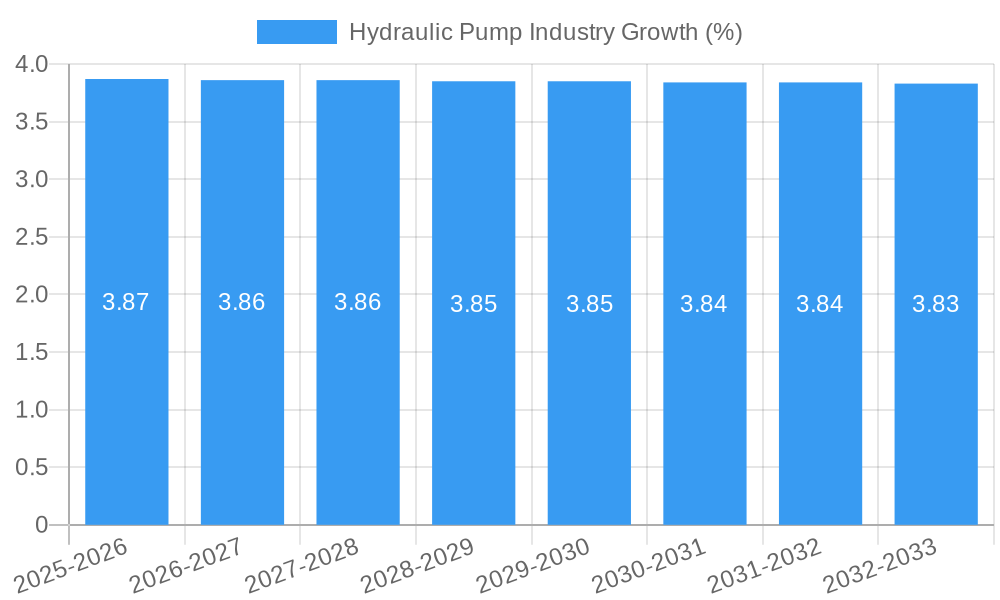
The global Hydraulic Pump market is poised for steady expansion, with an estimated market size of approximately USD 9,800 million in 2025, growing at a Compound Annual Growth Rate (CAGR) of 3.87% through 2033. This growth is primarily propelled by the robust demand from key industrial sectors like Oil and Gas, Food and Beverage, and Water and Wastewater management. Advancements in pump technology, focusing on improved efficiency, durability, and integration with smart systems, are significant drivers. The increasing adoption of hydraulic systems in emerging applications such as renewable energy infrastructure and advanced manufacturing processes further fuels market momentum. Furthermore, the ongoing need for reliable and high-performance fluid power solutions in heavy machinery and industrial automation underscores the consistent demand for hydraulic pumps.
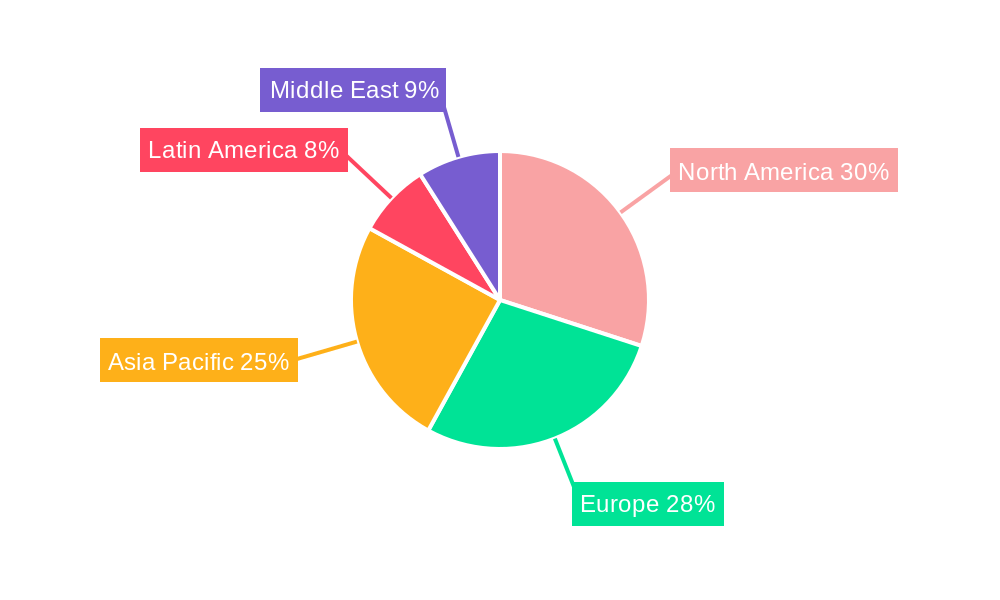
Despite the positive outlook, certain factors present challenges to market growth. The increasing adoption of electric and alternative power solutions in some applications, coupled with stringent environmental regulations regarding fluid leakage and disposal, could pose a restraint. However, the inherent advantages of hydraulic systems, including high power density and precise control, ensure their continued relevance across a wide spectrum of industries. The market is segmented by pump type, with Gear, Vane, and Piston pumps dominating, each catering to specific application requirements. Regionally, North America and Europe are established markets with significant adoption, while the Asia Pacific region is anticipated to exhibit the fastest growth due to rapid industrialization and infrastructure development. Key players like Parker Hannifin Corporation, Eaton Corporation, and Bosch Rexroth Ltd are actively investing in innovation and expanding their global presence to capitalize on these market dynamics.
Unlock the potential of the global Hydraulic Pump Industry with this in-depth market research report. Covering the historical period of 2019-2024, base year 2025, and a robust forecast period from 2025-2033, this report provides an unparalleled analysis of market dynamics, key players, technological advancements, and future growth trajectories. We delve into the intricacies of the Hydraulic Pump market, offering actionable insights for stakeholders seeking to navigate this dynamic sector. Our analysis encompasses a wide array of pump types, including Gear, Vane, and Piston pumps, and examines their application across critical end-user verticals such as Oil and Gas, Food and Beverage, Water and Wastewater, Power Generation, Construction, Chemicals, and other diverse industries. With an estimated market size projected to reach USD XX Billion by 2033, and a Compound Annual Growth Rate (CAGR) of XX%, this report is an indispensable resource for strategic decision-making.
Hydraulic Pump Industry Market Concentration & Innovation
The global Hydraulic Pump industry exhibits a moderately concentrated market structure, characterized by the presence of several large, established players alongside a growing number of specialized manufacturers. Major companies like Parker Hannifin Corporation, Eaton Corporation, and Bosch Rexroth Ltd hold significant market share, estimated at over XX% combined. Innovation serves as a crucial differentiator, driven by the demand for higher efficiency, increased durability, reduced energy consumption, and enhanced environmental sustainability. Regulatory frameworks, particularly those focusing on emissions and energy efficiency, are increasingly influencing product development. The constant threat of product substitutes, such as electric actuators and alternative fluid power systems in specific applications, compels continuous innovation. End-user trends, including the push for automation and digitalization in industrial processes, are shaping the demand for smart and connected hydraulic pumps. Mergers and acquisitions (M&A) remain an active area, with recent deal values in the hundreds of Millions of dollars, aiming to consolidate market position, expand product portfolios, and acquire new technologies.
Hydraulic Pump Industry Industry Trends & Insights
The Hydraulic Pump Industry is poised for significant expansion, propelled by robust demand from key industrial sectors and ongoing technological advancements. The global market is projected to witness a substantial Compound Annual Growth Rate (CAGR) of XX% during the forecast period (2025–2033), reaching an estimated valuation of USD XX Billion by 2033. This growth is primarily attributed to the increasing mechanization and industrialization across emerging economies, coupled with the growing need for efficient fluid power solutions in sectors like construction, manufacturing, and agriculture. Technological disruptions are a hallmark of this industry. The development of advanced materials, smart sensors, and integrated control systems is leading to the creation of more energy-efficient, reliable, and intelligent hydraulic pumps. Consumer preferences are shifting towards solutions that offer lower operating costs, reduced maintenance, and a smaller environmental footprint. This trend is fostering innovation in areas such as variable displacement pumps and energy recovery systems. Competitive dynamics are intensifying, with companies focusing on product differentiation through performance, customization, and integrated service offerings. The market penetration of specialized hydraulic pumps, particularly those designed for niche applications in sectors like renewable energy and advanced manufacturing, is on the rise. The increasing adoption of Industry 4.0 principles is driving the demand for connected hydraulic systems capable of real-time data monitoring and predictive maintenance, further shaping market trends.
Dominant Markets & Segments in Hydraulic Pump Industry
The global Hydraulic Pump Industry is characterized by diverse regional strengths and segment dominance. Asia Pacific currently stands as the leading region, driven by its rapid industrial growth, substantial manufacturing base, and significant investments in infrastructure development. Countries like China and India are at the forefront, fueled by government initiatives promoting domestic manufacturing and increasing adoption of advanced technologies.
Key Drivers of Dominance in Asia Pacific:
- Rapid Industrialization: Expansion of manufacturing, automotive, and electronics sectors.
- Infrastructure Development: Government investments in construction, transportation, and energy projects.
- Technological Adoption: Increasing demand for efficient and automated machinery.
- Favorable Economic Policies: Supportive regulations and incentives for industrial growth.
Within the Type segmentation, Piston Pumps are expected to command the largest market share due to their high efficiency, precision, and suitability for high-pressure applications, critical for sectors like construction and oil and gas exploration. Gear Pumps remain a strong contender, particularly in general industrial applications where cost-effectiveness and reliability are paramount. Vane Pumps find their niche in medium-pressure applications requiring smooth fluid flow and quiet operation.
The End-user Vertical analysis reveals Construction as a dominant segment. The continuous global demand for new infrastructure, residential and commercial buildings, and heavy machinery operation directly translates into substantial demand for hydraulic pumps. The Oil and Gas sector, despite cyclical fluctuations, remains a significant consumer, particularly for offshore exploration, drilling operations, and pipeline maintenance, requiring robust and high-performance hydraulic systems. The Water and Wastewater sector is also experiencing steady growth due to increasing global focus on water management, infrastructure upgrades, and industrial water treatment processes.
Hydraulic Pump Industry Product Developments
Product development in the Hydraulic Pump industry is intensely focused on enhancing energy efficiency, miniaturization, and intelligent functionalities. Innovations such as magnetic drive systems, as demonstrated by Bungartz's rotary piston pump, are reducing maintenance needs and expanding application possibilities for toxic or viscous fluids. The integration of sensors and IoT capabilities is enabling real-time monitoring, predictive maintenance, and remote diagnostics, offering significant competitive advantages and improved operational uptime for end-users. Furthermore, advancements in material science are leading to pumps with greater durability and resistance to extreme conditions, catering to demanding sectors like Oil and Gas.
Report Scope & Segmentation Analysis
This comprehensive report segments the Hydraulic Pump market by Type, including Gear Pumps, Vane Pumps, and Piston Pumps. Each type exhibits distinct performance characteristics and application suitability. Piston pumps are projected for robust growth due to their superior efficiency in high-pressure applications. The market is also segmented by End-user Vertical, encompassing Oil and Gas, Food and Beverage, Water and Wastewater, Power Generation, Construction, Chemicals, and Other industries. The Construction segment is anticipated to lead in market size and growth, followed closely by Oil and Gas. The Food and Beverage and Water and Wastewater sectors are expected to show consistent, steady growth driven by regulatory compliance and infrastructure development.
Key Drivers of Hydraulic Pump Industry Growth
The Hydraulic Pump industry's growth is primarily propelled by several key factors. The escalating global demand for industrial automation and sophisticated machinery across manufacturing, construction, and agriculture fuels the need for advanced hydraulic systems. Significant investments in infrastructure development worldwide, particularly in emerging economies, directly translate to increased demand for construction equipment powered by hydraulic pumps. Technological advancements, leading to more energy-efficient, durable, and intelligent hydraulic solutions, are critical drivers, enabling manufacturers to meet stringent environmental regulations and operational cost reduction demands. The ongoing recovery and expansion within the Oil and Gas sector, coupled with a renewed focus on renewable energy infrastructure, also contribute significantly to market growth.
Challenges in the Hydraulic Pump Industry Sector
Despite its strong growth trajectory, the Hydraulic Pump industry faces several challenges. Intense competition from both established players and new entrants can exert downward pressure on pricing and profit margins. Fluctuations in raw material costs, such as steel and specialized alloys, can impact manufacturing expenses and profitability. Stringent environmental regulations regarding energy efficiency and emissions necessitate continuous investment in research and development, adding to operational costs. Supply chain disruptions, as seen in recent global events, can affect the availability of critical components and lead to production delays. Furthermore, the growing adoption of electric-driven systems in certain applications presents an indirect substitute threat, requiring hydraulic pump manufacturers to innovate and emphasize their unique advantages in high-power, heavy-duty scenarios.
Emerging Opportunities in Hydraulic Pump Industry
Emerging opportunities within the Hydraulic Pump industry lie in the development of smart, connected pumps that integrate IoT capabilities for predictive maintenance and remote diagnostics, aligning with Industry 4.0 trends. The growing global emphasis on renewable energy, such as wind and solar power, presents a significant opportunity for specialized hydraulic pumps used in turbine operation and solar tracking systems. The increasing demand for sustainable and energy-efficient solutions is driving innovation in variable displacement pumps and energy recovery systems. Furthermore, the expansion of automation in the Food and Beverage and Pharmaceutical industries, requiring precise and hygienic fluid handling, opens up new market niches. The development of lightweight and compact hydraulic systems for mobile and aerospace applications also represents a promising growth avenue.
Leading Players in the Hydraulic Pump Industry Market
- Linde Hydraulics
- KYB Corporation
- Permco Inc
- Daikin Industries Ltd
- Dynamatic Technologies Ltd
- HYDAC International GmbH
- Danfoss Power Solutions
- Bosch Rexroth Ltd
- Enerpac Tool Group
- Kawasaki Heavy Industries Ltd
- Parker Hannifin Corporation
- Shimadzu Corporation
- Bucher Hydraulics GmbH
- Eaton Corporation
Key Developments in Hydraulic Pump Industry Industry
- July 2022: Bungartz, a Germany-based company, introduced a rotary piston pump at ACHEMA. The design, in which the outer shaft torque is transmitted to the pistons by magnets, reduces the pump's maintenance requirements. Application fields of the new pump are numerous, the pumping of toxic, corrosive, or viscous liquids being one of them.
- June 2022: Motion Industries Inc. announced the formation of its fluid power business brand, Mi Fluid Power Solutions. The company will focus on hydraulics, pneumatics, lubrication, filtration, process pumps, precision industrial tooling, and factory automation products.
Strategic Outlook for Hydraulic Pump Industry Market
The strategic outlook for the Hydraulic Pump industry is overwhelmingly positive, driven by sustained global industrial expansion and relentless technological innovation. Future growth will be significantly influenced by the adoption of smart hydraulics, integrating digital technologies for enhanced performance monitoring, predictive maintenance, and operational efficiency. The increasing demand for sustainable and energy-efficient solutions will spur advancements in pump design and control systems, catering to evolving environmental regulations and cost-conscious end-users. The industry is expected to witness continued consolidation through strategic M&A activities, as larger players seek to broaden their product portfolios and geographical reach. Investments in emerging markets and the development of niche applications in sectors like renewable energy and advanced manufacturing will be critical for long-term success, ensuring the Hydraulic Pump industry remains a vital component of the global industrial landscape.
Hydraulic Pump Industry Segmentation
-
1. Type
- 1.1. Gear
- 1.2. Vane
- 1.3. Piston
-
2. End-user Vertical
- 2.1. Oil and Gas
- 2.2. Food and Beverage
- 2.3. Water and Wastewater
- 2.4. Power Generation
- 2.5. Construction
- 2.6. Chemicals
- 2.7. Other
Hydraulic Pump Industry Segmentation By Geography
- 1. North America
- 2. Europe
- 3. Asia Pacific
- 4. Latin America
- 5. Middle East
Hydraulic Pump Industry REPORT HIGHLIGHTS
| Aspects | Details |
|---|---|
| Study Period | 2019-2033 |
| Base Year | 2024 |
| Estimated Year | 2025 |
| Forecast Period | 2025-2033 |
| Historical Period | 2019-2024 |
| Growth Rate | CAGR of 3.87% from 2019-2033 |
| Segmentation |
|
Table of Contents
- 1. Introduction
- 1.1. Research Scope
- 1.2. Market Segmentation
- 1.3. Research Methodology
- 1.4. Definitions and Assumptions
- 2. Executive Summary
- 2.1. Introduction
- 3. Market Dynamics
- 3.1. Introduction
- 3.2. Market Drivers
- 3.2.1. Government Regulations and Awareness Towards CO2 Emission is Driving the Market Growth
- 3.3. Market Restrains
- 3.3.1. High Maintenance Cost Over the Entire Lifespan is Challenging the Market Growth
- 3.4. Market Trends
- 3.4.1. Gear pumps to Witness the Growth
- 4. Market Factor Analysis
- 4.1. Porters Five Forces
- 4.2. Supply/Value Chain
- 4.3. PESTEL analysis
- 4.4. Market Entropy
- 4.5. Patent/Trademark Analysis
- 5. Global Hydraulic Pump Industry Analysis, Insights and Forecast, 2019-2031
- 5.1. Market Analysis, Insights and Forecast - by Type
- 5.1.1. Gear
- 5.1.2. Vane
- 5.1.3. Piston
- 5.2. Market Analysis, Insights and Forecast - by End-user Vertical
- 5.2.1. Oil and Gas
- 5.2.2. Food and Beverage
- 5.2.3. Water and Wastewater
- 5.2.4. Power Generation
- 5.2.5. Construction
- 5.2.6. Chemicals
- 5.2.7. Other
- 5.3. Market Analysis, Insights and Forecast - by Region
- 5.3.1. North America
- 5.3.2. Europe
- 5.3.3. Asia Pacific
- 5.3.4. Latin America
- 5.3.5. Middle East
- 5.1. Market Analysis, Insights and Forecast - by Type
- 6. North America Hydraulic Pump Industry Analysis, Insights and Forecast, 2019-2031
- 6.1. Market Analysis, Insights and Forecast - by Type
- 6.1.1. Gear
- 6.1.2. Vane
- 6.1.3. Piston
- 6.2. Market Analysis, Insights and Forecast - by End-user Vertical
- 6.2.1. Oil and Gas
- 6.2.2. Food and Beverage
- 6.2.3. Water and Wastewater
- 6.2.4. Power Generation
- 6.2.5. Construction
- 6.2.6. Chemicals
- 6.2.7. Other
- 6.1. Market Analysis, Insights and Forecast - by Type
- 7. Europe Hydraulic Pump Industry Analysis, Insights and Forecast, 2019-2031
- 7.1. Market Analysis, Insights and Forecast - by Type
- 7.1.1. Gear
- 7.1.2. Vane
- 7.1.3. Piston
- 7.2. Market Analysis, Insights and Forecast - by End-user Vertical
- 7.2.1. Oil and Gas
- 7.2.2. Food and Beverage
- 7.2.3. Water and Wastewater
- 7.2.4. Power Generation
- 7.2.5. Construction
- 7.2.6. Chemicals
- 7.2.7. Other
- 7.1. Market Analysis, Insights and Forecast - by Type
- 8. Asia Pacific Hydraulic Pump Industry Analysis, Insights and Forecast, 2019-2031
- 8.1. Market Analysis, Insights and Forecast - by Type
- 8.1.1. Gear
- 8.1.2. Vane
- 8.1.3. Piston
- 8.2. Market Analysis, Insights and Forecast - by End-user Vertical
- 8.2.1. Oil and Gas
- 8.2.2. Food and Beverage
- 8.2.3. Water and Wastewater
- 8.2.4. Power Generation
- 8.2.5. Construction
- 8.2.6. Chemicals
- 8.2.7. Other
- 8.1. Market Analysis, Insights and Forecast - by Type
- 9. Latin America Hydraulic Pump Industry Analysis, Insights and Forecast, 2019-2031
- 9.1. Market Analysis, Insights and Forecast - by Type
- 9.1.1. Gear
- 9.1.2. Vane
- 9.1.3. Piston
- 9.2. Market Analysis, Insights and Forecast - by End-user Vertical
- 9.2.1. Oil and Gas
- 9.2.2. Food and Beverage
- 9.2.3. Water and Wastewater
- 9.2.4. Power Generation
- 9.2.5. Construction
- 9.2.6. Chemicals
- 9.2.7. Other
- 9.1. Market Analysis, Insights and Forecast - by Type
- 10. Middle East Hydraulic Pump Industry Analysis, Insights and Forecast, 2019-2031
- 10.1. Market Analysis, Insights and Forecast - by Type
- 10.1.1. Gear
- 10.1.2. Vane
- 10.1.3. Piston
- 10.2. Market Analysis, Insights and Forecast - by End-user Vertical
- 10.2.1. Oil and Gas
- 10.2.2. Food and Beverage
- 10.2.3. Water and Wastewater
- 10.2.4. Power Generation
- 10.2.5. Construction
- 10.2.6. Chemicals
- 10.2.7. Other
- 10.1. Market Analysis, Insights and Forecast - by Type
- 11. North America Hydraulic Pump Industry Analysis, Insights and Forecast, 2019-2031
- 11.1. Market Analysis, Insights and Forecast - By Country/Sub-region
- 11.1.1 United States
- 11.1.2 Canada
- 11.1.3 Mexico
- 12. Europe Hydraulic Pump Industry Analysis, Insights and Forecast, 2019-2031
- 12.1. Market Analysis, Insights and Forecast - By Country/Sub-region
- 12.1.1 Germany
- 12.1.2 United Kingdom
- 12.1.3 France
- 12.1.4 Spain
- 12.1.5 Italy
- 12.1.6 Spain
- 12.1.7 Belgium
- 12.1.8 Netherland
- 12.1.9 Nordics
- 12.1.10 Rest of Europe
- 13. Asia Pacific Hydraulic Pump Industry Analysis, Insights and Forecast, 2019-2031
- 13.1. Market Analysis, Insights and Forecast - By Country/Sub-region
- 13.1.1 China
- 13.1.2 Japan
- 13.1.3 India
- 13.1.4 South Korea
- 13.1.5 Southeast Asia
- 13.1.6 Australia
- 13.1.7 Indonesia
- 13.1.8 Phillipes
- 13.1.9 Singapore
- 13.1.10 Thailandc
- 13.1.11 Rest of Asia Pacific
- 14. South America Hydraulic Pump Industry Analysis, Insights and Forecast, 2019-2031
- 14.1. Market Analysis, Insights and Forecast - By Country/Sub-region
- 14.1.1 Brazil
- 14.1.2 Argentina
- 14.1.3 Peru
- 14.1.4 Chile
- 14.1.5 Colombia
- 14.1.6 Ecuador
- 14.1.7 Venezuela
- 14.1.8 Rest of South America
- 15. North America Hydraulic Pump Industry Analysis, Insights and Forecast, 2019-2031
- 15.1. Market Analysis, Insights and Forecast - By Country/Sub-region
- 15.1.1 United States
- 15.1.2 Canada
- 15.1.3 Mexico
- 16. MEA Hydraulic Pump Industry Analysis, Insights and Forecast, 2019-2031
- 16.1. Market Analysis, Insights and Forecast - By Country/Sub-region
- 16.1.1 United Arab Emirates
- 16.1.2 Saudi Arabia
- 16.1.3 South Africa
- 16.1.4 Rest of Middle East and Africa
- 17. Competitive Analysis
- 17.1. Global Market Share Analysis 2024
- 17.2. Company Profiles
- 17.2.1 Linde Hydraulics
- 17.2.1.1. Overview
- 17.2.1.2. Products
- 17.2.1.3. SWOT Analysis
- 17.2.1.4. Recent Developments
- 17.2.1.5. Financials (Based on Availability)
- 17.2.2 KYB Corporation
- 17.2.2.1. Overview
- 17.2.2.2. Products
- 17.2.2.3. SWOT Analysis
- 17.2.2.4. Recent Developments
- 17.2.2.5. Financials (Based on Availability)
- 17.2.3 Permco Inc
- 17.2.3.1. Overview
- 17.2.3.2. Products
- 17.2.3.3. SWOT Analysis
- 17.2.3.4. Recent Developments
- 17.2.3.5. Financials (Based on Availability)
- 17.2.4 Daikin Industries Ltd
- 17.2.4.1. Overview
- 17.2.4.2. Products
- 17.2.4.3. SWOT Analysis
- 17.2.4.4. Recent Developments
- 17.2.4.5. Financials (Based on Availability)
- 17.2.5 Dynamatic Technologies Ltd
- 17.2.5.1. Overview
- 17.2.5.2. Products
- 17.2.5.3. SWOT Analysis
- 17.2.5.4. Recent Developments
- 17.2.5.5. Financials (Based on Availability)
- 17.2.6 HYDAC International GmbH
- 17.2.6.1. Overview
- 17.2.6.2. Products
- 17.2.6.3. SWOT Analysis
- 17.2.6.4. Recent Developments
- 17.2.6.5. Financials (Based on Availability)
- 17.2.7 Danfoss Power Solutions
- 17.2.7.1. Overview
- 17.2.7.2. Products
- 17.2.7.3. SWOT Analysis
- 17.2.7.4. Recent Developments
- 17.2.7.5. Financials (Based on Availability)
- 17.2.8 Bosch Rexroth Ltd
- 17.2.8.1. Overview
- 17.2.8.2. Products
- 17.2.8.3. SWOT Analysis
- 17.2.8.4. Recent Developments
- 17.2.8.5. Financials (Based on Availability)
- 17.2.9 Enerpac Tool Group
- 17.2.9.1. Overview
- 17.2.9.2. Products
- 17.2.9.3. SWOT Analysis
- 17.2.9.4. Recent Developments
- 17.2.9.5. Financials (Based on Availability)
- 17.2.10 Kawasaki Heavy Industries Ltd
- 17.2.10.1. Overview
- 17.2.10.2. Products
- 17.2.10.3. SWOT Analysis
- 17.2.10.4. Recent Developments
- 17.2.10.5. Financials (Based on Availability)
- 17.2.11 Parker Hannifin Corporation
- 17.2.11.1. Overview
- 17.2.11.2. Products
- 17.2.11.3. SWOT Analysis
- 17.2.11.4. Recent Developments
- 17.2.11.5. Financials (Based on Availability)
- 17.2.12 Shimadzu Corporation
- 17.2.12.1. Overview
- 17.2.12.2. Products
- 17.2.12.3. SWOT Analysis
- 17.2.12.4. Recent Developments
- 17.2.12.5. Financials (Based on Availability)
- 17.2.13 Bucher Hydraulics GmbH
- 17.2.13.1. Overview
- 17.2.13.2. Products
- 17.2.13.3. SWOT Analysis
- 17.2.13.4. Recent Developments
- 17.2.13.5. Financials (Based on Availability)
- 17.2.14 Eaton Corporation
- 17.2.14.1. Overview
- 17.2.14.2. Products
- 17.2.14.3. SWOT Analysis
- 17.2.14.4. Recent Developments
- 17.2.14.5. Financials (Based on Availability)
- 17.2.1 Linde Hydraulics
List of Figures
- Figure 1: Global Hydraulic Pump Industry Revenue Breakdown (Million, %) by Region 2024 & 2032
- Figure 2: Global Hydraulic Pump Industry Volume Breakdown (K Unit, %) by Region 2024 & 2032
- Figure 3: North America Hydraulic Pump Industry Revenue (Million), by Country 2024 & 2032
- Figure 4: North America Hydraulic Pump Industry Volume (K Unit), by Country 2024 & 2032
- Figure 5: North America Hydraulic Pump Industry Revenue Share (%), by Country 2024 & 2032
- Figure 6: North America Hydraulic Pump Industry Volume Share (%), by Country 2024 & 2032
- Figure 7: Europe Hydraulic Pump Industry Revenue (Million), by Country 2024 & 2032
- Figure 8: Europe Hydraulic Pump Industry Volume (K Unit), by Country 2024 & 2032
- Figure 9: Europe Hydraulic Pump Industry Revenue Share (%), by Country 2024 & 2032
- Figure 10: Europe Hydraulic Pump Industry Volume Share (%), by Country 2024 & 2032
- Figure 11: Asia Pacific Hydraulic Pump Industry Revenue (Million), by Country 2024 & 2032
- Figure 12: Asia Pacific Hydraulic Pump Industry Volume (K Unit), by Country 2024 & 2032
- Figure 13: Asia Pacific Hydraulic Pump Industry Revenue Share (%), by Country 2024 & 2032
- Figure 14: Asia Pacific Hydraulic Pump Industry Volume Share (%), by Country 2024 & 2032
- Figure 15: South America Hydraulic Pump Industry Revenue (Million), by Country 2024 & 2032
- Figure 16: South America Hydraulic Pump Industry Volume (K Unit), by Country 2024 & 2032
- Figure 17: South America Hydraulic Pump Industry Revenue Share (%), by Country 2024 & 2032
- Figure 18: South America Hydraulic Pump Industry Volume Share (%), by Country 2024 & 2032
- Figure 19: North America Hydraulic Pump Industry Revenue (Million), by Country 2024 & 2032
- Figure 20: North America Hydraulic Pump Industry Volume (K Unit), by Country 2024 & 2032
- Figure 21: North America Hydraulic Pump Industry Revenue Share (%), by Country 2024 & 2032
- Figure 22: North America Hydraulic Pump Industry Volume Share (%), by Country 2024 & 2032
- Figure 23: MEA Hydraulic Pump Industry Revenue (Million), by Country 2024 & 2032
- Figure 24: MEA Hydraulic Pump Industry Volume (K Unit), by Country 2024 & 2032
- Figure 25: MEA Hydraulic Pump Industry Revenue Share (%), by Country 2024 & 2032
- Figure 26: MEA Hydraulic Pump Industry Volume Share (%), by Country 2024 & 2032
- Figure 27: North America Hydraulic Pump Industry Revenue (Million), by Type 2024 & 2032
- Figure 28: North America Hydraulic Pump Industry Volume (K Unit), by Type 2024 & 2032
- Figure 29: North America Hydraulic Pump Industry Revenue Share (%), by Type 2024 & 2032
- Figure 30: North America Hydraulic Pump Industry Volume Share (%), by Type 2024 & 2032
- Figure 31: North America Hydraulic Pump Industry Revenue (Million), by End-user Vertical 2024 & 2032
- Figure 32: North America Hydraulic Pump Industry Volume (K Unit), by End-user Vertical 2024 & 2032
- Figure 33: North America Hydraulic Pump Industry Revenue Share (%), by End-user Vertical 2024 & 2032
- Figure 34: North America Hydraulic Pump Industry Volume Share (%), by End-user Vertical 2024 & 2032
- Figure 35: North America Hydraulic Pump Industry Revenue (Million), by Country 2024 & 2032
- Figure 36: North America Hydraulic Pump Industry Volume (K Unit), by Country 2024 & 2032
- Figure 37: North America Hydraulic Pump Industry Revenue Share (%), by Country 2024 & 2032
- Figure 38: North America Hydraulic Pump Industry Volume Share (%), by Country 2024 & 2032
- Figure 39: Europe Hydraulic Pump Industry Revenue (Million), by Type 2024 & 2032
- Figure 40: Europe Hydraulic Pump Industry Volume (K Unit), by Type 2024 & 2032
- Figure 41: Europe Hydraulic Pump Industry Revenue Share (%), by Type 2024 & 2032
- Figure 42: Europe Hydraulic Pump Industry Volume Share (%), by Type 2024 & 2032
- Figure 43: Europe Hydraulic Pump Industry Revenue (Million), by End-user Vertical 2024 & 2032
- Figure 44: Europe Hydraulic Pump Industry Volume (K Unit), by End-user Vertical 2024 & 2032
- Figure 45: Europe Hydraulic Pump Industry Revenue Share (%), by End-user Vertical 2024 & 2032
- Figure 46: Europe Hydraulic Pump Industry Volume Share (%), by End-user Vertical 2024 & 2032
- Figure 47: Europe Hydraulic Pump Industry Revenue (Million), by Country 2024 & 2032
- Figure 48: Europe Hydraulic Pump Industry Volume (K Unit), by Country 2024 & 2032
- Figure 49: Europe Hydraulic Pump Industry Revenue Share (%), by Country 2024 & 2032
- Figure 50: Europe Hydraulic Pump Industry Volume Share (%), by Country 2024 & 2032
- Figure 51: Asia Pacific Hydraulic Pump Industry Revenue (Million), by Type 2024 & 2032
- Figure 52: Asia Pacific Hydraulic Pump Industry Volume (K Unit), by Type 2024 & 2032
- Figure 53: Asia Pacific Hydraulic Pump Industry Revenue Share (%), by Type 2024 & 2032
- Figure 54: Asia Pacific Hydraulic Pump Industry Volume Share (%), by Type 2024 & 2032
- Figure 55: Asia Pacific Hydraulic Pump Industry Revenue (Million), by End-user Vertical 2024 & 2032
- Figure 56: Asia Pacific Hydraulic Pump Industry Volume (K Unit), by End-user Vertical 2024 & 2032
- Figure 57: Asia Pacific Hydraulic Pump Industry Revenue Share (%), by End-user Vertical 2024 & 2032
- Figure 58: Asia Pacific Hydraulic Pump Industry Volume Share (%), by End-user Vertical 2024 & 2032
- Figure 59: Asia Pacific Hydraulic Pump Industry Revenue (Million), by Country 2024 & 2032
- Figure 60: Asia Pacific Hydraulic Pump Industry Volume (K Unit), by Country 2024 & 2032
- Figure 61: Asia Pacific Hydraulic Pump Industry Revenue Share (%), by Country 2024 & 2032
- Figure 62: Asia Pacific Hydraulic Pump Industry Volume Share (%), by Country 2024 & 2032
- Figure 63: Latin America Hydraulic Pump Industry Revenue (Million), by Type 2024 & 2032
- Figure 64: Latin America Hydraulic Pump Industry Volume (K Unit), by Type 2024 & 2032
- Figure 65: Latin America Hydraulic Pump Industry Revenue Share (%), by Type 2024 & 2032
- Figure 66: Latin America Hydraulic Pump Industry Volume Share (%), by Type 2024 & 2032
- Figure 67: Latin America Hydraulic Pump Industry Revenue (Million), by End-user Vertical 2024 & 2032
- Figure 68: Latin America Hydraulic Pump Industry Volume (K Unit), by End-user Vertical 2024 & 2032
- Figure 69: Latin America Hydraulic Pump Industry Revenue Share (%), by End-user Vertical 2024 & 2032
- Figure 70: Latin America Hydraulic Pump Industry Volume Share (%), by End-user Vertical 2024 & 2032
- Figure 71: Latin America Hydraulic Pump Industry Revenue (Million), by Country 2024 & 2032
- Figure 72: Latin America Hydraulic Pump Industry Volume (K Unit), by Country 2024 & 2032
- Figure 73: Latin America Hydraulic Pump Industry Revenue Share (%), by Country 2024 & 2032
- Figure 74: Latin America Hydraulic Pump Industry Volume Share (%), by Country 2024 & 2032
- Figure 75: Middle East Hydraulic Pump Industry Revenue (Million), by Type 2024 & 2032
- Figure 76: Middle East Hydraulic Pump Industry Volume (K Unit), by Type 2024 & 2032
- Figure 77: Middle East Hydraulic Pump Industry Revenue Share (%), by Type 2024 & 2032
- Figure 78: Middle East Hydraulic Pump Industry Volume Share (%), by Type 2024 & 2032
- Figure 79: Middle East Hydraulic Pump Industry Revenue (Million), by End-user Vertical 2024 & 2032
- Figure 80: Middle East Hydraulic Pump Industry Volume (K Unit), by End-user Vertical 2024 & 2032
- Figure 81: Middle East Hydraulic Pump Industry Revenue Share (%), by End-user Vertical 2024 & 2032
- Figure 82: Middle East Hydraulic Pump Industry Volume Share (%), by End-user Vertical 2024 & 2032
- Figure 83: Middle East Hydraulic Pump Industry Revenue (Million), by Country 2024 & 2032
- Figure 84: Middle East Hydraulic Pump Industry Volume (K Unit), by Country 2024 & 2032
- Figure 85: Middle East Hydraulic Pump Industry Revenue Share (%), by Country 2024 & 2032
- Figure 86: Middle East Hydraulic Pump Industry Volume Share (%), by Country 2024 & 2032
List of Tables
- Table 1: Global Hydraulic Pump Industry Revenue Million Forecast, by Region 2019 & 2032
- Table 2: Global Hydraulic Pump Industry Volume K Unit Forecast, by Region 2019 & 2032
- Table 3: Global Hydraulic Pump Industry Revenue Million Forecast, by Type 2019 & 2032
- Table 4: Global Hydraulic Pump Industry Volume K Unit Forecast, by Type 2019 & 2032
- Table 5: Global Hydraulic Pump Industry Revenue Million Forecast, by End-user Vertical 2019 & 2032
- Table 6: Global Hydraulic Pump Industry Volume K Unit Forecast, by End-user Vertical 2019 & 2032
- Table 7: Global Hydraulic Pump Industry Revenue Million Forecast, by Region 2019 & 2032
- Table 8: Global Hydraulic Pump Industry Volume K Unit Forecast, by Region 2019 & 2032
- Table 9: Global Hydraulic Pump Industry Revenue Million Forecast, by Country 2019 & 2032
- Table 10: Global Hydraulic Pump Industry Volume K Unit Forecast, by Country 2019 & 2032
- Table 11: United States Hydraulic Pump Industry Revenue (Million) Forecast, by Application 2019 & 2032
- Table 12: United States Hydraulic Pump Industry Volume (K Unit) Forecast, by Application 2019 & 2032
- Table 13: Canada Hydraulic Pump Industry Revenue (Million) Forecast, by Application 2019 & 2032
- Table 14: Canada Hydraulic Pump Industry Volume (K Unit) Forecast, by Application 2019 & 2032
- Table 15: Mexico Hydraulic Pump Industry Revenue (Million) Forecast, by Application 2019 & 2032
- Table 16: Mexico Hydraulic Pump Industry Volume (K Unit) Forecast, by Application 2019 & 2032
- Table 17: Global Hydraulic Pump Industry Revenue Million Forecast, by Country 2019 & 2032
- Table 18: Global Hydraulic Pump Industry Volume K Unit Forecast, by Country 2019 & 2032
- Table 19: Germany Hydraulic Pump Industry Revenue (Million) Forecast, by Application 2019 & 2032
- Table 20: Germany Hydraulic Pump Industry Volume (K Unit) Forecast, by Application 2019 & 2032
- Table 21: United Kingdom Hydraulic Pump Industry Revenue (Million) Forecast, by Application 2019 & 2032
- Table 22: United Kingdom Hydraulic Pump Industry Volume (K Unit) Forecast, by Application 2019 & 2032
- Table 23: France Hydraulic Pump Industry Revenue (Million) Forecast, by Application 2019 & 2032
- Table 24: France Hydraulic Pump Industry Volume (K Unit) Forecast, by Application 2019 & 2032
- Table 25: Spain Hydraulic Pump Industry Revenue (Million) Forecast, by Application 2019 & 2032
- Table 26: Spain Hydraulic Pump Industry Volume (K Unit) Forecast, by Application 2019 & 2032
- Table 27: Italy Hydraulic Pump Industry Revenue (Million) Forecast, by Application 2019 & 2032
- Table 28: Italy Hydraulic Pump Industry Volume (K Unit) Forecast, by Application 2019 & 2032
- Table 29: Spain Hydraulic Pump Industry Revenue (Million) Forecast, by Application 2019 & 2032
- Table 30: Spain Hydraulic Pump Industry Volume (K Unit) Forecast, by Application 2019 & 2032
- Table 31: Belgium Hydraulic Pump Industry Revenue (Million) Forecast, by Application 2019 & 2032
- Table 32: Belgium Hydraulic Pump Industry Volume (K Unit) Forecast, by Application 2019 & 2032
- Table 33: Netherland Hydraulic Pump Industry Revenue (Million) Forecast, by Application 2019 & 2032
- Table 34: Netherland Hydraulic Pump Industry Volume (K Unit) Forecast, by Application 2019 & 2032
- Table 35: Nordics Hydraulic Pump Industry Revenue (Million) Forecast, by Application 2019 & 2032
- Table 36: Nordics Hydraulic Pump Industry Volume (K Unit) Forecast, by Application 2019 & 2032
- Table 37: Rest of Europe Hydraulic Pump Industry Revenue (Million) Forecast, by Application 2019 & 2032
- Table 38: Rest of Europe Hydraulic Pump Industry Volume (K Unit) Forecast, by Application 2019 & 2032
- Table 39: Global Hydraulic Pump Industry Revenue Million Forecast, by Country 2019 & 2032
- Table 40: Global Hydraulic Pump Industry Volume K Unit Forecast, by Country 2019 & 2032
- Table 41: China Hydraulic Pump Industry Revenue (Million) Forecast, by Application 2019 & 2032
- Table 42: China Hydraulic Pump Industry Volume (K Unit) Forecast, by Application 2019 & 2032
- Table 43: Japan Hydraulic Pump Industry Revenue (Million) Forecast, by Application 2019 & 2032
- Table 44: Japan Hydraulic Pump Industry Volume (K Unit) Forecast, by Application 2019 & 2032
- Table 45: India Hydraulic Pump Industry Revenue (Million) Forecast, by Application 2019 & 2032
- Table 46: India Hydraulic Pump Industry Volume (K Unit) Forecast, by Application 2019 & 2032
- Table 47: South Korea Hydraulic Pump Industry Revenue (Million) Forecast, by Application 2019 & 2032
- Table 48: South Korea Hydraulic Pump Industry Volume (K Unit) Forecast, by Application 2019 & 2032
- Table 49: Southeast Asia Hydraulic Pump Industry Revenue (Million) Forecast, by Application 2019 & 2032
- Table 50: Southeast Asia Hydraulic Pump Industry Volume (K Unit) Forecast, by Application 2019 & 2032
- Table 51: Australia Hydraulic Pump Industry Revenue (Million) Forecast, by Application 2019 & 2032
- Table 52: Australia Hydraulic Pump Industry Volume (K Unit) Forecast, by Application 2019 & 2032
- Table 53: Indonesia Hydraulic Pump Industry Revenue (Million) Forecast, by Application 2019 & 2032
- Table 54: Indonesia Hydraulic Pump Industry Volume (K Unit) Forecast, by Application 2019 & 2032
- Table 55: Phillipes Hydraulic Pump Industry Revenue (Million) Forecast, by Application 2019 & 2032
- Table 56: Phillipes Hydraulic Pump Industry Volume (K Unit) Forecast, by Application 2019 & 2032
- Table 57: Singapore Hydraulic Pump Industry Revenue (Million) Forecast, by Application 2019 & 2032
- Table 58: Singapore Hydraulic Pump Industry Volume (K Unit) Forecast, by Application 2019 & 2032
- Table 59: Thailandc Hydraulic Pump Industry Revenue (Million) Forecast, by Application 2019 & 2032
- Table 60: Thailandc Hydraulic Pump Industry Volume (K Unit) Forecast, by Application 2019 & 2032
- Table 61: Rest of Asia Pacific Hydraulic Pump Industry Revenue (Million) Forecast, by Application 2019 & 2032
- Table 62: Rest of Asia Pacific Hydraulic Pump Industry Volume (K Unit) Forecast, by Application 2019 & 2032
- Table 63: Global Hydraulic Pump Industry Revenue Million Forecast, by Country 2019 & 2032
- Table 64: Global Hydraulic Pump Industry Volume K Unit Forecast, by Country 2019 & 2032
- Table 65: Brazil Hydraulic Pump Industry Revenue (Million) Forecast, by Application 2019 & 2032
- Table 66: Brazil Hydraulic Pump Industry Volume (K Unit) Forecast, by Application 2019 & 2032
- Table 67: Argentina Hydraulic Pump Industry Revenue (Million) Forecast, by Application 2019 & 2032
- Table 68: Argentina Hydraulic Pump Industry Volume (K Unit) Forecast, by Application 2019 & 2032
- Table 69: Peru Hydraulic Pump Industry Revenue (Million) Forecast, by Application 2019 & 2032
- Table 70: Peru Hydraulic Pump Industry Volume (K Unit) Forecast, by Application 2019 & 2032
- Table 71: Chile Hydraulic Pump Industry Revenue (Million) Forecast, by Application 2019 & 2032
- Table 72: Chile Hydraulic Pump Industry Volume (K Unit) Forecast, by Application 2019 & 2032
- Table 73: Colombia Hydraulic Pump Industry Revenue (Million) Forecast, by Application 2019 & 2032
- Table 74: Colombia Hydraulic Pump Industry Volume (K Unit) Forecast, by Application 2019 & 2032
- Table 75: Ecuador Hydraulic Pump Industry Revenue (Million) Forecast, by Application 2019 & 2032
- Table 76: Ecuador Hydraulic Pump Industry Volume (K Unit) Forecast, by Application 2019 & 2032
- Table 77: Venezuela Hydraulic Pump Industry Revenue (Million) Forecast, by Application 2019 & 2032
- Table 78: Venezuela Hydraulic Pump Industry Volume (K Unit) Forecast, by Application 2019 & 2032
- Table 79: Rest of South America Hydraulic Pump Industry Revenue (Million) Forecast, by Application 2019 & 2032
- Table 80: Rest of South America Hydraulic Pump Industry Volume (K Unit) Forecast, by Application 2019 & 2032
- Table 81: Global Hydraulic Pump Industry Revenue Million Forecast, by Country 2019 & 2032
- Table 82: Global Hydraulic Pump Industry Volume K Unit Forecast, by Country 2019 & 2032
- Table 83: United States Hydraulic Pump Industry Revenue (Million) Forecast, by Application 2019 & 2032
- Table 84: United States Hydraulic Pump Industry Volume (K Unit) Forecast, by Application 2019 & 2032
- Table 85: Canada Hydraulic Pump Industry Revenue (Million) Forecast, by Application 2019 & 2032
- Table 86: Canada Hydraulic Pump Industry Volume (K Unit) Forecast, by Application 2019 & 2032
- Table 87: Mexico Hydraulic Pump Industry Revenue (Million) Forecast, by Application 2019 & 2032
- Table 88: Mexico Hydraulic Pump Industry Volume (K Unit) Forecast, by Application 2019 & 2032
- Table 89: Global Hydraulic Pump Industry Revenue Million Forecast, by Country 2019 & 2032
- Table 90: Global Hydraulic Pump Industry Volume K Unit Forecast, by Country 2019 & 2032
- Table 91: United Arab Emirates Hydraulic Pump Industry Revenue (Million) Forecast, by Application 2019 & 2032
- Table 92: United Arab Emirates Hydraulic Pump Industry Volume (K Unit) Forecast, by Application 2019 & 2032
- Table 93: Saudi Arabia Hydraulic Pump Industry Revenue (Million) Forecast, by Application 2019 & 2032
- Table 94: Saudi Arabia Hydraulic Pump Industry Volume (K Unit) Forecast, by Application 2019 & 2032
- Table 95: South Africa Hydraulic Pump Industry Revenue (Million) Forecast, by Application 2019 & 2032
- Table 96: South Africa Hydraulic Pump Industry Volume (K Unit) Forecast, by Application 2019 & 2032
- Table 97: Rest of Middle East and Africa Hydraulic Pump Industry Revenue (Million) Forecast, by Application 2019 & 2032
- Table 98: Rest of Middle East and Africa Hydraulic Pump Industry Volume (K Unit) Forecast, by Application 2019 & 2032
- Table 99: Global Hydraulic Pump Industry Revenue Million Forecast, by Type 2019 & 2032
- Table 100: Global Hydraulic Pump Industry Volume K Unit Forecast, by Type 2019 & 2032
- Table 101: Global Hydraulic Pump Industry Revenue Million Forecast, by End-user Vertical 2019 & 2032
- Table 102: Global Hydraulic Pump Industry Volume K Unit Forecast, by End-user Vertical 2019 & 2032
- Table 103: Global Hydraulic Pump Industry Revenue Million Forecast, by Country 2019 & 2032
- Table 104: Global Hydraulic Pump Industry Volume K Unit Forecast, by Country 2019 & 2032
- Table 105: Global Hydraulic Pump Industry Revenue Million Forecast, by Type 2019 & 2032
- Table 106: Global Hydraulic Pump Industry Volume K Unit Forecast, by Type 2019 & 2032
- Table 107: Global Hydraulic Pump Industry Revenue Million Forecast, by End-user Vertical 2019 & 2032
- Table 108: Global Hydraulic Pump Industry Volume K Unit Forecast, by End-user Vertical 2019 & 2032
- Table 109: Global Hydraulic Pump Industry Revenue Million Forecast, by Country 2019 & 2032
- Table 110: Global Hydraulic Pump Industry Volume K Unit Forecast, by Country 2019 & 2032
- Table 111: Global Hydraulic Pump Industry Revenue Million Forecast, by Type 2019 & 2032
- Table 112: Global Hydraulic Pump Industry Volume K Unit Forecast, by Type 2019 & 2032
- Table 113: Global Hydraulic Pump Industry Revenue Million Forecast, by End-user Vertical 2019 & 2032
- Table 114: Global Hydraulic Pump Industry Volume K Unit Forecast, by End-user Vertical 2019 & 2032
- Table 115: Global Hydraulic Pump Industry Revenue Million Forecast, by Country 2019 & 2032
- Table 116: Global Hydraulic Pump Industry Volume K Unit Forecast, by Country 2019 & 2032
- Table 117: Global Hydraulic Pump Industry Revenue Million Forecast, by Type 2019 & 2032
- Table 118: Global Hydraulic Pump Industry Volume K Unit Forecast, by Type 2019 & 2032
- Table 119: Global Hydraulic Pump Industry Revenue Million Forecast, by End-user Vertical 2019 & 2032
- Table 120: Global Hydraulic Pump Industry Volume K Unit Forecast, by End-user Vertical 2019 & 2032
- Table 121: Global Hydraulic Pump Industry Revenue Million Forecast, by Country 2019 & 2032
- Table 122: Global Hydraulic Pump Industry Volume K Unit Forecast, by Country 2019 & 2032
- Table 123: Global Hydraulic Pump Industry Revenue Million Forecast, by Type 2019 & 2032
- Table 124: Global Hydraulic Pump Industry Volume K Unit Forecast, by Type 2019 & 2032
- Table 125: Global Hydraulic Pump Industry Revenue Million Forecast, by End-user Vertical 2019 & 2032
- Table 126: Global Hydraulic Pump Industry Volume K Unit Forecast, by End-user Vertical 2019 & 2032
- Table 127: Global Hydraulic Pump Industry Revenue Million Forecast, by Country 2019 & 2032
- Table 128: Global Hydraulic Pump Industry Volume K Unit Forecast, by Country 2019 & 2032
Frequently Asked Questions
1. What is the projected Compound Annual Growth Rate (CAGR) of the Hydraulic Pump Industry?
The projected CAGR is approximately 3.87%.
2. Which companies are prominent players in the Hydraulic Pump Industry?
Key companies in the market include Linde Hydraulics, KYB Corporation, Permco Inc, Daikin Industries Ltd, Dynamatic Technologies Ltd, HYDAC International GmbH, Danfoss Power Solutions, Bosch Rexroth Ltd, Enerpac Tool Group, Kawasaki Heavy Industries Ltd, Parker Hannifin Corporation, Shimadzu Corporation, Bucher Hydraulics GmbH, Eaton Corporation.
3. What are the main segments of the Hydraulic Pump Industry?
The market segments include Type, End-user Vertical.
4. Can you provide details about the market size?
The market size is estimated to be USD XX Million as of 2022.
5. What are some drivers contributing to market growth?
Government Regulations and Awareness Towards CO2 Emission is Driving the Market Growth.
6. What are the notable trends driving market growth?
Gear pumps to Witness the Growth.
7. Are there any restraints impacting market growth?
High Maintenance Cost Over the Entire Lifespan is Challenging the Market Growth.
8. Can you provide examples of recent developments in the market?
July 2022 - Bungartz, a Germany-based company, introduced a rotary piston pump at ACHEMA. The design, in which the outer shaft torque is transmitted to the pistons by magnets, reduces the pump's maintenance requirements. Application fields of the new pump are numerous, the pumping of toxic, corrosive, or viscous liquids being one of them.
9. What pricing options are available for accessing the report?
Pricing options include single-user, multi-user, and enterprise licenses priced at USD 4750, USD 5250, and USD 8750 respectively.
10. Is the market size provided in terms of value or volume?
The market size is provided in terms of value, measured in Million and volume, measured in K Unit.
11. Are there any specific market keywords associated with the report?
Yes, the market keyword associated with the report is "Hydraulic Pump Industry," which aids in identifying and referencing the specific market segment covered.
12. How do I determine which pricing option suits my needs best?
The pricing options vary based on user requirements and access needs. Individual users may opt for single-user licenses, while businesses requiring broader access may choose multi-user or enterprise licenses for cost-effective access to the report.
13. Are there any additional resources or data provided in the Hydraulic Pump Industry report?
While the report offers comprehensive insights, it's advisable to review the specific contents or supplementary materials provided to ascertain if additional resources or data are available.
14. How can I stay updated on further developments or reports in the Hydraulic Pump Industry?
To stay informed about further developments, trends, and reports in the Hydraulic Pump Industry, consider subscribing to industry newsletters, following relevant companies and organizations, or regularly checking reputable industry news sources and publications.
Methodology
Step 1 - Identification of Relevant Samples Size from Population Database


Step 2 - Approaches for Defining Global Market Size (Value, Volume* & Price*)

Note*: In applicable scenarios
Step 3 - Data Sources
Primary Research
- Web Analytics
- Survey Reports
- Research Institute
- Latest Research Reports
- Opinion Leaders
Secondary Research
- Annual Reports
- White Paper
- Latest Press Release
- Industry Association
- Paid Database
- Investor Presentations

Step 4 - Data Triangulation
Involves using different sources of information in order to increase the validity of a study
These sources are likely to be stakeholders in a program - participants, other researchers, program staff, other community members, and so on.
Then we put all data in single framework & apply various statistical tools to find out the dynamic on the market.
During the analysis stage, feedback from the stakeholder groups would be compared to determine areas of agreement as well as areas of divergence


