
Key Insights
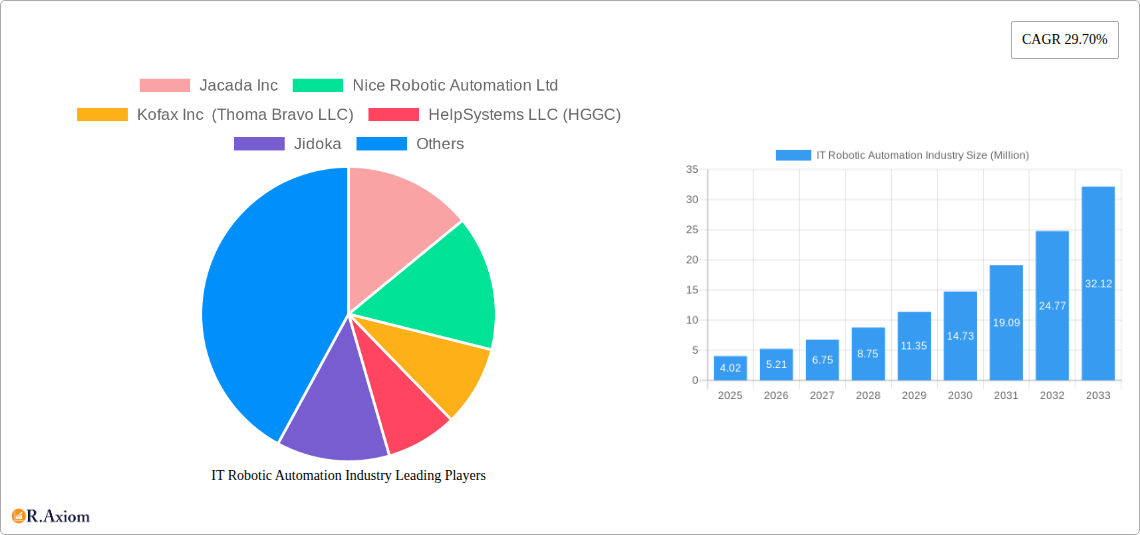
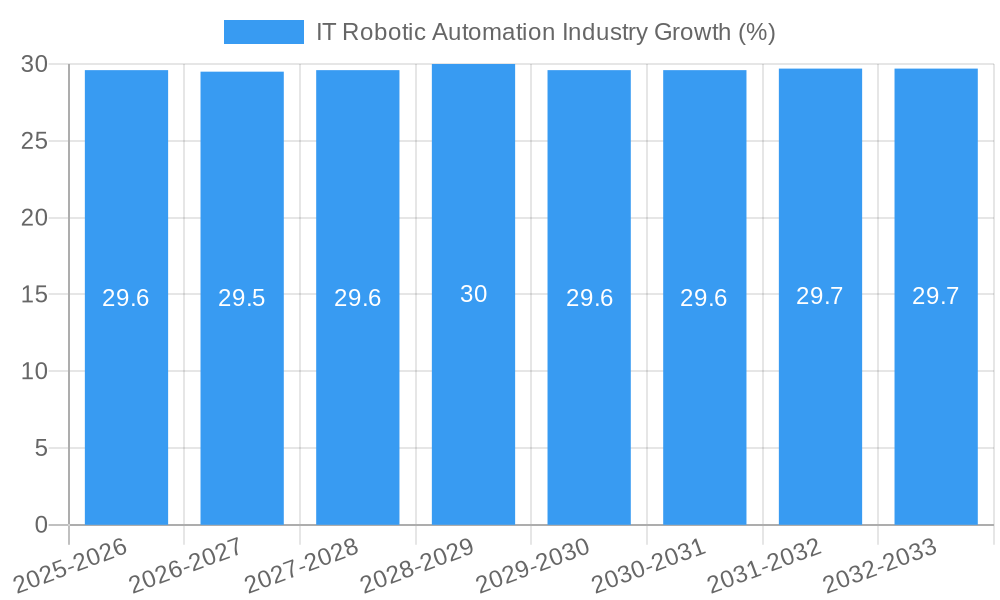
The IT Robotic Automation market is poised for explosive growth, projected to reach $4.02 million in value with an exceptional Compound Annual Growth Rate (CAGR) of 29.70% from 2025 to 2033. This rapid expansion is primarily fueled by the increasing demand for operational efficiency, cost reduction, and enhanced accuracy across a multitude of industries. Enterprises are increasingly adopting Robotic Process Automation (RPA) to automate repetitive, rule-based tasks, thereby freeing up human capital for more strategic and creative endeavors. Key drivers include the pervasive digital transformation initiatives underway globally, the escalating need for process optimization to remain competitive, and the growing maturity of RPA technology, making it more accessible and powerful. The COVID-19 pandemic further accelerated this adoption, highlighting the critical need for resilient and scalable automated solutions.
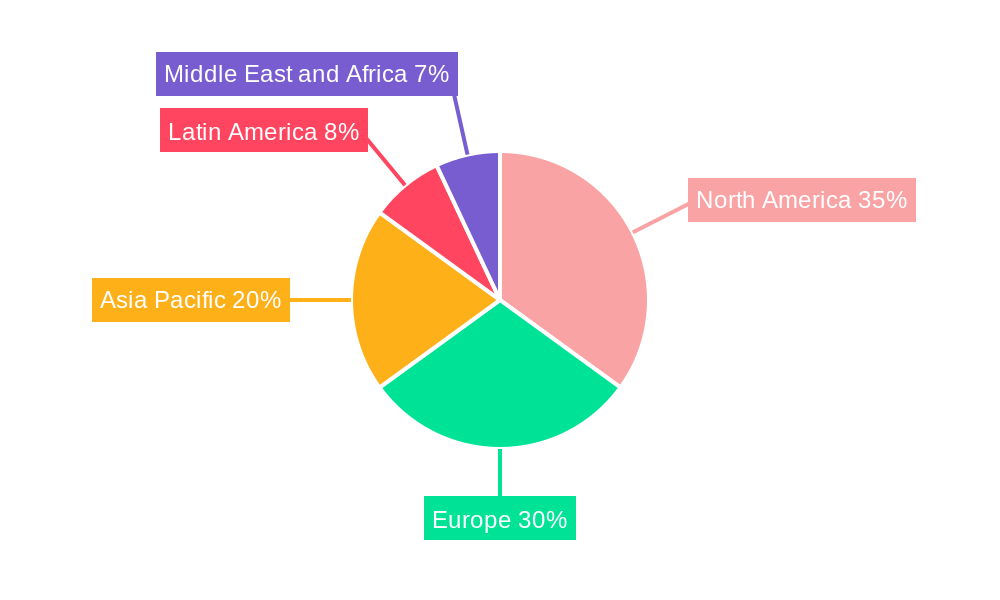
The market is segmented across various dimensions, reflecting its broad applicability. Deployment models are split between on-premise and cloud solutions, with cloud-based RPA gaining significant traction due to its scalability, flexibility, and reduced upfront investment. In terms of solutions, both software and services play crucial roles, with integrated offerings becoming increasingly prevalent. The adoption of robotic automation spans across all enterprise sizes, from small and medium-sized businesses (SMEs) seeking to level the playing field with larger corporations, to large enterprises looking to streamline complex operations. Leading end-user industries driving this growth include IT and Telecom, BFSI, Healthcare, Retail, and Manufacturing, each leveraging RPA to address unique challenges and unlock new efficiencies. Geographically, North America and Europe are currently dominant markets, but the Asia Pacific region is expected to witness the fastest growth due to its burgeoning digital economy and increasing focus on automation. While the potential for hyper-automation and advanced AI integration presents future opportunities, challenges such as initial implementation costs, the need for skilled workforce, and integration complexities with legacy systems remain areas that need careful management.
IT Robotic Automation Industry Market Concentration & Innovation
The IT Robotic Automation Industry is characterized by a moderate level of market concentration, with several key players holding significant market share, estimated at over $10 Million for some leading vendors. Innovation is a primary driver, fueled by advancements in Artificial Intelligence (AI), Machine Learning (ML), and Natural Language Processing (NLP), enabling more sophisticated automation capabilities. Regulatory frameworks, while evolving, generally support automation adoption by emphasizing data security and process efficiency. Product substitutes are emerging, including intelligent process automation (IPA) and hyperautomation solutions, which integrate various automation technologies. End-user trends indicate a strong demand for enhanced operational efficiency, cost reduction, and improved customer experience across diverse sectors. Mergers and acquisitions (M&A) are a notable activity, with deal values frequently exceeding $10 Million, as companies seek to expand their technology portfolios and market reach. For instance, recent M&A activities aim to consolidate capabilities in areas like AI-powered automation and intelligent document processing.
- Market Share: Top players command significant shares, with leading vendors surpassing $10 Million in annual revenue.
- M&A Deal Values: Transactions commonly exceed $10 Million, signifying consolidation and strategic expansion.
- Innovation Drivers: AI, ML, NLP, and advanced analytics are at the forefront of technological advancement.
- Product Substitutes: IPA and hyperautomation offer integrated, broader automation solutions.
IT Robotic Automation Industry Industry Trends & Insights
The IT Robotic Automation industry is poised for robust growth, driven by an accelerating demand for digital transformation and operational efficiency across global enterprises. The Compound Annual Growth Rate (CAGR) is projected to be substantial, with market penetration increasing rapidly as businesses recognize the tangible benefits of automation. Technological disruptions are at the heart of this evolution, with continuous advancements in AI and ML enabling robotic process automation (RPA) to move beyond simple task automation to more complex decision-making and cognitive processes. This evolution towards intelligent automation is a key trend, allowing for the automation of a wider array of business processes, from customer service interactions to intricate data analysis. Consumer preferences are shifting towards seamless, personalized experiences, which intelligent automation can significantly enhance by speeding up response times, reducing errors, and freeing up human agents for more strategic tasks. Competitive dynamics are intensifying, with established players and new entrants vying for market dominance through product innovation, strategic partnerships, and aggressive pricing strategies. The ongoing digital shift, accelerated by global events, has further underscored the necessity of agile and efficient operations, making RPA a critical component of business strategy. The increasing adoption of cloud-based RPA solutions is also democratizing access to automation technologies, making them more accessible to Small and Medium Enterprises (SMEs). The ongoing integration of RPA with other emerging technologies like blockchain and IoT is opening up new avenues for automation, creating a more interconnected and intelligent business ecosystem. The emphasis on data-driven decision-making further propels the adoption of automation, as RPA solutions can efficiently collect, process, and analyze vast amounts of data, providing actionable insights for businesses.
Dominant Markets & Segments in IT Robotic Automation Industry
The Cloud deployment segment is emerging as the dominant force within the IT Robotic Automation Industry. This dominance is propelled by several key drivers, including cost-effectiveness, scalability, and ease of implementation. Cloud-based solutions offer businesses the flexibility to scale their automation initiatives up or down as needed, without the significant upfront investment in hardware and infrastructure associated with on-premise deployments. The accessibility and agility provided by cloud platforms are particularly attractive to Small and Medium Enterprises (SMEs), which are increasingly adopting automation to level the playing field with larger competitors.
Software solutions represent the primary offering in this market, underpinning the capabilities of robotic automation. The continuous innovation in software platforms, incorporating AI and ML, allows for increasingly sophisticated automation of complex tasks. This software-centric approach enables organizations to leverage advanced functionalities without requiring deep technical expertise for basic deployments.
The Large Enterprises segment currently holds a substantial market share due to their greater capacity for investment in advanced automation technologies and their often more complex operational structures that benefit significantly from process optimization. However, the growth trajectory for Small and Medium Enterprises is exceptionally strong, driven by the democratization of RPA tools and the availability of cloud-based, subscription models.
The IT and Telecom sector, along with BFSI (Banking, Financial Services, and Insurance), are leading end-user industries. These sectors have a high volume of repetitive, data-intensive tasks that are prime candidates for automation, leading to significant efficiency gains and cost reductions. The stringent regulatory environments in BFSI also necessitate robust, error-free processes, which RPA can reliably deliver.
- Key Drivers for Cloud Dominance:
- Cost-effectiveness and reduced capital expenditure.
- Scalability and flexibility for dynamic business needs.
- Faster deployment and implementation times.
- Enhanced accessibility for remote workforces.
- Key Drivers for Software Dominance:
- Continuous innovation in AI/ML integration.
- User-friendly interfaces for broader adoption.
- Extensive feature sets supporting complex automation.
- Key Drivers for Large Enterprise Dominance (Current) & SME Growth (Future):
- Significant operational complexity and potential for ROI in large enterprises.
- Increasing affordability and accessibility of RPA for SMEs.
- Competitive pressures driving SMEs to adopt efficiency solutions.
- Key Drivers for IT & Telecom and BFSI Dominance:
- High volume of repetitive and data-intensive tasks.
- Significant potential for cost savings and error reduction.
- Need for enhanced customer experience and regulatory compliance.
IT Robotic Automation Industry Product Developments
Product developments in the IT Robotic Automation industry are increasingly focused on intelligent automation, integrating AI, ML, and advanced analytics to move beyond basic task execution. Innovations include enhanced capabilities for unstructured data processing, natural language understanding, and predictive analytics, enabling robots to handle more complex cognitive tasks. Competitive advantages are being built through seamless integration with existing enterprise systems, user-friendly low-code/no-code development platforms, and robust security features. The trend towards hyperautomation, combining RPA with other automation technologies like process mining and workflow orchestration, is also a significant area of product evolution, offering end-to-end business process transformation.
Report Scope & Segmentation Analysis
This report provides a comprehensive analysis of the IT Robotic Automation Industry, segmenting the market across key dimensions.
Deployment: The market is analyzed based on On-premise and Cloud deployments, with the Cloud segment expected to exhibit higher growth rates due to its inherent scalability and cost-effectiveness.
Solution: We examine the market based on Software and Service offerings. Software solutions are the core of RPA, while services encompass implementation, consulting, and ongoing support, both crucial for market expansion.
Size of Enterprise: The analysis covers Small and Medium Enterprises (SMEs) and Large Enterprises. While large enterprises currently lead in adoption, SMEs represent a significant growth opportunity due to increasing affordability and accessibility.
End User Industry: The report details market dynamics across IT and Telecom, BFSI, Healthcare, Retail, Manufacturing, and Other End User Industries. BFSI and IT/Telecom are identified as key adoption sectors, with Healthcare and Manufacturing showing substantial growth potential.
Key Drivers of IT Robotic Automation Industry Growth
The growth of the IT Robotic Automation Industry is propelled by several critical factors. Economically, the relentless pursuit of operational efficiency and cost reduction in businesses worldwide is a primary driver, with automation offering significant ROI by reducing manual labor costs and minimizing errors. Technologically, advancements in Artificial Intelligence (AI) and Machine Learning (ML) are continuously enhancing the capabilities of robotic automation, allowing for the handling of more complex and cognitive tasks, thus broadening its applicability. Regulatory frameworks in many industries are also indirectly driving adoption by requiring greater accuracy, compliance, and data security, which automated processes can effectively ensure.
Challenges in the IT Robotic Automation Industry Sector
Despite its immense potential, the IT Robotic Automation Industry faces several challenges. A significant barrier is the initial implementation cost and the complexity of integrating automation solutions with legacy IT systems, which can be substantial, particularly for smaller organizations. There are also concerns regarding job displacement, leading to employee resistance and the need for comprehensive reskilling and upskilling programs. Furthermore, ensuring robust data security and compliance with evolving privacy regulations (e.g., GDPR, CCPA) within automated workflows is a constant challenge. Overcoming these hurdles requires strategic planning, effective change management, and a focus on ethical automation practices to ensure widespread and sustainable adoption.
Emerging Opportunities in IT Robotic Automation Industry
Emerging opportunities within the IT Robotic Automation Industry are vast and diverse. The rise of hyperautomation, which integrates RPA with a suite of other technologies like AI, process mining, and low-code platforms, presents a significant avenue for deeper and more comprehensive business process automation. The expansion of RPA into new end-user industries such as utilities, energy, and government services offers substantial untapped market potential. Furthermore, the development of more intuitive and user-friendly automation platforms is democratizing access, empowering SMEs to leverage automation for competitive advantage. The increasing demand for intelligent document processing and advanced analytics within automated workflows also creates opportunities for specialized solutions and services.
Leading Players in the IT Robotic Automation Industry Market
- Jacada Inc
- Nice Robotic Automation Ltd
- Kofax Inc (Thoma Bravo LLC)
- HelpSystems LLC (HGGC)
- Jidoka
- UIPath Inc
- Datamatics Global Services Limited
- Automation Anywhere Inc
- Be Informed BV (Hoogenberg Beheer BV)
- Pegasystems Inc
- AutomationEdge Technologies Inc
- Blue Prism Group PLC
- CGI Inc
Key Developments in IT Robotic Automation Industry Industry
- September 2022: UiPath, a leading enterprise automation software company, strengthened its partnership with Snowflake, the Data Cloud company, by launching a new bi-directional integration that extends the value of automation across the enterprise. UiPath and Snowflake enable joint customers to design and build workflows based on 360-degree views of trusted and accessible data on Snowflake's platform. By leveraging the Snowflake Data Cloud, UiPath robots can quickly connect data directly to business processes in the Data Cloud without using complex code, speeding up time to value.
- August 2022: Digital Workforce Services partnered with Keva, formerly Municipal Pension Insurance, to deliver a robotic process automation solution that was selected in a public procurement procedure. As part of the solution, the robotic process automation solutions in production were moved from the current environment used by Keva to Digital Workforce's cloud service. The service includes solution maintenance, management, and support services. In addition, Digital Workforce offers professional services to Keva.
Strategic Outlook for IT Robotic Automation Industry Market
The strategic outlook for the IT Robotic Automation Industry is overwhelmingly positive, driven by an accelerating digital transformation agenda across all business sectors. The continuous evolution of AI and ML technologies will enable more sophisticated and cognitive automation, pushing the boundaries of what is currently possible and unlocking new use cases. The increasing adoption by SMEs, fueled by cloud-based solutions and more accessible pricing models, represents a significant growth catalyst. Strategic partnerships and collaborations between automation providers and cloud infrastructure companies will further enhance scalability and integration capabilities. Focus on end-to-end process automation and hyperautomation will be critical for stakeholders aiming to capture market share by offering comprehensive solutions that deliver maximum business value and efficiency gains.
IT Robotic Automation Industry Segmentation
-
1. Deployment
- 1.1. On-premise
- 1.2. Cloud
-
2. Solution
- 2.1. Software
- 2.2. Service
-
3. Size of Enterprise
- 3.1. Small and Medium Enterprises
- 3.2. Large Enterprises
-
4. End User Industry
- 4.1. IT and Telecom
- 4.2. BFSI
- 4.3. Healthcare
- 4.4. Retail
- 4.5. Manufacturing
- 4.6. Other End User Industries
IT Robotic Automation Industry Segmentation By Geography
- 1. North America
- 2. Europe
- 3. Asia Pacific
- 4. Latin America
- 5. Middle East and Africa
IT Robotic Automation Industry REPORT HIGHLIGHTS
| Aspects | Details |
|---|---|
| Study Period | 2019-2033 |
| Base Year | 2024 |
| Estimated Year | 2025 |
| Forecast Period | 2025-2033 |
| Historical Period | 2019-2024 |
| Growth Rate | CAGR of 29.70% from 2019-2033 |
| Segmentation |
|
Table of Contents
- 1. Introduction
- 1.1. Research Scope
- 1.2. Market Segmentation
- 1.3. Research Methodology
- 1.4. Definitions and Assumptions
- 2. Executive Summary
- 2.1. Introduction
- 3. Market Dynamics
- 3.1. Introduction
- 3.2. Market Drivers
- 3.2.1. Retail Sector to hold major share in RPA Market; Adoption of AI- and Cloud-based Solutions for Internal Efficiency among SMEs
- 3.3. Market Restrains
- 3.3.1. Data Security Concerns
- 3.4. Market Trends
- 3.4.1. Retail Sector to hold major share in RPA Market
- 4. Market Factor Analysis
- 4.1. Porters Five Forces
- 4.2. Supply/Value Chain
- 4.3. PESTEL analysis
- 4.4. Market Entropy
- 4.5. Patent/Trademark Analysis
- 5. Global IT Robotic Automation Industry Analysis, Insights and Forecast, 2019-2031
- 5.1. Market Analysis, Insights and Forecast - by Deployment
- 5.1.1. On-premise
- 5.1.2. Cloud
- 5.2. Market Analysis, Insights and Forecast - by Solution
- 5.2.1. Software
- 5.2.2. Service
- 5.3. Market Analysis, Insights and Forecast - by Size of Enterprise
- 5.3.1. Small and Medium Enterprises
- 5.3.2. Large Enterprises
- 5.4. Market Analysis, Insights and Forecast - by End User Industry
- 5.4.1. IT and Telecom
- 5.4.2. BFSI
- 5.4.3. Healthcare
- 5.4.4. Retail
- 5.4.5. Manufacturing
- 5.4.6. Other End User Industries
- 5.5. Market Analysis, Insights and Forecast - by Region
- 5.5.1. North America
- 5.5.2. Europe
- 5.5.3. Asia Pacific
- 5.5.4. Latin America
- 5.5.5. Middle East and Africa
- 5.1. Market Analysis, Insights and Forecast - by Deployment
- 6. North America IT Robotic Automation Industry Analysis, Insights and Forecast, 2019-2031
- 6.1. Market Analysis, Insights and Forecast - by Deployment
- 6.1.1. On-premise
- 6.1.2. Cloud
- 6.2. Market Analysis, Insights and Forecast - by Solution
- 6.2.1. Software
- 6.2.2. Service
- 6.3. Market Analysis, Insights and Forecast - by Size of Enterprise
- 6.3.1. Small and Medium Enterprises
- 6.3.2. Large Enterprises
- 6.4. Market Analysis, Insights and Forecast - by End User Industry
- 6.4.1. IT and Telecom
- 6.4.2. BFSI
- 6.4.3. Healthcare
- 6.4.4. Retail
- 6.4.5. Manufacturing
- 6.4.6. Other End User Industries
- 6.1. Market Analysis, Insights and Forecast - by Deployment
- 7. Europe IT Robotic Automation Industry Analysis, Insights and Forecast, 2019-2031
- 7.1. Market Analysis, Insights and Forecast - by Deployment
- 7.1.1. On-premise
- 7.1.2. Cloud
- 7.2. Market Analysis, Insights and Forecast - by Solution
- 7.2.1. Software
- 7.2.2. Service
- 7.3. Market Analysis, Insights and Forecast - by Size of Enterprise
- 7.3.1. Small and Medium Enterprises
- 7.3.2. Large Enterprises
- 7.4. Market Analysis, Insights and Forecast - by End User Industry
- 7.4.1. IT and Telecom
- 7.4.2. BFSI
- 7.4.3. Healthcare
- 7.4.4. Retail
- 7.4.5. Manufacturing
- 7.4.6. Other End User Industries
- 7.1. Market Analysis, Insights and Forecast - by Deployment
- 8. Asia Pacific IT Robotic Automation Industry Analysis, Insights and Forecast, 2019-2031
- 8.1. Market Analysis, Insights and Forecast - by Deployment
- 8.1.1. On-premise
- 8.1.2. Cloud
- 8.2. Market Analysis, Insights and Forecast - by Solution
- 8.2.1. Software
- 8.2.2. Service
- 8.3. Market Analysis, Insights and Forecast - by Size of Enterprise
- 8.3.1. Small and Medium Enterprises
- 8.3.2. Large Enterprises
- 8.4. Market Analysis, Insights and Forecast - by End User Industry
- 8.4.1. IT and Telecom
- 8.4.2. BFSI
- 8.4.3. Healthcare
- 8.4.4. Retail
- 8.4.5. Manufacturing
- 8.4.6. Other End User Industries
- 8.1. Market Analysis, Insights and Forecast - by Deployment
- 9. Latin America IT Robotic Automation Industry Analysis, Insights and Forecast, 2019-2031
- 9.1. Market Analysis, Insights and Forecast - by Deployment
- 9.1.1. On-premise
- 9.1.2. Cloud
- 9.2. Market Analysis, Insights and Forecast - by Solution
- 9.2.1. Software
- 9.2.2. Service
- 9.3. Market Analysis, Insights and Forecast - by Size of Enterprise
- 9.3.1. Small and Medium Enterprises
- 9.3.2. Large Enterprises
- 9.4. Market Analysis, Insights and Forecast - by End User Industry
- 9.4.1. IT and Telecom
- 9.4.2. BFSI
- 9.4.3. Healthcare
- 9.4.4. Retail
- 9.4.5. Manufacturing
- 9.4.6. Other End User Industries
- 9.1. Market Analysis, Insights and Forecast - by Deployment
- 10. Middle East and Africa IT Robotic Automation Industry Analysis, Insights and Forecast, 2019-2031
- 10.1. Market Analysis, Insights and Forecast - by Deployment
- 10.1.1. On-premise
- 10.1.2. Cloud
- 10.2. Market Analysis, Insights and Forecast - by Solution
- 10.2.1. Software
- 10.2.2. Service
- 10.3. Market Analysis, Insights and Forecast - by Size of Enterprise
- 10.3.1. Small and Medium Enterprises
- 10.3.2. Large Enterprises
- 10.4. Market Analysis, Insights and Forecast - by End User Industry
- 10.4.1. IT and Telecom
- 10.4.2. BFSI
- 10.4.3. Healthcare
- 10.4.4. Retail
- 10.4.5. Manufacturing
- 10.4.6. Other End User Industries
- 10.1. Market Analysis, Insights and Forecast - by Deployment
- 11. North America IT Robotic Automation Industry Analysis, Insights and Forecast, 2019-2031
- 11.1. Market Analysis, Insights and Forecast - By Country/Sub-region
- 11.1.1 United States
- 11.1.2 Canada
- 11.1.3 Mexico
- 12. Europe IT Robotic Automation Industry Analysis, Insights and Forecast, 2019-2031
- 12.1. Market Analysis, Insights and Forecast - By Country/Sub-region
- 12.1.1 Germany
- 12.1.2 United Kingdom
- 12.1.3 France
- 12.1.4 Spain
- 12.1.5 Italy
- 12.1.6 Spain
- 12.1.7 Belgium
- 12.1.8 Netherland
- 12.1.9 Nordics
- 12.1.10 Rest of Europe
- 13. Asia Pacific IT Robotic Automation Industry Analysis, Insights and Forecast, 2019-2031
- 13.1. Market Analysis, Insights and Forecast - By Country/Sub-region
- 13.1.1 China
- 13.1.2 Japan
- 13.1.3 India
- 13.1.4 South Korea
- 13.1.5 Southeast Asia
- 13.1.6 Australia
- 13.1.7 Indonesia
- 13.1.8 Phillipes
- 13.1.9 Singapore
- 13.1.10 Thailandc
- 13.1.11 Rest of Asia Pacific
- 14. South America IT Robotic Automation Industry Analysis, Insights and Forecast, 2019-2031
- 14.1. Market Analysis, Insights and Forecast - By Country/Sub-region
- 14.1.1 Brazil
- 14.1.2 Argentina
- 14.1.3 Peru
- 14.1.4 Chile
- 14.1.5 Colombia
- 14.1.6 Ecuador
- 14.1.7 Venezuela
- 14.1.8 Rest of South America
- 15. North America IT Robotic Automation Industry Analysis, Insights and Forecast, 2019-2031
- 15.1. Market Analysis, Insights and Forecast - By Country/Sub-region
- 15.1.1 United States
- 15.1.2 Canada
- 15.1.3 Mexico
- 16. MEA IT Robotic Automation Industry Analysis, Insights and Forecast, 2019-2031
- 16.1. Market Analysis, Insights and Forecast - By Country/Sub-region
- 16.1.1 United Arab Emirates
- 16.1.2 Saudi Arabia
- 16.1.3 South Africa
- 16.1.4 Rest of Middle East and Africa
- 17. Competitive Analysis
- 17.1. Global Market Share Analysis 2024
- 17.2. Company Profiles
- 17.2.1 Jacada Inc
- 17.2.1.1. Overview
- 17.2.1.2. Products
- 17.2.1.3. SWOT Analysis
- 17.2.1.4. Recent Developments
- 17.2.1.5. Financials (Based on Availability)
- 17.2.2 Nice Robotic Automation Ltd
- 17.2.2.1. Overview
- 17.2.2.2. Products
- 17.2.2.3. SWOT Analysis
- 17.2.2.4. Recent Developments
- 17.2.2.5. Financials (Based on Availability)
- 17.2.3 Kofax Inc (Thoma Bravo LLC)
- 17.2.3.1. Overview
- 17.2.3.2. Products
- 17.2.3.3. SWOT Analysis
- 17.2.3.4. Recent Developments
- 17.2.3.5. Financials (Based on Availability)
- 17.2.4 HelpSystems LLC (HGGC)
- 17.2.4.1. Overview
- 17.2.4.2. Products
- 17.2.4.3. SWOT Analysis
- 17.2.4.4. Recent Developments
- 17.2.4.5. Financials (Based on Availability)
- 17.2.5 Jidoka
- 17.2.5.1. Overview
- 17.2.5.2. Products
- 17.2.5.3. SWOT Analysis
- 17.2.5.4. Recent Developments
- 17.2.5.5. Financials (Based on Availability)
- 17.2.6 UIPath Inc
- 17.2.6.1. Overview
- 17.2.6.2. Products
- 17.2.6.3. SWOT Analysis
- 17.2.6.4. Recent Developments
- 17.2.6.5. Financials (Based on Availability)
- 17.2.7 Datamatics Global Services Limited
- 17.2.7.1. Overview
- 17.2.7.2. Products
- 17.2.7.3. SWOT Analysis
- 17.2.7.4. Recent Developments
- 17.2.7.5. Financials (Based on Availability)
- 17.2.8 Automation Anywhere Inc
- 17.2.8.1. Overview
- 17.2.8.2. Products
- 17.2.8.3. SWOT Analysis
- 17.2.8.4. Recent Developments
- 17.2.8.5. Financials (Based on Availability)
- 17.2.9 Be Informed BV (Hoogenberg Beheer BV)
- 17.2.9.1. Overview
- 17.2.9.2. Products
- 17.2.9.3. SWOT Analysis
- 17.2.9.4. Recent Developments
- 17.2.9.5. Financials (Based on Availability)
- 17.2.10 Pegasystems Inc
- 17.2.10.1. Overview
- 17.2.10.2. Products
- 17.2.10.3. SWOT Analysis
- 17.2.10.4. Recent Developments
- 17.2.10.5. Financials (Based on Availability)
- 17.2.11 AutomationEdge Technologies Inc
- 17.2.11.1. Overview
- 17.2.11.2. Products
- 17.2.11.3. SWOT Analysis
- 17.2.11.4. Recent Developments
- 17.2.11.5. Financials (Based on Availability)
- 17.2.12 Blue Prism Group PLC
- 17.2.12.1. Overview
- 17.2.12.2. Products
- 17.2.12.3. SWOT Analysis
- 17.2.12.4. Recent Developments
- 17.2.12.5. Financials (Based on Availability)
- 17.2.13 CGI Inc
- 17.2.13.1. Overview
- 17.2.13.2. Products
- 17.2.13.3. SWOT Analysis
- 17.2.13.4. Recent Developments
- 17.2.13.5. Financials (Based on Availability)
- 17.2.1 Jacada Inc
List of Figures
- Figure 1: Global IT Robotic Automation Industry Revenue Breakdown (Million, %) by Region 2024 & 2032
- Figure 2: Global IT Robotic Automation Industry Volume Breakdown (K Unit, %) by Region 2024 & 2032
- Figure 3: North America IT Robotic Automation Industry Revenue (Million), by Country 2024 & 2032
- Figure 4: North America IT Robotic Automation Industry Volume (K Unit), by Country 2024 & 2032
- Figure 5: North America IT Robotic Automation Industry Revenue Share (%), by Country 2024 & 2032
- Figure 6: North America IT Robotic Automation Industry Volume Share (%), by Country 2024 & 2032
- Figure 7: Europe IT Robotic Automation Industry Revenue (Million), by Country 2024 & 2032
- Figure 8: Europe IT Robotic Automation Industry Volume (K Unit), by Country 2024 & 2032
- Figure 9: Europe IT Robotic Automation Industry Revenue Share (%), by Country 2024 & 2032
- Figure 10: Europe IT Robotic Automation Industry Volume Share (%), by Country 2024 & 2032
- Figure 11: Asia Pacific IT Robotic Automation Industry Revenue (Million), by Country 2024 & 2032
- Figure 12: Asia Pacific IT Robotic Automation Industry Volume (K Unit), by Country 2024 & 2032
- Figure 13: Asia Pacific IT Robotic Automation Industry Revenue Share (%), by Country 2024 & 2032
- Figure 14: Asia Pacific IT Robotic Automation Industry Volume Share (%), by Country 2024 & 2032
- Figure 15: South America IT Robotic Automation Industry Revenue (Million), by Country 2024 & 2032
- Figure 16: South America IT Robotic Automation Industry Volume (K Unit), by Country 2024 & 2032
- Figure 17: South America IT Robotic Automation Industry Revenue Share (%), by Country 2024 & 2032
- Figure 18: South America IT Robotic Automation Industry Volume Share (%), by Country 2024 & 2032
- Figure 19: North America IT Robotic Automation Industry Revenue (Million), by Country 2024 & 2032
- Figure 20: North America IT Robotic Automation Industry Volume (K Unit), by Country 2024 & 2032
- Figure 21: North America IT Robotic Automation Industry Revenue Share (%), by Country 2024 & 2032
- Figure 22: North America IT Robotic Automation Industry Volume Share (%), by Country 2024 & 2032
- Figure 23: MEA IT Robotic Automation Industry Revenue (Million), by Country 2024 & 2032
- Figure 24: MEA IT Robotic Automation Industry Volume (K Unit), by Country 2024 & 2032
- Figure 25: MEA IT Robotic Automation Industry Revenue Share (%), by Country 2024 & 2032
- Figure 26: MEA IT Robotic Automation Industry Volume Share (%), by Country 2024 & 2032
- Figure 27: North America IT Robotic Automation Industry Revenue (Million), by Deployment 2024 & 2032
- Figure 28: North America IT Robotic Automation Industry Volume (K Unit), by Deployment 2024 & 2032
- Figure 29: North America IT Robotic Automation Industry Revenue Share (%), by Deployment 2024 & 2032
- Figure 30: North America IT Robotic Automation Industry Volume Share (%), by Deployment 2024 & 2032
- Figure 31: North America IT Robotic Automation Industry Revenue (Million), by Solution 2024 & 2032
- Figure 32: North America IT Robotic Automation Industry Volume (K Unit), by Solution 2024 & 2032
- Figure 33: North America IT Robotic Automation Industry Revenue Share (%), by Solution 2024 & 2032
- Figure 34: North America IT Robotic Automation Industry Volume Share (%), by Solution 2024 & 2032
- Figure 35: North America IT Robotic Automation Industry Revenue (Million), by Size of Enterprise 2024 & 2032
- Figure 36: North America IT Robotic Automation Industry Volume (K Unit), by Size of Enterprise 2024 & 2032
- Figure 37: North America IT Robotic Automation Industry Revenue Share (%), by Size of Enterprise 2024 & 2032
- Figure 38: North America IT Robotic Automation Industry Volume Share (%), by Size of Enterprise 2024 & 2032
- Figure 39: North America IT Robotic Automation Industry Revenue (Million), by End User Industry 2024 & 2032
- Figure 40: North America IT Robotic Automation Industry Volume (K Unit), by End User Industry 2024 & 2032
- Figure 41: North America IT Robotic Automation Industry Revenue Share (%), by End User Industry 2024 & 2032
- Figure 42: North America IT Robotic Automation Industry Volume Share (%), by End User Industry 2024 & 2032
- Figure 43: North America IT Robotic Automation Industry Revenue (Million), by Country 2024 & 2032
- Figure 44: North America IT Robotic Automation Industry Volume (K Unit), by Country 2024 & 2032
- Figure 45: North America IT Robotic Automation Industry Revenue Share (%), by Country 2024 & 2032
- Figure 46: North America IT Robotic Automation Industry Volume Share (%), by Country 2024 & 2032
- Figure 47: Europe IT Robotic Automation Industry Revenue (Million), by Deployment 2024 & 2032
- Figure 48: Europe IT Robotic Automation Industry Volume (K Unit), by Deployment 2024 & 2032
- Figure 49: Europe IT Robotic Automation Industry Revenue Share (%), by Deployment 2024 & 2032
- Figure 50: Europe IT Robotic Automation Industry Volume Share (%), by Deployment 2024 & 2032
- Figure 51: Europe IT Robotic Automation Industry Revenue (Million), by Solution 2024 & 2032
- Figure 52: Europe IT Robotic Automation Industry Volume (K Unit), by Solution 2024 & 2032
- Figure 53: Europe IT Robotic Automation Industry Revenue Share (%), by Solution 2024 & 2032
- Figure 54: Europe IT Robotic Automation Industry Volume Share (%), by Solution 2024 & 2032
- Figure 55: Europe IT Robotic Automation Industry Revenue (Million), by Size of Enterprise 2024 & 2032
- Figure 56: Europe IT Robotic Automation Industry Volume (K Unit), by Size of Enterprise 2024 & 2032
- Figure 57: Europe IT Robotic Automation Industry Revenue Share (%), by Size of Enterprise 2024 & 2032
- Figure 58: Europe IT Robotic Automation Industry Volume Share (%), by Size of Enterprise 2024 & 2032
- Figure 59: Europe IT Robotic Automation Industry Revenue (Million), by End User Industry 2024 & 2032
- Figure 60: Europe IT Robotic Automation Industry Volume (K Unit), by End User Industry 2024 & 2032
- Figure 61: Europe IT Robotic Automation Industry Revenue Share (%), by End User Industry 2024 & 2032
- Figure 62: Europe IT Robotic Automation Industry Volume Share (%), by End User Industry 2024 & 2032
- Figure 63: Europe IT Robotic Automation Industry Revenue (Million), by Country 2024 & 2032
- Figure 64: Europe IT Robotic Automation Industry Volume (K Unit), by Country 2024 & 2032
- Figure 65: Europe IT Robotic Automation Industry Revenue Share (%), by Country 2024 & 2032
- Figure 66: Europe IT Robotic Automation Industry Volume Share (%), by Country 2024 & 2032
- Figure 67: Asia Pacific IT Robotic Automation Industry Revenue (Million), by Deployment 2024 & 2032
- Figure 68: Asia Pacific IT Robotic Automation Industry Volume (K Unit), by Deployment 2024 & 2032
- Figure 69: Asia Pacific IT Robotic Automation Industry Revenue Share (%), by Deployment 2024 & 2032
- Figure 70: Asia Pacific IT Robotic Automation Industry Volume Share (%), by Deployment 2024 & 2032
- Figure 71: Asia Pacific IT Robotic Automation Industry Revenue (Million), by Solution 2024 & 2032
- Figure 72: Asia Pacific IT Robotic Automation Industry Volume (K Unit), by Solution 2024 & 2032
- Figure 73: Asia Pacific IT Robotic Automation Industry Revenue Share (%), by Solution 2024 & 2032
- Figure 74: Asia Pacific IT Robotic Automation Industry Volume Share (%), by Solution 2024 & 2032
- Figure 75: Asia Pacific IT Robotic Automation Industry Revenue (Million), by Size of Enterprise 2024 & 2032
- Figure 76: Asia Pacific IT Robotic Automation Industry Volume (K Unit), by Size of Enterprise 2024 & 2032
- Figure 77: Asia Pacific IT Robotic Automation Industry Revenue Share (%), by Size of Enterprise 2024 & 2032
- Figure 78: Asia Pacific IT Robotic Automation Industry Volume Share (%), by Size of Enterprise 2024 & 2032
- Figure 79: Asia Pacific IT Robotic Automation Industry Revenue (Million), by End User Industry 2024 & 2032
- Figure 80: Asia Pacific IT Robotic Automation Industry Volume (K Unit), by End User Industry 2024 & 2032
- Figure 81: Asia Pacific IT Robotic Automation Industry Revenue Share (%), by End User Industry 2024 & 2032
- Figure 82: Asia Pacific IT Robotic Automation Industry Volume Share (%), by End User Industry 2024 & 2032
- Figure 83: Asia Pacific IT Robotic Automation Industry Revenue (Million), by Country 2024 & 2032
- Figure 84: Asia Pacific IT Robotic Automation Industry Volume (K Unit), by Country 2024 & 2032
- Figure 85: Asia Pacific IT Robotic Automation Industry Revenue Share (%), by Country 2024 & 2032
- Figure 86: Asia Pacific IT Robotic Automation Industry Volume Share (%), by Country 2024 & 2032
- Figure 87: Latin America IT Robotic Automation Industry Revenue (Million), by Deployment 2024 & 2032
- Figure 88: Latin America IT Robotic Automation Industry Volume (K Unit), by Deployment 2024 & 2032
- Figure 89: Latin America IT Robotic Automation Industry Revenue Share (%), by Deployment 2024 & 2032
- Figure 90: Latin America IT Robotic Automation Industry Volume Share (%), by Deployment 2024 & 2032
- Figure 91: Latin America IT Robotic Automation Industry Revenue (Million), by Solution 2024 & 2032
- Figure 92: Latin America IT Robotic Automation Industry Volume (K Unit), by Solution 2024 & 2032
- Figure 93: Latin America IT Robotic Automation Industry Revenue Share (%), by Solution 2024 & 2032
- Figure 94: Latin America IT Robotic Automation Industry Volume Share (%), by Solution 2024 & 2032
- Figure 95: Latin America IT Robotic Automation Industry Revenue (Million), by Size of Enterprise 2024 & 2032
- Figure 96: Latin America IT Robotic Automation Industry Volume (K Unit), by Size of Enterprise 2024 & 2032
- Figure 97: Latin America IT Robotic Automation Industry Revenue Share (%), by Size of Enterprise 2024 & 2032
- Figure 98: Latin America IT Robotic Automation Industry Volume Share (%), by Size of Enterprise 2024 & 2032
- Figure 99: Latin America IT Robotic Automation Industry Revenue (Million), by End User Industry 2024 & 2032
- Figure 100: Latin America IT Robotic Automation Industry Volume (K Unit), by End User Industry 2024 & 2032
- Figure 101: Latin America IT Robotic Automation Industry Revenue Share (%), by End User Industry 2024 & 2032
- Figure 102: Latin America IT Robotic Automation Industry Volume Share (%), by End User Industry 2024 & 2032
- Figure 103: Latin America IT Robotic Automation Industry Revenue (Million), by Country 2024 & 2032
- Figure 104: Latin America IT Robotic Automation Industry Volume (K Unit), by Country 2024 & 2032
- Figure 105: Latin America IT Robotic Automation Industry Revenue Share (%), by Country 2024 & 2032
- Figure 106: Latin America IT Robotic Automation Industry Volume Share (%), by Country 2024 & 2032
- Figure 107: Middle East and Africa IT Robotic Automation Industry Revenue (Million), by Deployment 2024 & 2032
- Figure 108: Middle East and Africa IT Robotic Automation Industry Volume (K Unit), by Deployment 2024 & 2032
- Figure 109: Middle East and Africa IT Robotic Automation Industry Revenue Share (%), by Deployment 2024 & 2032
- Figure 110: Middle East and Africa IT Robotic Automation Industry Volume Share (%), by Deployment 2024 & 2032
- Figure 111: Middle East and Africa IT Robotic Automation Industry Revenue (Million), by Solution 2024 & 2032
- Figure 112: Middle East and Africa IT Robotic Automation Industry Volume (K Unit), by Solution 2024 & 2032
- Figure 113: Middle East and Africa IT Robotic Automation Industry Revenue Share (%), by Solution 2024 & 2032
- Figure 114: Middle East and Africa IT Robotic Automation Industry Volume Share (%), by Solution 2024 & 2032
- Figure 115: Middle East and Africa IT Robotic Automation Industry Revenue (Million), by Size of Enterprise 2024 & 2032
- Figure 116: Middle East and Africa IT Robotic Automation Industry Volume (K Unit), by Size of Enterprise 2024 & 2032
- Figure 117: Middle East and Africa IT Robotic Automation Industry Revenue Share (%), by Size of Enterprise 2024 & 2032
- Figure 118: Middle East and Africa IT Robotic Automation Industry Volume Share (%), by Size of Enterprise 2024 & 2032
- Figure 119: Middle East and Africa IT Robotic Automation Industry Revenue (Million), by End User Industry 2024 & 2032
- Figure 120: Middle East and Africa IT Robotic Automation Industry Volume (K Unit), by End User Industry 2024 & 2032
- Figure 121: Middle East and Africa IT Robotic Automation Industry Revenue Share (%), by End User Industry 2024 & 2032
- Figure 122: Middle East and Africa IT Robotic Automation Industry Volume Share (%), by End User Industry 2024 & 2032
- Figure 123: Middle East and Africa IT Robotic Automation Industry Revenue (Million), by Country 2024 & 2032
- Figure 124: Middle East and Africa IT Robotic Automation Industry Volume (K Unit), by Country 2024 & 2032
- Figure 125: Middle East and Africa IT Robotic Automation Industry Revenue Share (%), by Country 2024 & 2032
- Figure 126: Middle East and Africa IT Robotic Automation Industry Volume Share (%), by Country 2024 & 2032
List of Tables
- Table 1: Global IT Robotic Automation Industry Revenue Million Forecast, by Region 2019 & 2032
- Table 2: Global IT Robotic Automation Industry Volume K Unit Forecast, by Region 2019 & 2032
- Table 3: Global IT Robotic Automation Industry Revenue Million Forecast, by Deployment 2019 & 2032
- Table 4: Global IT Robotic Automation Industry Volume K Unit Forecast, by Deployment 2019 & 2032
- Table 5: Global IT Robotic Automation Industry Revenue Million Forecast, by Solution 2019 & 2032
- Table 6: Global IT Robotic Automation Industry Volume K Unit Forecast, by Solution 2019 & 2032
- Table 7: Global IT Robotic Automation Industry Revenue Million Forecast, by Size of Enterprise 2019 & 2032
- Table 8: Global IT Robotic Automation Industry Volume K Unit Forecast, by Size of Enterprise 2019 & 2032
- Table 9: Global IT Robotic Automation Industry Revenue Million Forecast, by End User Industry 2019 & 2032
- Table 10: Global IT Robotic Automation Industry Volume K Unit Forecast, by End User Industry 2019 & 2032
- Table 11: Global IT Robotic Automation Industry Revenue Million Forecast, by Region 2019 & 2032
- Table 12: Global IT Robotic Automation Industry Volume K Unit Forecast, by Region 2019 & 2032
- Table 13: Global IT Robotic Automation Industry Revenue Million Forecast, by Country 2019 & 2032
- Table 14: Global IT Robotic Automation Industry Volume K Unit Forecast, by Country 2019 & 2032
- Table 15: United States IT Robotic Automation Industry Revenue (Million) Forecast, by Application 2019 & 2032
- Table 16: United States IT Robotic Automation Industry Volume (K Unit) Forecast, by Application 2019 & 2032
- Table 17: Canada IT Robotic Automation Industry Revenue (Million) Forecast, by Application 2019 & 2032
- Table 18: Canada IT Robotic Automation Industry Volume (K Unit) Forecast, by Application 2019 & 2032
- Table 19: Mexico IT Robotic Automation Industry Revenue (Million) Forecast, by Application 2019 & 2032
- Table 20: Mexico IT Robotic Automation Industry Volume (K Unit) Forecast, by Application 2019 & 2032
- Table 21: Global IT Robotic Automation Industry Revenue Million Forecast, by Country 2019 & 2032
- Table 22: Global IT Robotic Automation Industry Volume K Unit Forecast, by Country 2019 & 2032
- Table 23: Germany IT Robotic Automation Industry Revenue (Million) Forecast, by Application 2019 & 2032
- Table 24: Germany IT Robotic Automation Industry Volume (K Unit) Forecast, by Application 2019 & 2032
- Table 25: United Kingdom IT Robotic Automation Industry Revenue (Million) Forecast, by Application 2019 & 2032
- Table 26: United Kingdom IT Robotic Automation Industry Volume (K Unit) Forecast, by Application 2019 & 2032
- Table 27: France IT Robotic Automation Industry Revenue (Million) Forecast, by Application 2019 & 2032
- Table 28: France IT Robotic Automation Industry Volume (K Unit) Forecast, by Application 2019 & 2032
- Table 29: Spain IT Robotic Automation Industry Revenue (Million) Forecast, by Application 2019 & 2032
- Table 30: Spain IT Robotic Automation Industry Volume (K Unit) Forecast, by Application 2019 & 2032
- Table 31: Italy IT Robotic Automation Industry Revenue (Million) Forecast, by Application 2019 & 2032
- Table 32: Italy IT Robotic Automation Industry Volume (K Unit) Forecast, by Application 2019 & 2032
- Table 33: Spain IT Robotic Automation Industry Revenue (Million) Forecast, by Application 2019 & 2032
- Table 34: Spain IT Robotic Automation Industry Volume (K Unit) Forecast, by Application 2019 & 2032
- Table 35: Belgium IT Robotic Automation Industry Revenue (Million) Forecast, by Application 2019 & 2032
- Table 36: Belgium IT Robotic Automation Industry Volume (K Unit) Forecast, by Application 2019 & 2032
- Table 37: Netherland IT Robotic Automation Industry Revenue (Million) Forecast, by Application 2019 & 2032
- Table 38: Netherland IT Robotic Automation Industry Volume (K Unit) Forecast, by Application 2019 & 2032
- Table 39: Nordics IT Robotic Automation Industry Revenue (Million) Forecast, by Application 2019 & 2032
- Table 40: Nordics IT Robotic Automation Industry Volume (K Unit) Forecast, by Application 2019 & 2032
- Table 41: Rest of Europe IT Robotic Automation Industry Revenue (Million) Forecast, by Application 2019 & 2032
- Table 42: Rest of Europe IT Robotic Automation Industry Volume (K Unit) Forecast, by Application 2019 & 2032
- Table 43: Global IT Robotic Automation Industry Revenue Million Forecast, by Country 2019 & 2032
- Table 44: Global IT Robotic Automation Industry Volume K Unit Forecast, by Country 2019 & 2032
- Table 45: China IT Robotic Automation Industry Revenue (Million) Forecast, by Application 2019 & 2032
- Table 46: China IT Robotic Automation Industry Volume (K Unit) Forecast, by Application 2019 & 2032
- Table 47: Japan IT Robotic Automation Industry Revenue (Million) Forecast, by Application 2019 & 2032
- Table 48: Japan IT Robotic Automation Industry Volume (K Unit) Forecast, by Application 2019 & 2032
- Table 49: India IT Robotic Automation Industry Revenue (Million) Forecast, by Application 2019 & 2032
- Table 50: India IT Robotic Automation Industry Volume (K Unit) Forecast, by Application 2019 & 2032
- Table 51: South Korea IT Robotic Automation Industry Revenue (Million) Forecast, by Application 2019 & 2032
- Table 52: South Korea IT Robotic Automation Industry Volume (K Unit) Forecast, by Application 2019 & 2032
- Table 53: Southeast Asia IT Robotic Automation Industry Revenue (Million) Forecast, by Application 2019 & 2032
- Table 54: Southeast Asia IT Robotic Automation Industry Volume (K Unit) Forecast, by Application 2019 & 2032
- Table 55: Australia IT Robotic Automation Industry Revenue (Million) Forecast, by Application 2019 & 2032
- Table 56: Australia IT Robotic Automation Industry Volume (K Unit) Forecast, by Application 2019 & 2032
- Table 57: Indonesia IT Robotic Automation Industry Revenue (Million) Forecast, by Application 2019 & 2032
- Table 58: Indonesia IT Robotic Automation Industry Volume (K Unit) Forecast, by Application 2019 & 2032
- Table 59: Phillipes IT Robotic Automation Industry Revenue (Million) Forecast, by Application 2019 & 2032
- Table 60: Phillipes IT Robotic Automation Industry Volume (K Unit) Forecast, by Application 2019 & 2032
- Table 61: Singapore IT Robotic Automation Industry Revenue (Million) Forecast, by Application 2019 & 2032
- Table 62: Singapore IT Robotic Automation Industry Volume (K Unit) Forecast, by Application 2019 & 2032
- Table 63: Thailandc IT Robotic Automation Industry Revenue (Million) Forecast, by Application 2019 & 2032
- Table 64: Thailandc IT Robotic Automation Industry Volume (K Unit) Forecast, by Application 2019 & 2032
- Table 65: Rest of Asia Pacific IT Robotic Automation Industry Revenue (Million) Forecast, by Application 2019 & 2032
- Table 66: Rest of Asia Pacific IT Robotic Automation Industry Volume (K Unit) Forecast, by Application 2019 & 2032
- Table 67: Global IT Robotic Automation Industry Revenue Million Forecast, by Country 2019 & 2032
- Table 68: Global IT Robotic Automation Industry Volume K Unit Forecast, by Country 2019 & 2032
- Table 69: Brazil IT Robotic Automation Industry Revenue (Million) Forecast, by Application 2019 & 2032
- Table 70: Brazil IT Robotic Automation Industry Volume (K Unit) Forecast, by Application 2019 & 2032
- Table 71: Argentina IT Robotic Automation Industry Revenue (Million) Forecast, by Application 2019 & 2032
- Table 72: Argentina IT Robotic Automation Industry Volume (K Unit) Forecast, by Application 2019 & 2032
- Table 73: Peru IT Robotic Automation Industry Revenue (Million) Forecast, by Application 2019 & 2032
- Table 74: Peru IT Robotic Automation Industry Volume (K Unit) Forecast, by Application 2019 & 2032
- Table 75: Chile IT Robotic Automation Industry Revenue (Million) Forecast, by Application 2019 & 2032
- Table 76: Chile IT Robotic Automation Industry Volume (K Unit) Forecast, by Application 2019 & 2032
- Table 77: Colombia IT Robotic Automation Industry Revenue (Million) Forecast, by Application 2019 & 2032
- Table 78: Colombia IT Robotic Automation Industry Volume (K Unit) Forecast, by Application 2019 & 2032
- Table 79: Ecuador IT Robotic Automation Industry Revenue (Million) Forecast, by Application 2019 & 2032
- Table 80: Ecuador IT Robotic Automation Industry Volume (K Unit) Forecast, by Application 2019 & 2032
- Table 81: Venezuela IT Robotic Automation Industry Revenue (Million) Forecast, by Application 2019 & 2032
- Table 82: Venezuela IT Robotic Automation Industry Volume (K Unit) Forecast, by Application 2019 & 2032
- Table 83: Rest of South America IT Robotic Automation Industry Revenue (Million) Forecast, by Application 2019 & 2032
- Table 84: Rest of South America IT Robotic Automation Industry Volume (K Unit) Forecast, by Application 2019 & 2032
- Table 85: Global IT Robotic Automation Industry Revenue Million Forecast, by Country 2019 & 2032
- Table 86: Global IT Robotic Automation Industry Volume K Unit Forecast, by Country 2019 & 2032
- Table 87: United States IT Robotic Automation Industry Revenue (Million) Forecast, by Application 2019 & 2032
- Table 88: United States IT Robotic Automation Industry Volume (K Unit) Forecast, by Application 2019 & 2032
- Table 89: Canada IT Robotic Automation Industry Revenue (Million) Forecast, by Application 2019 & 2032
- Table 90: Canada IT Robotic Automation Industry Volume (K Unit) Forecast, by Application 2019 & 2032
- Table 91: Mexico IT Robotic Automation Industry Revenue (Million) Forecast, by Application 2019 & 2032
- Table 92: Mexico IT Robotic Automation Industry Volume (K Unit) Forecast, by Application 2019 & 2032
- Table 93: Global IT Robotic Automation Industry Revenue Million Forecast, by Country 2019 & 2032
- Table 94: Global IT Robotic Automation Industry Volume K Unit Forecast, by Country 2019 & 2032
- Table 95: United Arab Emirates IT Robotic Automation Industry Revenue (Million) Forecast, by Application 2019 & 2032
- Table 96: United Arab Emirates IT Robotic Automation Industry Volume (K Unit) Forecast, by Application 2019 & 2032
- Table 97: Saudi Arabia IT Robotic Automation Industry Revenue (Million) Forecast, by Application 2019 & 2032
- Table 98: Saudi Arabia IT Robotic Automation Industry Volume (K Unit) Forecast, by Application 2019 & 2032
- Table 99: South Africa IT Robotic Automation Industry Revenue (Million) Forecast, by Application 2019 & 2032
- Table 100: South Africa IT Robotic Automation Industry Volume (K Unit) Forecast, by Application 2019 & 2032
- Table 101: Rest of Middle East and Africa IT Robotic Automation Industry Revenue (Million) Forecast, by Application 2019 & 2032
- Table 102: Rest of Middle East and Africa IT Robotic Automation Industry Volume (K Unit) Forecast, by Application 2019 & 2032
- Table 103: Global IT Robotic Automation Industry Revenue Million Forecast, by Deployment 2019 & 2032
- Table 104: Global IT Robotic Automation Industry Volume K Unit Forecast, by Deployment 2019 & 2032
- Table 105: Global IT Robotic Automation Industry Revenue Million Forecast, by Solution 2019 & 2032
- Table 106: Global IT Robotic Automation Industry Volume K Unit Forecast, by Solution 2019 & 2032
- Table 107: Global IT Robotic Automation Industry Revenue Million Forecast, by Size of Enterprise 2019 & 2032
- Table 108: Global IT Robotic Automation Industry Volume K Unit Forecast, by Size of Enterprise 2019 & 2032
- Table 109: Global IT Robotic Automation Industry Revenue Million Forecast, by End User Industry 2019 & 2032
- Table 110: Global IT Robotic Automation Industry Volume K Unit Forecast, by End User Industry 2019 & 2032
- Table 111: Global IT Robotic Automation Industry Revenue Million Forecast, by Country 2019 & 2032
- Table 112: Global IT Robotic Automation Industry Volume K Unit Forecast, by Country 2019 & 2032
- Table 113: Global IT Robotic Automation Industry Revenue Million Forecast, by Deployment 2019 & 2032
- Table 114: Global IT Robotic Automation Industry Volume K Unit Forecast, by Deployment 2019 & 2032
- Table 115: Global IT Robotic Automation Industry Revenue Million Forecast, by Solution 2019 & 2032
- Table 116: Global IT Robotic Automation Industry Volume K Unit Forecast, by Solution 2019 & 2032
- Table 117: Global IT Robotic Automation Industry Revenue Million Forecast, by Size of Enterprise 2019 & 2032
- Table 118: Global IT Robotic Automation Industry Volume K Unit Forecast, by Size of Enterprise 2019 & 2032
- Table 119: Global IT Robotic Automation Industry Revenue Million Forecast, by End User Industry 2019 & 2032
- Table 120: Global IT Robotic Automation Industry Volume K Unit Forecast, by End User Industry 2019 & 2032
- Table 121: Global IT Robotic Automation Industry Revenue Million Forecast, by Country 2019 & 2032
- Table 122: Global IT Robotic Automation Industry Volume K Unit Forecast, by Country 2019 & 2032
- Table 123: Global IT Robotic Automation Industry Revenue Million Forecast, by Deployment 2019 & 2032
- Table 124: Global IT Robotic Automation Industry Volume K Unit Forecast, by Deployment 2019 & 2032
- Table 125: Global IT Robotic Automation Industry Revenue Million Forecast, by Solution 2019 & 2032
- Table 126: Global IT Robotic Automation Industry Volume K Unit Forecast, by Solution 2019 & 2032
- Table 127: Global IT Robotic Automation Industry Revenue Million Forecast, by Size of Enterprise 2019 & 2032
- Table 128: Global IT Robotic Automation Industry Volume K Unit Forecast, by Size of Enterprise 2019 & 2032
- Table 129: Global IT Robotic Automation Industry Revenue Million Forecast, by End User Industry 2019 & 2032
- Table 130: Global IT Robotic Automation Industry Volume K Unit Forecast, by End User Industry 2019 & 2032
- Table 131: Global IT Robotic Automation Industry Revenue Million Forecast, by Country 2019 & 2032
- Table 132: Global IT Robotic Automation Industry Volume K Unit Forecast, by Country 2019 & 2032
- Table 133: Global IT Robotic Automation Industry Revenue Million Forecast, by Deployment 2019 & 2032
- Table 134: Global IT Robotic Automation Industry Volume K Unit Forecast, by Deployment 2019 & 2032
- Table 135: Global IT Robotic Automation Industry Revenue Million Forecast, by Solution 2019 & 2032
- Table 136: Global IT Robotic Automation Industry Volume K Unit Forecast, by Solution 2019 & 2032
- Table 137: Global IT Robotic Automation Industry Revenue Million Forecast, by Size of Enterprise 2019 & 2032
- Table 138: Global IT Robotic Automation Industry Volume K Unit Forecast, by Size of Enterprise 2019 & 2032
- Table 139: Global IT Robotic Automation Industry Revenue Million Forecast, by End User Industry 2019 & 2032
- Table 140: Global IT Robotic Automation Industry Volume K Unit Forecast, by End User Industry 2019 & 2032
- Table 141: Global IT Robotic Automation Industry Revenue Million Forecast, by Country 2019 & 2032
- Table 142: Global IT Robotic Automation Industry Volume K Unit Forecast, by Country 2019 & 2032
- Table 143: Global IT Robotic Automation Industry Revenue Million Forecast, by Deployment 2019 & 2032
- Table 144: Global IT Robotic Automation Industry Volume K Unit Forecast, by Deployment 2019 & 2032
- Table 145: Global IT Robotic Automation Industry Revenue Million Forecast, by Solution 2019 & 2032
- Table 146: Global IT Robotic Automation Industry Volume K Unit Forecast, by Solution 2019 & 2032
- Table 147: Global IT Robotic Automation Industry Revenue Million Forecast, by Size of Enterprise 2019 & 2032
- Table 148: Global IT Robotic Automation Industry Volume K Unit Forecast, by Size of Enterprise 2019 & 2032
- Table 149: Global IT Robotic Automation Industry Revenue Million Forecast, by End User Industry 2019 & 2032
- Table 150: Global IT Robotic Automation Industry Volume K Unit Forecast, by End User Industry 2019 & 2032
- Table 151: Global IT Robotic Automation Industry Revenue Million Forecast, by Country 2019 & 2032
- Table 152: Global IT Robotic Automation Industry Volume K Unit Forecast, by Country 2019 & 2032
Frequently Asked Questions
1. What is the projected Compound Annual Growth Rate (CAGR) of the IT Robotic Automation Industry?
The projected CAGR is approximately 29.70%.
2. Which companies are prominent players in the IT Robotic Automation Industry?
Key companies in the market include Jacada Inc, Nice Robotic Automation Ltd, Kofax Inc (Thoma Bravo LLC), HelpSystems LLC (HGGC), Jidoka, UIPath Inc, Datamatics Global Services Limited, Automation Anywhere Inc, Be Informed BV (Hoogenberg Beheer BV), Pegasystems Inc, AutomationEdge Technologies Inc, Blue Prism Group PLC, CGI Inc.
3. What are the main segments of the IT Robotic Automation Industry?
The market segments include Deployment, Solution, Size of Enterprise, End User Industry.
4. Can you provide details about the market size?
The market size is estimated to be USD 4.02 Million as of 2022.
5. What are some drivers contributing to market growth?
Retail Sector to hold major share in RPA Market; Adoption of AI- and Cloud-based Solutions for Internal Efficiency among SMEs.
6. What are the notable trends driving market growth?
Retail Sector to hold major share in RPA Market.
7. Are there any restraints impacting market growth?
Data Security Concerns.
8. Can you provide examples of recent developments in the market?
September 2022 - UiPath, a leading enterprise automation software company, strengthened its partnership with Snowflake, the Data Cloud company, by launching a new bi-directional integration that extends the value of automation across the enterprise. UiPath and Snowflake enable joint customers to design and build workflows based on 360-degree views of trusted and accessible data on Snowflake's platform. By leveraging the Snowflake Data Cloud, UiPath robots can quickly connect data directly to business processes in the Data Cloud without using complex code, speeding up time to value.
9. What pricing options are available for accessing the report?
Pricing options include single-user, multi-user, and enterprise licenses priced at USD 4750, USD 5250, and USD 8750 respectively.
10. Is the market size provided in terms of value or volume?
The market size is provided in terms of value, measured in Million and volume, measured in K Unit.
11. Are there any specific market keywords associated with the report?
Yes, the market keyword associated with the report is "IT Robotic Automation Industry," which aids in identifying and referencing the specific market segment covered.
12. How do I determine which pricing option suits my needs best?
The pricing options vary based on user requirements and access needs. Individual users may opt for single-user licenses, while businesses requiring broader access may choose multi-user or enterprise licenses for cost-effective access to the report.
13. Are there any additional resources or data provided in the IT Robotic Automation Industry report?
While the report offers comprehensive insights, it's advisable to review the specific contents or supplementary materials provided to ascertain if additional resources or data are available.
14. How can I stay updated on further developments or reports in the IT Robotic Automation Industry?
To stay informed about further developments, trends, and reports in the IT Robotic Automation Industry, consider subscribing to industry newsletters, following relevant companies and organizations, or regularly checking reputable industry news sources and publications.
Methodology
Step 1 - Identification of Relevant Samples Size from Population Database


Step 2 - Approaches for Defining Global Market Size (Value, Volume* & Price*)

Note*: In applicable scenarios
Step 3 - Data Sources
Primary Research
- Web Analytics
- Survey Reports
- Research Institute
- Latest Research Reports
- Opinion Leaders
Secondary Research
- Annual Reports
- White Paper
- Latest Press Release
- Industry Association
- Paid Database
- Investor Presentations

Step 4 - Data Triangulation
Involves using different sources of information in order to increase the validity of a study
These sources are likely to be stakeholders in a program - participants, other researchers, program staff, other community members, and so on.
Then we put all data in single framework & apply various statistical tools to find out the dynamic on the market.
During the analysis stage, feedback from the stakeholder groups would be compared to determine areas of agreement as well as areas of divergence


