
Key Insights
The Lab Automation for In-Vitro Diagnostics (IVD) Market is poised for significant expansion, projected to reach a substantial valuation and grow at a healthy CAGR. This growth is primarily fueled by the increasing demand for faster, more accurate, and cost-effective diagnostic testing across a wide range of applications. Advancements in robotics, artificial intelligence, and integrated software solutions are transforming laboratory workflows, enabling higher throughput and reduced manual intervention. Key drivers include the rising prevalence of chronic diseases, the growing need for personalized medicine, and the escalating volume of diagnostic tests required globally. The push for operational efficiency within laboratories, coupled with a shortage of skilled laboratory personnel, further accelerates the adoption of automated solutions. Regulatory bodies are also increasingly emphasizing standardized and reliable diagnostic processes, which automated systems are well-equipped to deliver. This market expansion is a testament to the critical role lab automation plays in modern healthcare.
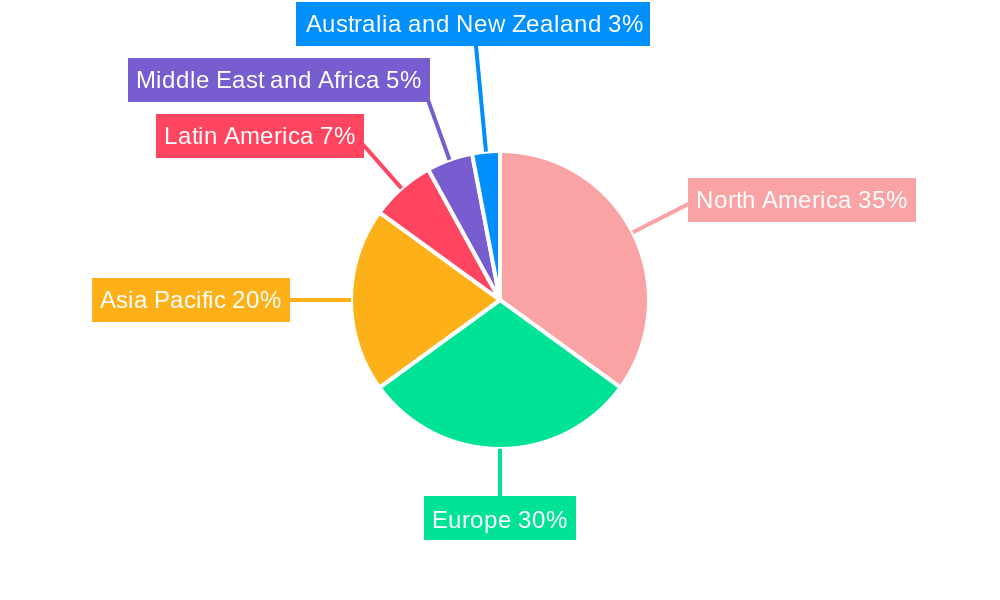
The market is segmented into essential equipment like Automated Plate Handlers, Automated Liquid Handlers, Robotic Arms, Automated Storage and Retrieval Systems, and Analyzers, catering to diverse end-users including academic institutions, diagnostic laboratories, and other healthcare facilities. Geographically, North America and Europe currently dominate the market due to robust healthcare infrastructure, high R&D spending, and early adoption of advanced technologies. However, the Asia Pacific region is expected to witness the fastest growth, driven by expanding healthcare access, increasing investments in diagnostic capabilities, and a growing number of clinical laboratories. Restraints, such as the high initial investment cost of automated systems and the need for skilled personnel to operate and maintain them, are being gradually overcome by advancements in user-friendly interfaces and the development of more scalable and affordable solutions. The continuous innovation by leading companies such as Becton Dickinson, Tecan Group, and Thermo Fisher Scientific will continue to shape the trajectory of this dynamic market.
This in-depth report provides a detailed examination of the global Lab Automation for In-Vitro Diagnostics Market, offering critical insights and actionable intelligence for industry stakeholders. The study encompasses a historical period from 2019 to 2024, with a base year of 2025 and a comprehensive forecast period extending to 2033. It analyzes market size, growth drivers, trends, segmentation, and the competitive landscape, empowering strategic decision-making for companies operating within this dynamic sector.
Lab Automation For In-Vitro Diagnostics Market Concentration & Innovation
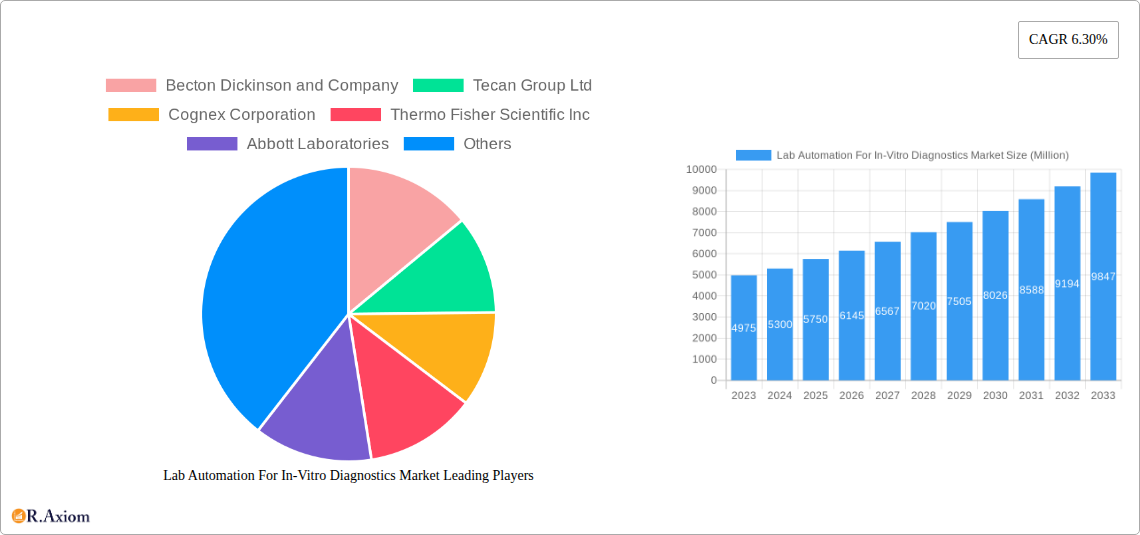
The Lab Automation for In-Vitro Diagnostics Market exhibits a moderate to high concentration, characterized by the presence of large, established players and a growing number of innovative, niche solution providers. Key companies like Becton Dickinson and Company, Tecan Group Ltd, Thermo Fisher Scientific Inc, Abbott Laboratories, Danaher Corporation, Siemens Healthineers AG, Agilent Technologies Inc, PerkinElmer Inc, and Roche Holding AG command significant market share, driven by their extensive product portfolios and global distribution networks. Innovation in this market is primarily fueled by the relentless pursuit of enhanced diagnostic accuracy, reduced turnaround times, improved laboratory efficiency, and the increasing need for precision medicine. Regulatory frameworks, such as those established by the FDA and EMA, play a crucial role in shaping innovation by setting stringent standards for device validation and performance. The threat of product substitutes is relatively low, given the specialized nature of in-vitro diagnostics and automation solutions. However, advancements in point-of-care testing and AI-driven diagnostic software present evolving competitive landscapes. End-user trends are leaning towards greater automation to address labor shortages, reduce human error, and improve throughput, particularly in high-volume clinical laboratories. Mergers and acquisitions (M&A) are a consistent feature, with deal values often in the hundreds of millions of dollars, as companies seek to acquire new technologies, expand their market reach, and consolidate their positions. For instance, significant M&A activities within the broader life sciences sector have seen companies like Danaher Corporation actively pursue strategic acquisitions to bolster their diagnostics and automation capabilities.
Lab Automation For In-Vitro Diagnostics Market Industry Trends & Insights
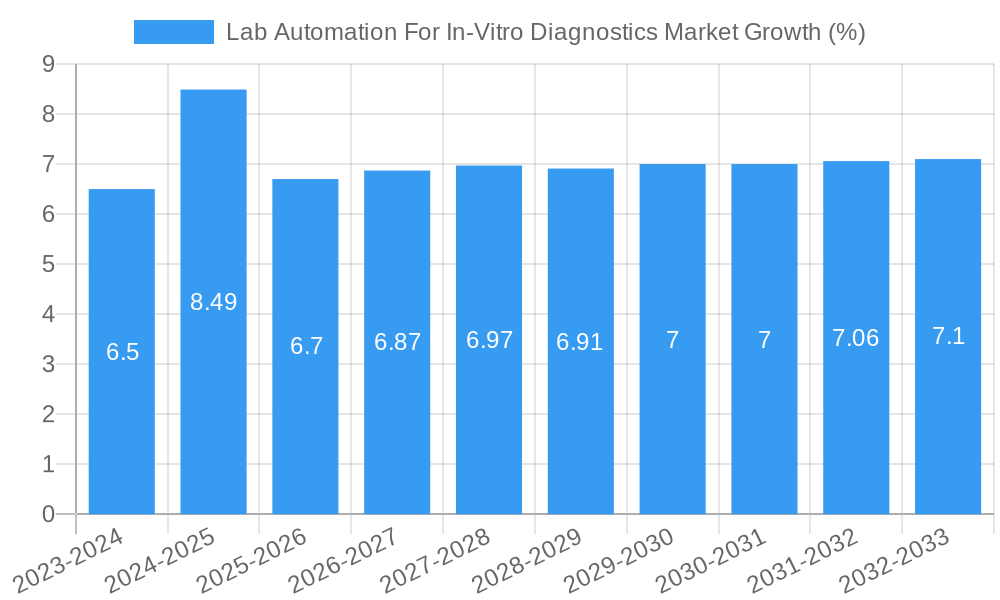
The Lab Automation for In-Vitro Diagnostics Market is poised for substantial growth, driven by a confluence of technological advancements, rising healthcare expenditure, and the escalating demand for accurate and rapid diagnostic testing. The projected Compound Annual Growth Rate (CAGR) for the forecast period (2025-2033) is estimated to be robust, reflecting the increasing adoption of automated solutions across diverse healthcare settings. Technological disruptions, including the integration of artificial intelligence (AI) and machine learning (ML) into diagnostic workflows, are revolutionizing sample analysis and data interpretation, leading to more efficient and precise outcomes. The increasing prevalence of chronic diseases and infectious diseases globally necessitates faster and more reliable diagnostic capabilities, which lab automation effectively addresses. Furthermore, the growing emphasis on personalized medicine and companion diagnostics is spurring the development of sophisticated automation platforms capable of handling complex assays and high-throughput screening. Consumer preferences are shifting towards integrated, end-to-end automation solutions that minimize manual intervention, reduce the risk of contamination, and ensure data integrity. This includes a demand for modular and scalable systems that can adapt to varying laboratory workloads and budgetary constraints. Competitive dynamics are intensifying, with key players investing heavily in research and development to introduce next-generation automation technologies. The market penetration of lab automation solutions is expected to deepen significantly, moving beyond large reference laboratories to smaller clinics and research institutions, thereby expanding the overall market size. Emerging economies are also showing a growing interest in adopting these technologies to improve their healthcare infrastructure and diagnostic capabilities.
Dominant Markets & Segments in Lab Automation For In-Vitro Diagnostics Market
The Lab Automation for In-Vitro Diagnostics Market is segmented by equipment type and end-user. Among the equipment segments, Analyzers consistently hold a dominant position, driven by their critical role in performing a wide array of diagnostic tests. The ongoing advancements in immunoassay, molecular, and clinical chemistry analyzers, coupled with their integration into automated workflows, contribute significantly to their market leadership.
- Analyzers: Key drivers for the dominance of analyzers include:
- Technological Sophistication: Continuous innovation in sensor technology, detection methods, and software integration enhances diagnostic accuracy and speed.
- Broad Application Spectrum: Analyzers are indispensable across virtually all in-vitro diagnostic disciplines, from routine blood tests to complex genetic analysis.
- High Throughput Requirements: In high-volume laboratories, the efficiency and capacity of automated analyzers are paramount.
Another significant segment is Automated Liquid Handlers, crucial for accurate and reproducible dispensing of reagents and samples, a cornerstone of most diagnostic assays. The demand for these systems is fueled by the need to reduce pipetting errors and improve assay standardization.
- Automated Liquid Handlers: Dominance drivers include:
- Precision and Accuracy: Essential for reliable assay results, minimizing variability.
- Throughput Enhancement: Significantly increases the number of samples processed per unit of time.
- Adaptability: Available in various configurations to suit different assay types and laboratory scales.
Geographically, North America stands out as a dominant market for lab automation in in-vitro diagnostics. This dominance is attributable to several factors:
- Advanced Healthcare Infrastructure: The region boasts highly developed healthcare systems with substantial investment in diagnostic technologies and research.
- High Healthcare Expenditure: Significant per capita healthcare spending translates into greater adoption of advanced laboratory solutions.
- Robust R&D Ecosystem: A strong presence of leading pharmaceutical and biotechnology companies, academic institutions, and research centers fosters continuous innovation and demand for cutting-edge automation.
- Favorable Regulatory Environment: While stringent, the regulatory framework in the US and Canada encourages the adoption of validated and efficient diagnostic technologies.
- Early Adopter Mentality: North American laboratories are often early adopters of new technologies, driven by the need for efficiency and competitive advantage.
Within the end-user segments, Laboratories (encompassing clinical, diagnostic, and research laboratories) represent the largest and most dominant category. The increasing complexity of diagnostic tests, coupled with a growing volume of samples, necessitates the adoption of automated solutions to maintain efficiency and accuracy.
- Laboratories: Dominance is driven by:
- High Sample Volumes: Clinical laboratories process vast numbers of samples daily, requiring automation for efficiency.
- Need for Accuracy and Reproducibility: Automation minimizes human error and ensures consistent results.
- Workforce Shortages: Automation helps mitigate the impact of skilled labor shortages in the laboratory.
Lab Automation For In-Vitro Diagnostics Market Product Developments
Product developments in the Lab Automation for In-Vitro Diagnostics Market are characterized by a focus on enhanced modularity, intelligent software integration, and improved sample tracking. Innovations are geared towards creating scalable systems that can be adapted to different laboratory sizes and testing volumes, thereby optimizing space and cost-effectiveness. The integration of AI and machine learning algorithms into robotic systems is enabling predictive maintenance, real-time quality control, and more efficient workflow management, providing significant competitive advantages in terms of operational efficiency and diagnostic precision.
Report Scope & Segmentation Analysis
The "Lab Automation For In-Vitro Diagnostics Market" report provides a comprehensive segmentation analysis. The Equipment segment includes: Automated Plate Handler, Automated Liquid Handler, Robotic Arm, Automated Storage and Retrieval System, and Analyzer. The End User segment encompasses: Academic institutions, Laboratory (clinical, diagnostic, and research), and Other End Users (e.g., pharmaceutical companies, contract research organizations). Growth projections for each segment indicate a strong upward trend, with Analyzers and Automated Liquid Handlers expected to lead market expansion. Competitive dynamics within each segment are shaped by technological innovation and strategic partnerships.
Key Drivers of Lab Automation For In-Vitro Diagnostics Market Growth
The growth of the Lab Automation for In-Vitro Diagnostics Market is propelled by several key drivers. Technologically, the continuous advancement in robotics, artificial intelligence, and data analytics enables more sophisticated and efficient diagnostic processes. Economically, increasing healthcare expenditure globally, coupled with the rising burden of chronic and infectious diseases, drives demand for high-throughput and accurate diagnostic solutions. Regulatory bodies are also increasingly encouraging the adoption of validated automated systems to ensure data integrity and patient safety. Furthermore, the persistent shortage of skilled laboratory personnel worldwide creates a strong imperative for automation to maintain operational efficiency and throughput.
Challenges in the Lab Automation For In-Vitro Diagnostics Market Sector
Despite its growth trajectory, the Lab Automation for In-Vitro Diagnostics Market faces several challenges. High initial investment costs for sophisticated automation systems can be a barrier, particularly for smaller laboratories or those in resource-limited settings. The complexity of integrating new automation solutions with existing laboratory infrastructure and IT systems can also pose significant integration hurdles. Stringent regulatory approval processes for new automated devices and software can lead to extended time-to-market. Furthermore, the need for specialized training to operate and maintain these advanced systems requires ongoing investment in workforce development, posing a challenge in talent acquisition and retention.
Emerging Opportunities in Lab Automation For In-Vitro Diagnostics Market
Emerging opportunities in the Lab Automation for In-Vitro Diagnostics Market are abundant. The growing demand for personalized medicine and companion diagnostics is driving the need for highly flexible and sophisticated automation platforms capable of handling complex assays. The expansion of healthcare services into remote and underserved regions presents an opportunity for the development of more compact and cost-effective automated diagnostic solutions. The increasing adoption of digital pathology and AI-driven image analysis further integrates lab automation into broader diagnostic workflows. Moreover, the potential for point-of-care diagnostics, enhanced by automation, offers a significant avenue for market penetration and improved patient access to timely testing.
Leading Players in the Lab Automation For In-Vitro Diagnostics Market Market
- Becton Dickinson and Company
- Tecan Group Ltd
- Cognex Corporation
- Thermo Fisher Scientific Inc
- Abbott Laboratories
- Danaher Corporation
- Siemens Healthineers AG
- Agilent Technologies Inc
- PerkinElmer Inc
- Roche Holding AG
Key Developments in Lab Automation For In-Vitro Diagnostics Market Industry
- October 2023: Roche announced the U.S. launch of the cobas connection modules (CCM) Vertical, the elevator and overhead components of its fully automated and modular CCM system to assist low-, mid-, and high-volume laboratories in optimizing space, productivity, and patient care.
- February 2023: Siemens Healthineers, a leading medical technology company, and Unilabs, a leading diagnostic services provider, have announced a multi-year agreement worth more than EUR 200 million (USD 216.58 million). Unilabs has invested in top-tier Siemens Healthineers technology and will acquire more than 400 laboratory analyzers to improve its laboratory infrastructure and provide unrivaled service to its customers.
Strategic Outlook for Lab Automation For In-Vitro Diagnostics Market Market
The strategic outlook for the Lab Automation for In-Vitro Diagnostics Market remains exceptionally positive. Future growth will be catalyzed by the increasing integration of AI and machine learning to drive predictive diagnostics and workflow optimization. The trend towards modular, scalable, and interconnected automation systems will continue, allowing laboratories to adapt to evolving needs and budgets. Strategic partnerships and collaborations between automation providers, diagnostic assay developers, and healthcare institutions will be crucial for developing comprehensive solutions. The growing emphasis on data analytics and cybersecurity within automated laboratory environments will also shape future market developments, ensuring the integrity and security of sensitive patient information and diagnostic results.
Lab Automation For In-Vitro Diagnostics Market Segmentation
-
1. Equipment
- 1.1. Automated Plate Handler
- 1.2. Automated Liquid Handler
- 1.3. Robotic Arm
- 1.4. Automated Storage and Retrieval System
- 1.5. Analyzer
-
2. End User
- 2.1. Academic
- 2.2. Laboratory
- 2.3. Other End Users
Lab Automation For In-Vitro Diagnostics Market Segmentation By Geography
- 1. North America
- 2. Europe
- 3. Asia
- 4. Australia and New Zealand
- 5. Latin America
- 6. Middle East and Africa
Lab Automation For In-Vitro Diagnostics Market REPORT HIGHLIGHTS
| Aspects | Details |
|---|---|
| Study Period | 2019-2033 |
| Base Year | 2024 |
| Estimated Year | 2025 |
| Forecast Period | 2025-2033 |
| Historical Period | 2019-2024 |
| Growth Rate | CAGR of 6.30% from 2019-2033 |
| Segmentation |
|
Table of Contents
- 1. Introduction
- 1.1. Research Scope
- 1.2. Market Segmentation
- 1.3. Research Methodology
- 1.4. Definitions and Assumptions
- 2. Executive Summary
- 2.1. Introduction
- 3. Market Dynamics
- 3.1. Introduction
- 3.2. Market Drivers
- 3.2.1. Flexibility and Adaptability of Lab Automation Systems; Digital Transformation for Laboratories with IoT
- 3.3. Market Restrains
- 3.3.1. Slow Adoption Rates by Small and Medium Laboratories; Lack of Skilled Laboratory Professionals
- 3.4. Market Trends
- 3.4.1. Adoption of Robotics Arms Aids the Market Growth
- 4. Market Factor Analysis
- 4.1. Porters Five Forces
- 4.2. Supply/Value Chain
- 4.3. PESTEL analysis
- 4.4. Market Entropy
- 4.5. Patent/Trademark Analysis
- 5. Global Lab Automation For In-Vitro Diagnostics Market Analysis, Insights and Forecast, 2019-2031
- 5.1. Market Analysis, Insights and Forecast - by Equipment
- 5.1.1. Automated Plate Handler
- 5.1.2. Automated Liquid Handler
- 5.1.3. Robotic Arm
- 5.1.4. Automated Storage and Retrieval System
- 5.1.5. Analyzer
- 5.2. Market Analysis, Insights and Forecast - by End User
- 5.2.1. Academic
- 5.2.2. Laboratory
- 5.2.3. Other End Users
- 5.3. Market Analysis, Insights and Forecast - by Region
- 5.3.1. North America
- 5.3.2. Europe
- 5.3.3. Asia
- 5.3.4. Australia and New Zealand
- 5.3.5. Latin America
- 5.3.6. Middle East and Africa
- 5.1. Market Analysis, Insights and Forecast - by Equipment
- 6. North America Lab Automation For In-Vitro Diagnostics Market Analysis, Insights and Forecast, 2019-2031
- 6.1. Market Analysis, Insights and Forecast - by Equipment
- 6.1.1. Automated Plate Handler
- 6.1.2. Automated Liquid Handler
- 6.1.3. Robotic Arm
- 6.1.4. Automated Storage and Retrieval System
- 6.1.5. Analyzer
- 6.2. Market Analysis, Insights and Forecast - by End User
- 6.2.1. Academic
- 6.2.2. Laboratory
- 6.2.3. Other End Users
- 6.1. Market Analysis, Insights and Forecast - by Equipment
- 7. Europe Lab Automation For In-Vitro Diagnostics Market Analysis, Insights and Forecast, 2019-2031
- 7.1. Market Analysis, Insights and Forecast - by Equipment
- 7.1.1. Automated Plate Handler
- 7.1.2. Automated Liquid Handler
- 7.1.3. Robotic Arm
- 7.1.4. Automated Storage and Retrieval System
- 7.1.5. Analyzer
- 7.2. Market Analysis, Insights and Forecast - by End User
- 7.2.1. Academic
- 7.2.2. Laboratory
- 7.2.3. Other End Users
- 7.1. Market Analysis, Insights and Forecast - by Equipment
- 8. Asia Lab Automation For In-Vitro Diagnostics Market Analysis, Insights and Forecast, 2019-2031
- 8.1. Market Analysis, Insights and Forecast - by Equipment
- 8.1.1. Automated Plate Handler
- 8.1.2. Automated Liquid Handler
- 8.1.3. Robotic Arm
- 8.1.4. Automated Storage and Retrieval System
- 8.1.5. Analyzer
- 8.2. Market Analysis, Insights and Forecast - by End User
- 8.2.1. Academic
- 8.2.2. Laboratory
- 8.2.3. Other End Users
- 8.1. Market Analysis, Insights and Forecast - by Equipment
- 9. Australia and New Zealand Lab Automation For In-Vitro Diagnostics Market Analysis, Insights and Forecast, 2019-2031
- 9.1. Market Analysis, Insights and Forecast - by Equipment
- 9.1.1. Automated Plate Handler
- 9.1.2. Automated Liquid Handler
- 9.1.3. Robotic Arm
- 9.1.4. Automated Storage and Retrieval System
- 9.1.5. Analyzer
- 9.2. Market Analysis, Insights and Forecast - by End User
- 9.2.1. Academic
- 9.2.2. Laboratory
- 9.2.3. Other End Users
- 9.1. Market Analysis, Insights and Forecast - by Equipment
- 10. Latin America Lab Automation For In-Vitro Diagnostics Market Analysis, Insights and Forecast, 2019-2031
- 10.1. Market Analysis, Insights and Forecast - by Equipment
- 10.1.1. Automated Plate Handler
- 10.1.2. Automated Liquid Handler
- 10.1.3. Robotic Arm
- 10.1.4. Automated Storage and Retrieval System
- 10.1.5. Analyzer
- 10.2. Market Analysis, Insights and Forecast - by End User
- 10.2.1. Academic
- 10.2.2. Laboratory
- 10.2.3. Other End Users
- 10.1. Market Analysis, Insights and Forecast - by Equipment
- 11. Middle East and Africa Lab Automation For In-Vitro Diagnostics Market Analysis, Insights and Forecast, 2019-2031
- 11.1. Market Analysis, Insights and Forecast - by Equipment
- 11.1.1. Automated Plate Handler
- 11.1.2. Automated Liquid Handler
- 11.1.3. Robotic Arm
- 11.1.4. Automated Storage and Retrieval System
- 11.1.5. Analyzer
- 11.2. Market Analysis, Insights and Forecast - by End User
- 11.2.1. Academic
- 11.2.2. Laboratory
- 11.2.3. Other End Users
- 11.1. Market Analysis, Insights and Forecast - by Equipment
- 12. North America Lab Automation For In-Vitro Diagnostics Market Analysis, Insights and Forecast, 2019-2031
- 12.1. Market Analysis, Insights and Forecast - By Country/Sub-region
- 12.1.1 United States
- 12.1.2 Canada
- 12.1.3 Mexico
- 13. Europe Lab Automation For In-Vitro Diagnostics Market Analysis, Insights and Forecast, 2019-2031
- 13.1. Market Analysis, Insights and Forecast - By Country/Sub-region
- 13.1.1 Germany
- 13.1.2 United Kingdom
- 13.1.3 France
- 13.1.4 Spain
- 13.1.5 Italy
- 13.1.6 Spain
- 13.1.7 Belgium
- 13.1.8 Netherland
- 13.1.9 Nordics
- 13.1.10 Rest of Europe
- 14. Asia Pacific Lab Automation For In-Vitro Diagnostics Market Analysis, Insights and Forecast, 2019-2031
- 14.1. Market Analysis, Insights and Forecast - By Country/Sub-region
- 14.1.1 China
- 14.1.2 Japan
- 14.1.3 India
- 14.1.4 South Korea
- 14.1.5 Southeast Asia
- 14.1.6 Australia
- 14.1.7 Indonesia
- 14.1.8 Phillipes
- 14.1.9 Singapore
- 14.1.10 Thailandc
- 14.1.11 Rest of Asia Pacific
- 15. South America Lab Automation For In-Vitro Diagnostics Market Analysis, Insights and Forecast, 2019-2031
- 15.1. Market Analysis, Insights and Forecast - By Country/Sub-region
- 15.1.1 Brazil
- 15.1.2 Argentina
- 15.1.3 Peru
- 15.1.4 Chile
- 15.1.5 Colombia
- 15.1.6 Ecuador
- 15.1.7 Venezuela
- 15.1.8 Rest of South America
- 16. North America Lab Automation For In-Vitro Diagnostics Market Analysis, Insights and Forecast, 2019-2031
- 16.1. Market Analysis, Insights and Forecast - By Country/Sub-region
- 16.1.1 United States
- 16.1.2 Canada
- 16.1.3 Mexico
- 17. MEA Lab Automation For In-Vitro Diagnostics Market Analysis, Insights and Forecast, 2019-2031
- 17.1. Market Analysis, Insights and Forecast - By Country/Sub-region
- 17.1.1 United Arab Emirates
- 17.1.2 Saudi Arabia
- 17.1.3 South Africa
- 17.1.4 Rest of Middle East and Africa
- 18. Competitive Analysis
- 18.1. Global Market Share Analysis 2024
- 18.2. Company Profiles
- 18.2.1 Becton Dickinson and Company
- 18.2.1.1. Overview
- 18.2.1.2. Products
- 18.2.1.3. SWOT Analysis
- 18.2.1.4. Recent Developments
- 18.2.1.5. Financials (Based on Availability)
- 18.2.2 Tecan Group Ltd
- 18.2.2.1. Overview
- 18.2.2.2. Products
- 18.2.2.3. SWOT Analysis
- 18.2.2.4. Recent Developments
- 18.2.2.5. Financials (Based on Availability)
- 18.2.3 Cognex Corporation
- 18.2.3.1. Overview
- 18.2.3.2. Products
- 18.2.3.3. SWOT Analysis
- 18.2.3.4. Recent Developments
- 18.2.3.5. Financials (Based on Availability)
- 18.2.4 Thermo Fisher Scientific Inc
- 18.2.4.1. Overview
- 18.2.4.2. Products
- 18.2.4.3. SWOT Analysis
- 18.2.4.4. Recent Developments
- 18.2.4.5. Financials (Based on Availability)
- 18.2.5 Abbott Laboratories
- 18.2.5.1. Overview
- 18.2.5.2. Products
- 18.2.5.3. SWOT Analysis
- 18.2.5.4. Recent Developments
- 18.2.5.5. Financials (Based on Availability)
- 18.2.6 Danaher Corporation
- 18.2.6.1. Overview
- 18.2.6.2. Products
- 18.2.6.3. SWOT Analysis
- 18.2.6.4. Recent Developments
- 18.2.6.5. Financials (Based on Availability)
- 18.2.7 Siemens Healthineers AG
- 18.2.7.1. Overview
- 18.2.7.2. Products
- 18.2.7.3. SWOT Analysis
- 18.2.7.4. Recent Developments
- 18.2.7.5. Financials (Based on Availability)
- 18.2.8 Agilent Technologies Inc
- 18.2.8.1. Overview
- 18.2.8.2. Products
- 18.2.8.3. SWOT Analysis
- 18.2.8.4. Recent Developments
- 18.2.8.5. Financials (Based on Availability)
- 18.2.9 PerkinElmer Inc
- 18.2.9.1. Overview
- 18.2.9.2. Products
- 18.2.9.3. SWOT Analysis
- 18.2.9.4. Recent Developments
- 18.2.9.5. Financials (Based on Availability)
- 18.2.10 Roche Holding AG
- 18.2.10.1. Overview
- 18.2.10.2. Products
- 18.2.10.3. SWOT Analysis
- 18.2.10.4. Recent Developments
- 18.2.10.5. Financials (Based on Availability)
- 18.2.1 Becton Dickinson and Company
List of Figures
- Figure 1: Global Lab Automation For In-Vitro Diagnostics Market Revenue Breakdown (Million, %) by Region 2024 & 2032
- Figure 2: Global Lab Automation For In-Vitro Diagnostics Market Volume Breakdown (K Unit, %) by Region 2024 & 2032
- Figure 3: North America Lab Automation For In-Vitro Diagnostics Market Revenue (Million), by Country 2024 & 2032
- Figure 4: North America Lab Automation For In-Vitro Diagnostics Market Volume (K Unit), by Country 2024 & 2032
- Figure 5: North America Lab Automation For In-Vitro Diagnostics Market Revenue Share (%), by Country 2024 & 2032
- Figure 6: North America Lab Automation For In-Vitro Diagnostics Market Volume Share (%), by Country 2024 & 2032
- Figure 7: Europe Lab Automation For In-Vitro Diagnostics Market Revenue (Million), by Country 2024 & 2032
- Figure 8: Europe Lab Automation For In-Vitro Diagnostics Market Volume (K Unit), by Country 2024 & 2032
- Figure 9: Europe Lab Automation For In-Vitro Diagnostics Market Revenue Share (%), by Country 2024 & 2032
- Figure 10: Europe Lab Automation For In-Vitro Diagnostics Market Volume Share (%), by Country 2024 & 2032
- Figure 11: Asia Pacific Lab Automation For In-Vitro Diagnostics Market Revenue (Million), by Country 2024 & 2032
- Figure 12: Asia Pacific Lab Automation For In-Vitro Diagnostics Market Volume (K Unit), by Country 2024 & 2032
- Figure 13: Asia Pacific Lab Automation For In-Vitro Diagnostics Market Revenue Share (%), by Country 2024 & 2032
- Figure 14: Asia Pacific Lab Automation For In-Vitro Diagnostics Market Volume Share (%), by Country 2024 & 2032
- Figure 15: South America Lab Automation For In-Vitro Diagnostics Market Revenue (Million), by Country 2024 & 2032
- Figure 16: South America Lab Automation For In-Vitro Diagnostics Market Volume (K Unit), by Country 2024 & 2032
- Figure 17: South America Lab Automation For In-Vitro Diagnostics Market Revenue Share (%), by Country 2024 & 2032
- Figure 18: South America Lab Automation For In-Vitro Diagnostics Market Volume Share (%), by Country 2024 & 2032
- Figure 19: North America Lab Automation For In-Vitro Diagnostics Market Revenue (Million), by Country 2024 & 2032
- Figure 20: North America Lab Automation For In-Vitro Diagnostics Market Volume (K Unit), by Country 2024 & 2032
- Figure 21: North America Lab Automation For In-Vitro Diagnostics Market Revenue Share (%), by Country 2024 & 2032
- Figure 22: North America Lab Automation For In-Vitro Diagnostics Market Volume Share (%), by Country 2024 & 2032
- Figure 23: MEA Lab Automation For In-Vitro Diagnostics Market Revenue (Million), by Country 2024 & 2032
- Figure 24: MEA Lab Automation For In-Vitro Diagnostics Market Volume (K Unit), by Country 2024 & 2032
- Figure 25: MEA Lab Automation For In-Vitro Diagnostics Market Revenue Share (%), by Country 2024 & 2032
- Figure 26: MEA Lab Automation For In-Vitro Diagnostics Market Volume Share (%), by Country 2024 & 2032
- Figure 27: North America Lab Automation For In-Vitro Diagnostics Market Revenue (Million), by Equipment 2024 & 2032
- Figure 28: North America Lab Automation For In-Vitro Diagnostics Market Volume (K Unit), by Equipment 2024 & 2032
- Figure 29: North America Lab Automation For In-Vitro Diagnostics Market Revenue Share (%), by Equipment 2024 & 2032
- Figure 30: North America Lab Automation For In-Vitro Diagnostics Market Volume Share (%), by Equipment 2024 & 2032
- Figure 31: North America Lab Automation For In-Vitro Diagnostics Market Revenue (Million), by End User 2024 & 2032
- Figure 32: North America Lab Automation For In-Vitro Diagnostics Market Volume (K Unit), by End User 2024 & 2032
- Figure 33: North America Lab Automation For In-Vitro Diagnostics Market Revenue Share (%), by End User 2024 & 2032
- Figure 34: North America Lab Automation For In-Vitro Diagnostics Market Volume Share (%), by End User 2024 & 2032
- Figure 35: North America Lab Automation For In-Vitro Diagnostics Market Revenue (Million), by Country 2024 & 2032
- Figure 36: North America Lab Automation For In-Vitro Diagnostics Market Volume (K Unit), by Country 2024 & 2032
- Figure 37: North America Lab Automation For In-Vitro Diagnostics Market Revenue Share (%), by Country 2024 & 2032
- Figure 38: North America Lab Automation For In-Vitro Diagnostics Market Volume Share (%), by Country 2024 & 2032
- Figure 39: Europe Lab Automation For In-Vitro Diagnostics Market Revenue (Million), by Equipment 2024 & 2032
- Figure 40: Europe Lab Automation For In-Vitro Diagnostics Market Volume (K Unit), by Equipment 2024 & 2032
- Figure 41: Europe Lab Automation For In-Vitro Diagnostics Market Revenue Share (%), by Equipment 2024 & 2032
- Figure 42: Europe Lab Automation For In-Vitro Diagnostics Market Volume Share (%), by Equipment 2024 & 2032
- Figure 43: Europe Lab Automation For In-Vitro Diagnostics Market Revenue (Million), by End User 2024 & 2032
- Figure 44: Europe Lab Automation For In-Vitro Diagnostics Market Volume (K Unit), by End User 2024 & 2032
- Figure 45: Europe Lab Automation For In-Vitro Diagnostics Market Revenue Share (%), by End User 2024 & 2032
- Figure 46: Europe Lab Automation For In-Vitro Diagnostics Market Volume Share (%), by End User 2024 & 2032
- Figure 47: Europe Lab Automation For In-Vitro Diagnostics Market Revenue (Million), by Country 2024 & 2032
- Figure 48: Europe Lab Automation For In-Vitro Diagnostics Market Volume (K Unit), by Country 2024 & 2032
- Figure 49: Europe Lab Automation For In-Vitro Diagnostics Market Revenue Share (%), by Country 2024 & 2032
- Figure 50: Europe Lab Automation For In-Vitro Diagnostics Market Volume Share (%), by Country 2024 & 2032
- Figure 51: Asia Lab Automation For In-Vitro Diagnostics Market Revenue (Million), by Equipment 2024 & 2032
- Figure 52: Asia Lab Automation For In-Vitro Diagnostics Market Volume (K Unit), by Equipment 2024 & 2032
- Figure 53: Asia Lab Automation For In-Vitro Diagnostics Market Revenue Share (%), by Equipment 2024 & 2032
- Figure 54: Asia Lab Automation For In-Vitro Diagnostics Market Volume Share (%), by Equipment 2024 & 2032
- Figure 55: Asia Lab Automation For In-Vitro Diagnostics Market Revenue (Million), by End User 2024 & 2032
- Figure 56: Asia Lab Automation For In-Vitro Diagnostics Market Volume (K Unit), by End User 2024 & 2032
- Figure 57: Asia Lab Automation For In-Vitro Diagnostics Market Revenue Share (%), by End User 2024 & 2032
- Figure 58: Asia Lab Automation For In-Vitro Diagnostics Market Volume Share (%), by End User 2024 & 2032
- Figure 59: Asia Lab Automation For In-Vitro Diagnostics Market Revenue (Million), by Country 2024 & 2032
- Figure 60: Asia Lab Automation For In-Vitro Diagnostics Market Volume (K Unit), by Country 2024 & 2032
- Figure 61: Asia Lab Automation For In-Vitro Diagnostics Market Revenue Share (%), by Country 2024 & 2032
- Figure 62: Asia Lab Automation For In-Vitro Diagnostics Market Volume Share (%), by Country 2024 & 2032
- Figure 63: Australia and New Zealand Lab Automation For In-Vitro Diagnostics Market Revenue (Million), by Equipment 2024 & 2032
- Figure 64: Australia and New Zealand Lab Automation For In-Vitro Diagnostics Market Volume (K Unit), by Equipment 2024 & 2032
- Figure 65: Australia and New Zealand Lab Automation For In-Vitro Diagnostics Market Revenue Share (%), by Equipment 2024 & 2032
- Figure 66: Australia and New Zealand Lab Automation For In-Vitro Diagnostics Market Volume Share (%), by Equipment 2024 & 2032
- Figure 67: Australia and New Zealand Lab Automation For In-Vitro Diagnostics Market Revenue (Million), by End User 2024 & 2032
- Figure 68: Australia and New Zealand Lab Automation For In-Vitro Diagnostics Market Volume (K Unit), by End User 2024 & 2032
- Figure 69: Australia and New Zealand Lab Automation For In-Vitro Diagnostics Market Revenue Share (%), by End User 2024 & 2032
- Figure 70: Australia and New Zealand Lab Automation For In-Vitro Diagnostics Market Volume Share (%), by End User 2024 & 2032
- Figure 71: Australia and New Zealand Lab Automation For In-Vitro Diagnostics Market Revenue (Million), by Country 2024 & 2032
- Figure 72: Australia and New Zealand Lab Automation For In-Vitro Diagnostics Market Volume (K Unit), by Country 2024 & 2032
- Figure 73: Australia and New Zealand Lab Automation For In-Vitro Diagnostics Market Revenue Share (%), by Country 2024 & 2032
- Figure 74: Australia and New Zealand Lab Automation For In-Vitro Diagnostics Market Volume Share (%), by Country 2024 & 2032
- Figure 75: Latin America Lab Automation For In-Vitro Diagnostics Market Revenue (Million), by Equipment 2024 & 2032
- Figure 76: Latin America Lab Automation For In-Vitro Diagnostics Market Volume (K Unit), by Equipment 2024 & 2032
- Figure 77: Latin America Lab Automation For In-Vitro Diagnostics Market Revenue Share (%), by Equipment 2024 & 2032
- Figure 78: Latin America Lab Automation For In-Vitro Diagnostics Market Volume Share (%), by Equipment 2024 & 2032
- Figure 79: Latin America Lab Automation For In-Vitro Diagnostics Market Revenue (Million), by End User 2024 & 2032
- Figure 80: Latin America Lab Automation For In-Vitro Diagnostics Market Volume (K Unit), by End User 2024 & 2032
- Figure 81: Latin America Lab Automation For In-Vitro Diagnostics Market Revenue Share (%), by End User 2024 & 2032
- Figure 82: Latin America Lab Automation For In-Vitro Diagnostics Market Volume Share (%), by End User 2024 & 2032
- Figure 83: Latin America Lab Automation For In-Vitro Diagnostics Market Revenue (Million), by Country 2024 & 2032
- Figure 84: Latin America Lab Automation For In-Vitro Diagnostics Market Volume (K Unit), by Country 2024 & 2032
- Figure 85: Latin America Lab Automation For In-Vitro Diagnostics Market Revenue Share (%), by Country 2024 & 2032
- Figure 86: Latin America Lab Automation For In-Vitro Diagnostics Market Volume Share (%), by Country 2024 & 2032
- Figure 87: Middle East and Africa Lab Automation For In-Vitro Diagnostics Market Revenue (Million), by Equipment 2024 & 2032
- Figure 88: Middle East and Africa Lab Automation For In-Vitro Diagnostics Market Volume (K Unit), by Equipment 2024 & 2032
- Figure 89: Middle East and Africa Lab Automation For In-Vitro Diagnostics Market Revenue Share (%), by Equipment 2024 & 2032
- Figure 90: Middle East and Africa Lab Automation For In-Vitro Diagnostics Market Volume Share (%), by Equipment 2024 & 2032
- Figure 91: Middle East and Africa Lab Automation For In-Vitro Diagnostics Market Revenue (Million), by End User 2024 & 2032
- Figure 92: Middle East and Africa Lab Automation For In-Vitro Diagnostics Market Volume (K Unit), by End User 2024 & 2032
- Figure 93: Middle East and Africa Lab Automation For In-Vitro Diagnostics Market Revenue Share (%), by End User 2024 & 2032
- Figure 94: Middle East and Africa Lab Automation For In-Vitro Diagnostics Market Volume Share (%), by End User 2024 & 2032
- Figure 95: Middle East and Africa Lab Automation For In-Vitro Diagnostics Market Revenue (Million), by Country 2024 & 2032
- Figure 96: Middle East and Africa Lab Automation For In-Vitro Diagnostics Market Volume (K Unit), by Country 2024 & 2032
- Figure 97: Middle East and Africa Lab Automation For In-Vitro Diagnostics Market Revenue Share (%), by Country 2024 & 2032
- Figure 98: Middle East and Africa Lab Automation For In-Vitro Diagnostics Market Volume Share (%), by Country 2024 & 2032
List of Tables
- Table 1: Global Lab Automation For In-Vitro Diagnostics Market Revenue Million Forecast, by Region 2019 & 2032
- Table 2: Global Lab Automation For In-Vitro Diagnostics Market Volume K Unit Forecast, by Region 2019 & 2032
- Table 3: Global Lab Automation For In-Vitro Diagnostics Market Revenue Million Forecast, by Equipment 2019 & 2032
- Table 4: Global Lab Automation For In-Vitro Diagnostics Market Volume K Unit Forecast, by Equipment 2019 & 2032
- Table 5: Global Lab Automation For In-Vitro Diagnostics Market Revenue Million Forecast, by End User 2019 & 2032
- Table 6: Global Lab Automation For In-Vitro Diagnostics Market Volume K Unit Forecast, by End User 2019 & 2032
- Table 7: Global Lab Automation For In-Vitro Diagnostics Market Revenue Million Forecast, by Region 2019 & 2032
- Table 8: Global Lab Automation For In-Vitro Diagnostics Market Volume K Unit Forecast, by Region 2019 & 2032
- Table 9: Global Lab Automation For In-Vitro Diagnostics Market Revenue Million Forecast, by Country 2019 & 2032
- Table 10: Global Lab Automation For In-Vitro Diagnostics Market Volume K Unit Forecast, by Country 2019 & 2032
- Table 11: United States Lab Automation For In-Vitro Diagnostics Market Revenue (Million) Forecast, by Application 2019 & 2032
- Table 12: United States Lab Automation For In-Vitro Diagnostics Market Volume (K Unit) Forecast, by Application 2019 & 2032
- Table 13: Canada Lab Automation For In-Vitro Diagnostics Market Revenue (Million) Forecast, by Application 2019 & 2032
- Table 14: Canada Lab Automation For In-Vitro Diagnostics Market Volume (K Unit) Forecast, by Application 2019 & 2032
- Table 15: Mexico Lab Automation For In-Vitro Diagnostics Market Revenue (Million) Forecast, by Application 2019 & 2032
- Table 16: Mexico Lab Automation For In-Vitro Diagnostics Market Volume (K Unit) Forecast, by Application 2019 & 2032
- Table 17: Global Lab Automation For In-Vitro Diagnostics Market Revenue Million Forecast, by Country 2019 & 2032
- Table 18: Global Lab Automation For In-Vitro Diagnostics Market Volume K Unit Forecast, by Country 2019 & 2032
- Table 19: Germany Lab Automation For In-Vitro Diagnostics Market Revenue (Million) Forecast, by Application 2019 & 2032
- Table 20: Germany Lab Automation For In-Vitro Diagnostics Market Volume (K Unit) Forecast, by Application 2019 & 2032
- Table 21: United Kingdom Lab Automation For In-Vitro Diagnostics Market Revenue (Million) Forecast, by Application 2019 & 2032
- Table 22: United Kingdom Lab Automation For In-Vitro Diagnostics Market Volume (K Unit) Forecast, by Application 2019 & 2032
- Table 23: France Lab Automation For In-Vitro Diagnostics Market Revenue (Million) Forecast, by Application 2019 & 2032
- Table 24: France Lab Automation For In-Vitro Diagnostics Market Volume (K Unit) Forecast, by Application 2019 & 2032
- Table 25: Spain Lab Automation For In-Vitro Diagnostics Market Revenue (Million) Forecast, by Application 2019 & 2032
- Table 26: Spain Lab Automation For In-Vitro Diagnostics Market Volume (K Unit) Forecast, by Application 2019 & 2032
- Table 27: Italy Lab Automation For In-Vitro Diagnostics Market Revenue (Million) Forecast, by Application 2019 & 2032
- Table 28: Italy Lab Automation For In-Vitro Diagnostics Market Volume (K Unit) Forecast, by Application 2019 & 2032
- Table 29: Spain Lab Automation For In-Vitro Diagnostics Market Revenue (Million) Forecast, by Application 2019 & 2032
- Table 30: Spain Lab Automation For In-Vitro Diagnostics Market Volume (K Unit) Forecast, by Application 2019 & 2032
- Table 31: Belgium Lab Automation For In-Vitro Diagnostics Market Revenue (Million) Forecast, by Application 2019 & 2032
- Table 32: Belgium Lab Automation For In-Vitro Diagnostics Market Volume (K Unit) Forecast, by Application 2019 & 2032
- Table 33: Netherland Lab Automation For In-Vitro Diagnostics Market Revenue (Million) Forecast, by Application 2019 & 2032
- Table 34: Netherland Lab Automation For In-Vitro Diagnostics Market Volume (K Unit) Forecast, by Application 2019 & 2032
- Table 35: Nordics Lab Automation For In-Vitro Diagnostics Market Revenue (Million) Forecast, by Application 2019 & 2032
- Table 36: Nordics Lab Automation For In-Vitro Diagnostics Market Volume (K Unit) Forecast, by Application 2019 & 2032
- Table 37: Rest of Europe Lab Automation For In-Vitro Diagnostics Market Revenue (Million) Forecast, by Application 2019 & 2032
- Table 38: Rest of Europe Lab Automation For In-Vitro Diagnostics Market Volume (K Unit) Forecast, by Application 2019 & 2032
- Table 39: Global Lab Automation For In-Vitro Diagnostics Market Revenue Million Forecast, by Country 2019 & 2032
- Table 40: Global Lab Automation For In-Vitro Diagnostics Market Volume K Unit Forecast, by Country 2019 & 2032
- Table 41: China Lab Automation For In-Vitro Diagnostics Market Revenue (Million) Forecast, by Application 2019 & 2032
- Table 42: China Lab Automation For In-Vitro Diagnostics Market Volume (K Unit) Forecast, by Application 2019 & 2032
- Table 43: Japan Lab Automation For In-Vitro Diagnostics Market Revenue (Million) Forecast, by Application 2019 & 2032
- Table 44: Japan Lab Automation For In-Vitro Diagnostics Market Volume (K Unit) Forecast, by Application 2019 & 2032
- Table 45: India Lab Automation For In-Vitro Diagnostics Market Revenue (Million) Forecast, by Application 2019 & 2032
- Table 46: India Lab Automation For In-Vitro Diagnostics Market Volume (K Unit) Forecast, by Application 2019 & 2032
- Table 47: South Korea Lab Automation For In-Vitro Diagnostics Market Revenue (Million) Forecast, by Application 2019 & 2032
- Table 48: South Korea Lab Automation For In-Vitro Diagnostics Market Volume (K Unit) Forecast, by Application 2019 & 2032
- Table 49: Southeast Asia Lab Automation For In-Vitro Diagnostics Market Revenue (Million) Forecast, by Application 2019 & 2032
- Table 50: Southeast Asia Lab Automation For In-Vitro Diagnostics Market Volume (K Unit) Forecast, by Application 2019 & 2032
- Table 51: Australia Lab Automation For In-Vitro Diagnostics Market Revenue (Million) Forecast, by Application 2019 & 2032
- Table 52: Australia Lab Automation For In-Vitro Diagnostics Market Volume (K Unit) Forecast, by Application 2019 & 2032
- Table 53: Indonesia Lab Automation For In-Vitro Diagnostics Market Revenue (Million) Forecast, by Application 2019 & 2032
- Table 54: Indonesia Lab Automation For In-Vitro Diagnostics Market Volume (K Unit) Forecast, by Application 2019 & 2032
- Table 55: Phillipes Lab Automation For In-Vitro Diagnostics Market Revenue (Million) Forecast, by Application 2019 & 2032
- Table 56: Phillipes Lab Automation For In-Vitro Diagnostics Market Volume (K Unit) Forecast, by Application 2019 & 2032
- Table 57: Singapore Lab Automation For In-Vitro Diagnostics Market Revenue (Million) Forecast, by Application 2019 & 2032
- Table 58: Singapore Lab Automation For In-Vitro Diagnostics Market Volume (K Unit) Forecast, by Application 2019 & 2032
- Table 59: Thailandc Lab Automation For In-Vitro Diagnostics Market Revenue (Million) Forecast, by Application 2019 & 2032
- Table 60: Thailandc Lab Automation For In-Vitro Diagnostics Market Volume (K Unit) Forecast, by Application 2019 & 2032
- Table 61: Rest of Asia Pacific Lab Automation For In-Vitro Diagnostics Market Revenue (Million) Forecast, by Application 2019 & 2032
- Table 62: Rest of Asia Pacific Lab Automation For In-Vitro Diagnostics Market Volume (K Unit) Forecast, by Application 2019 & 2032
- Table 63: Global Lab Automation For In-Vitro Diagnostics Market Revenue Million Forecast, by Country 2019 & 2032
- Table 64: Global Lab Automation For In-Vitro Diagnostics Market Volume K Unit Forecast, by Country 2019 & 2032
- Table 65: Brazil Lab Automation For In-Vitro Diagnostics Market Revenue (Million) Forecast, by Application 2019 & 2032
- Table 66: Brazil Lab Automation For In-Vitro Diagnostics Market Volume (K Unit) Forecast, by Application 2019 & 2032
- Table 67: Argentina Lab Automation For In-Vitro Diagnostics Market Revenue (Million) Forecast, by Application 2019 & 2032
- Table 68: Argentina Lab Automation For In-Vitro Diagnostics Market Volume (K Unit) Forecast, by Application 2019 & 2032
- Table 69: Peru Lab Automation For In-Vitro Diagnostics Market Revenue (Million) Forecast, by Application 2019 & 2032
- Table 70: Peru Lab Automation For In-Vitro Diagnostics Market Volume (K Unit) Forecast, by Application 2019 & 2032
- Table 71: Chile Lab Automation For In-Vitro Diagnostics Market Revenue (Million) Forecast, by Application 2019 & 2032
- Table 72: Chile Lab Automation For In-Vitro Diagnostics Market Volume (K Unit) Forecast, by Application 2019 & 2032
- Table 73: Colombia Lab Automation For In-Vitro Diagnostics Market Revenue (Million) Forecast, by Application 2019 & 2032
- Table 74: Colombia Lab Automation For In-Vitro Diagnostics Market Volume (K Unit) Forecast, by Application 2019 & 2032
- Table 75: Ecuador Lab Automation For In-Vitro Diagnostics Market Revenue (Million) Forecast, by Application 2019 & 2032
- Table 76: Ecuador Lab Automation For In-Vitro Diagnostics Market Volume (K Unit) Forecast, by Application 2019 & 2032
- Table 77: Venezuela Lab Automation For In-Vitro Diagnostics Market Revenue (Million) Forecast, by Application 2019 & 2032
- Table 78: Venezuela Lab Automation For In-Vitro Diagnostics Market Volume (K Unit) Forecast, by Application 2019 & 2032
- Table 79: Rest of South America Lab Automation For In-Vitro Diagnostics Market Revenue (Million) Forecast, by Application 2019 & 2032
- Table 80: Rest of South America Lab Automation For In-Vitro Diagnostics Market Volume (K Unit) Forecast, by Application 2019 & 2032
- Table 81: Global Lab Automation For In-Vitro Diagnostics Market Revenue Million Forecast, by Country 2019 & 2032
- Table 82: Global Lab Automation For In-Vitro Diagnostics Market Volume K Unit Forecast, by Country 2019 & 2032
- Table 83: United States Lab Automation For In-Vitro Diagnostics Market Revenue (Million) Forecast, by Application 2019 & 2032
- Table 84: United States Lab Automation For In-Vitro Diagnostics Market Volume (K Unit) Forecast, by Application 2019 & 2032
- Table 85: Canada Lab Automation For In-Vitro Diagnostics Market Revenue (Million) Forecast, by Application 2019 & 2032
- Table 86: Canada Lab Automation For In-Vitro Diagnostics Market Volume (K Unit) Forecast, by Application 2019 & 2032
- Table 87: Mexico Lab Automation For In-Vitro Diagnostics Market Revenue (Million) Forecast, by Application 2019 & 2032
- Table 88: Mexico Lab Automation For In-Vitro Diagnostics Market Volume (K Unit) Forecast, by Application 2019 & 2032
- Table 89: Global Lab Automation For In-Vitro Diagnostics Market Revenue Million Forecast, by Country 2019 & 2032
- Table 90: Global Lab Automation For In-Vitro Diagnostics Market Volume K Unit Forecast, by Country 2019 & 2032
- Table 91: United Arab Emirates Lab Automation For In-Vitro Diagnostics Market Revenue (Million) Forecast, by Application 2019 & 2032
- Table 92: United Arab Emirates Lab Automation For In-Vitro Diagnostics Market Volume (K Unit) Forecast, by Application 2019 & 2032
- Table 93: Saudi Arabia Lab Automation For In-Vitro Diagnostics Market Revenue (Million) Forecast, by Application 2019 & 2032
- Table 94: Saudi Arabia Lab Automation For In-Vitro Diagnostics Market Volume (K Unit) Forecast, by Application 2019 & 2032
- Table 95: South Africa Lab Automation For In-Vitro Diagnostics Market Revenue (Million) Forecast, by Application 2019 & 2032
- Table 96: South Africa Lab Automation For In-Vitro Diagnostics Market Volume (K Unit) Forecast, by Application 2019 & 2032
- Table 97: Rest of Middle East and Africa Lab Automation For In-Vitro Diagnostics Market Revenue (Million) Forecast, by Application 2019 & 2032
- Table 98: Rest of Middle East and Africa Lab Automation For In-Vitro Diagnostics Market Volume (K Unit) Forecast, by Application 2019 & 2032
- Table 99: Global Lab Automation For In-Vitro Diagnostics Market Revenue Million Forecast, by Equipment 2019 & 2032
- Table 100: Global Lab Automation For In-Vitro Diagnostics Market Volume K Unit Forecast, by Equipment 2019 & 2032
- Table 101: Global Lab Automation For In-Vitro Diagnostics Market Revenue Million Forecast, by End User 2019 & 2032
- Table 102: Global Lab Automation For In-Vitro Diagnostics Market Volume K Unit Forecast, by End User 2019 & 2032
- Table 103: Global Lab Automation For In-Vitro Diagnostics Market Revenue Million Forecast, by Country 2019 & 2032
- Table 104: Global Lab Automation For In-Vitro Diagnostics Market Volume K Unit Forecast, by Country 2019 & 2032
- Table 105: Global Lab Automation For In-Vitro Diagnostics Market Revenue Million Forecast, by Equipment 2019 & 2032
- Table 106: Global Lab Automation For In-Vitro Diagnostics Market Volume K Unit Forecast, by Equipment 2019 & 2032
- Table 107: Global Lab Automation For In-Vitro Diagnostics Market Revenue Million Forecast, by End User 2019 & 2032
- Table 108: Global Lab Automation For In-Vitro Diagnostics Market Volume K Unit Forecast, by End User 2019 & 2032
- Table 109: Global Lab Automation For In-Vitro Diagnostics Market Revenue Million Forecast, by Country 2019 & 2032
- Table 110: Global Lab Automation For In-Vitro Diagnostics Market Volume K Unit Forecast, by Country 2019 & 2032
- Table 111: Global Lab Automation For In-Vitro Diagnostics Market Revenue Million Forecast, by Equipment 2019 & 2032
- Table 112: Global Lab Automation For In-Vitro Diagnostics Market Volume K Unit Forecast, by Equipment 2019 & 2032
- Table 113: Global Lab Automation For In-Vitro Diagnostics Market Revenue Million Forecast, by End User 2019 & 2032
- Table 114: Global Lab Automation For In-Vitro Diagnostics Market Volume K Unit Forecast, by End User 2019 & 2032
- Table 115: Global Lab Automation For In-Vitro Diagnostics Market Revenue Million Forecast, by Country 2019 & 2032
- Table 116: Global Lab Automation For In-Vitro Diagnostics Market Volume K Unit Forecast, by Country 2019 & 2032
- Table 117: Global Lab Automation For In-Vitro Diagnostics Market Revenue Million Forecast, by Equipment 2019 & 2032
- Table 118: Global Lab Automation For In-Vitro Diagnostics Market Volume K Unit Forecast, by Equipment 2019 & 2032
- Table 119: Global Lab Automation For In-Vitro Diagnostics Market Revenue Million Forecast, by End User 2019 & 2032
- Table 120: Global Lab Automation For In-Vitro Diagnostics Market Volume K Unit Forecast, by End User 2019 & 2032
- Table 121: Global Lab Automation For In-Vitro Diagnostics Market Revenue Million Forecast, by Country 2019 & 2032
- Table 122: Global Lab Automation For In-Vitro Diagnostics Market Volume K Unit Forecast, by Country 2019 & 2032
- Table 123: Global Lab Automation For In-Vitro Diagnostics Market Revenue Million Forecast, by Equipment 2019 & 2032
- Table 124: Global Lab Automation For In-Vitro Diagnostics Market Volume K Unit Forecast, by Equipment 2019 & 2032
- Table 125: Global Lab Automation For In-Vitro Diagnostics Market Revenue Million Forecast, by End User 2019 & 2032
- Table 126: Global Lab Automation For In-Vitro Diagnostics Market Volume K Unit Forecast, by End User 2019 & 2032
- Table 127: Global Lab Automation For In-Vitro Diagnostics Market Revenue Million Forecast, by Country 2019 & 2032
- Table 128: Global Lab Automation For In-Vitro Diagnostics Market Volume K Unit Forecast, by Country 2019 & 2032
- Table 129: Global Lab Automation For In-Vitro Diagnostics Market Revenue Million Forecast, by Equipment 2019 & 2032
- Table 130: Global Lab Automation For In-Vitro Diagnostics Market Volume K Unit Forecast, by Equipment 2019 & 2032
- Table 131: Global Lab Automation For In-Vitro Diagnostics Market Revenue Million Forecast, by End User 2019 & 2032
- Table 132: Global Lab Automation For In-Vitro Diagnostics Market Volume K Unit Forecast, by End User 2019 & 2032
- Table 133: Global Lab Automation For In-Vitro Diagnostics Market Revenue Million Forecast, by Country 2019 & 2032
- Table 134: Global Lab Automation For In-Vitro Diagnostics Market Volume K Unit Forecast, by Country 2019 & 2032
Frequently Asked Questions
1. What is the projected Compound Annual Growth Rate (CAGR) of the Lab Automation For In-Vitro Diagnostics Market?
The projected CAGR is approximately 6.30%.
2. Which companies are prominent players in the Lab Automation For In-Vitro Diagnostics Market?
Key companies in the market include Becton Dickinson and Company, Tecan Group Ltd, Cognex Corporation, Thermo Fisher Scientific Inc, Abbott Laboratories, Danaher Corporation, Siemens Healthineers AG, Agilent Technologies Inc, PerkinElmer Inc, Roche Holding AG.
3. What are the main segments of the Lab Automation For In-Vitro Diagnostics Market?
The market segments include Equipment, End User.
4. Can you provide details about the market size?
The market size is estimated to be USD 5.75 Million as of 2022.
5. What are some drivers contributing to market growth?
Flexibility and Adaptability of Lab Automation Systems; Digital Transformation for Laboratories with IoT.
6. What are the notable trends driving market growth?
Adoption of Robotics Arms Aids the Market Growth.
7. Are there any restraints impacting market growth?
Slow Adoption Rates by Small and Medium Laboratories; Lack of Skilled Laboratory Professionals.
8. Can you provide examples of recent developments in the market?
October 2023 - Roche announced the U.S. launch of the cobas connection modules (CCM) Vertical, the elevator and overhead components of its fully automated and modular CCM system to assist low-, mid-, and high-volume laboratories in optimizing space, productivity, and patient care.
9. What pricing options are available for accessing the report?
Pricing options include single-user, multi-user, and enterprise licenses priced at USD 4750, USD 5250, and USD 8750 respectively.
10. Is the market size provided in terms of value or volume?
The market size is provided in terms of value, measured in Million and volume, measured in K Unit.
11. Are there any specific market keywords associated with the report?
Yes, the market keyword associated with the report is "Lab Automation For In-Vitro Diagnostics Market," which aids in identifying and referencing the specific market segment covered.
12. How do I determine which pricing option suits my needs best?
The pricing options vary based on user requirements and access needs. Individual users may opt for single-user licenses, while businesses requiring broader access may choose multi-user or enterprise licenses for cost-effective access to the report.
13. Are there any additional resources or data provided in the Lab Automation For In-Vitro Diagnostics Market report?
While the report offers comprehensive insights, it's advisable to review the specific contents or supplementary materials provided to ascertain if additional resources or data are available.
14. How can I stay updated on further developments or reports in the Lab Automation For In-Vitro Diagnostics Market?
To stay informed about further developments, trends, and reports in the Lab Automation For In-Vitro Diagnostics Market, consider subscribing to industry newsletters, following relevant companies and organizations, or regularly checking reputable industry news sources and publications.
Methodology
Step 1 - Identification of Relevant Samples Size from Population Database


Step 2 - Approaches for Defining Global Market Size (Value, Volume* & Price*)

Note*: In applicable scenarios
Step 3 - Data Sources
Primary Research
- Web Analytics
- Survey Reports
- Research Institute
- Latest Research Reports
- Opinion Leaders
Secondary Research
- Annual Reports
- White Paper
- Latest Press Release
- Industry Association
- Paid Database
- Investor Presentations

Step 4 - Data Triangulation
Involves using different sources of information in order to increase the validity of a study
These sources are likely to be stakeholders in a program - participants, other researchers, program staff, other community members, and so on.
Then we put all data in single framework & apply various statistical tools to find out the dynamic on the market.
During the analysis stage, feedback from the stakeholder groups would be compared to determine areas of agreement as well as areas of divergence


