

Key Insights
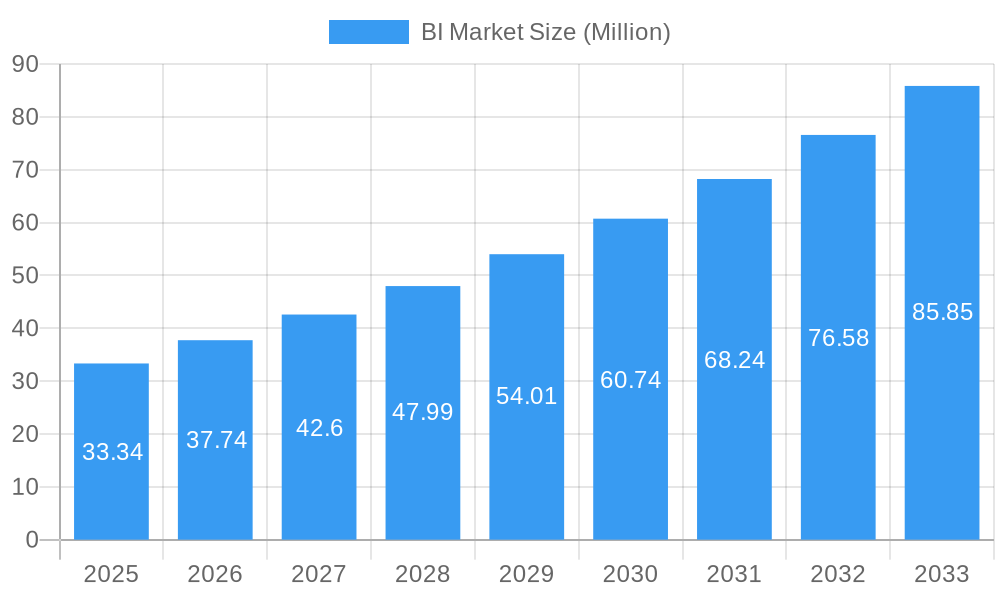
The Business Intelligence (BI) market is poised for substantial expansion, projected to reach USD 33.34 billion by 2025, fueled by an impressive Compound Annual Growth Rate (CAGR) of 13.16% through 2033. This robust growth is underpinned by an increasing need for data-driven decision-making across all industries, from BFSI and IT to healthcare and retail. Organizations are actively investing in sophisticated BI solutions to gain deeper insights into customer behavior, optimize operational efficiency, and identify new revenue streams. The shift towards cloud-based deployments is a significant driver, offering scalability, flexibility, and cost-effectiveness that on-premise solutions often struggle to match. Furthermore, the continuous evolution of analytics tools, including AI and machine learning integration, is enhancing the capabilities of BI platforms, enabling more predictive and prescriptive insights, thereby solidifying the market's upward trajectory.
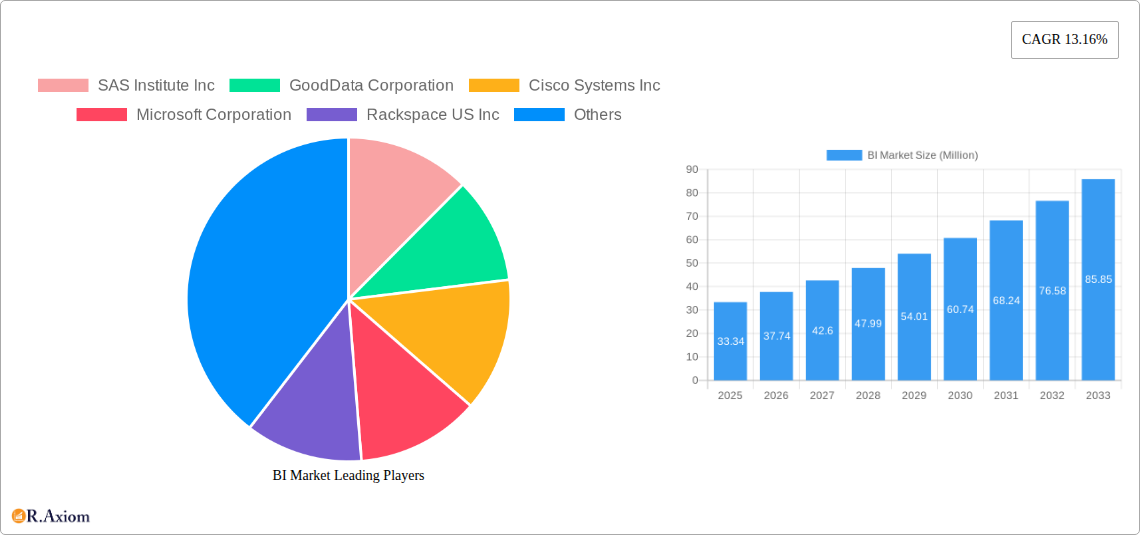
BI Market Market Size (In Million)
Key market segments contributing to this growth include both software and platform solutions, as well as the comprehensive services that support their implementation and utilization. The IT and Telecommunication sector, along with BFSI, are expected to lead in adoption due to the high volume of data generated and the critical need for real-time analytics for competitive advantage and risk management. While the adoption of cloud-based BI solutions is accelerating, on-premise deployments will continue to hold relevance for organizations with stringent data security and regulatory compliance requirements. Emerging markets in Asia, alongside established regions like North America and Europe, are anticipated to present significant opportunities, driven by digital transformation initiatives and a growing awareness of the strategic value of business intelligence. The competitive landscape features established giants like Microsoft, SAP, and Oracle, alongside innovative players such as Tableau and GoodData, all vying to capture market share through continuous innovation and tailored solutions.
BI Market Company Market Share
BI Market Market Concentration & Innovation
The Business Intelligence (BI) market exhibits a moderate to high concentration, with a few dominant players like Microsoft Corporation, SAP SE, and Oracle Corporation holding significant market share. These industry titans leverage extensive R&D investments and established customer bases to drive innovation. Key innovation drivers include the relentless pursuit of advanced analytics, the integration of Artificial Intelligence (AI) and Machine Learning (ML) for predictive insights, and the demand for real-time data processing. Regulatory frameworks, while evolving, primarily focus on data privacy and security, influencing how BI solutions are developed and deployed. Product substitutes are emerging, particularly in the form of embedded analytics within enterprise applications and more user-friendly self-service BI tools that democratize data access. End-user trends are shifting towards cloud-native BI platforms and a greater emphasis on actionable insights rather than raw data reporting. Mergers and acquisitions (M&A) remain a significant strategy for market consolidation and technological advancement. For instance, acquisitions of smaller, innovative BI startups by larger corporations have been prevalent, aiming to bolster their portfolios. Estimated M&A deal values within the BI sector are projected to reach several billion dollars annually throughout the study period.
BI Market Industry Trends & Insights
The global Business Intelligence (BI) market is poised for substantial growth, driven by an increasing volume of data generated across industries and the escalating need for data-driven decision-making. The Compound Annual Growth Rate (CAGR) for the BI market is estimated to be robust, projected at approximately 12% over the forecast period of 2025–2033. This expansion is fueled by several key trends. Technologically, the integration of AI and ML into BI platforms is revolutionizing how businesses extract value from their data, enabling predictive analytics, prescriptive recommendations, and automated insights. Cloud-based BI solutions continue to gain traction, offering scalability, flexibility, and cost-effectiveness compared to traditional on-premise deployments. The widespread adoption of big data technologies further bolsters the demand for sophisticated BI tools capable of handling and analyzing massive datasets.
Consumer preferences are also evolving. Organizations are increasingly seeking self-service BI capabilities, empowering business users to explore data and generate reports without relying heavily on IT departments. This democratization of data is crucial for fostering a data-literate culture within companies. Furthermore, the demand for real-time analytics is surging, allowing businesses to respond swiftly to market changes and operational anomalies. The competitive landscape is characterized by intense innovation and strategic partnerships. Major players are continuously enhancing their offerings with advanced features like natural language processing (NLP) for easier data querying and embedded analytics that seamlessly integrate BI functionalities into existing business applications. Market penetration of advanced BI solutions is expected to deepen significantly across all end-user industries as organizations recognize the competitive advantage derived from effective data utilization. The ongoing digital transformation initiatives across sectors, coupled with the need to optimize operational efficiency and customer experiences, are the primary catalysts for sustained market expansion in the BI sector.
Dominant Markets & Segments in BI Market
The Business Intelligence (BI) market is segmented across various components, deployment models, and end-user industries, each exhibiting distinct growth trajectories and dominance.
Component: Software and Platform This segment is the largest contributor to the BI market revenue, projected to account for over 70% of the total market size by 2025, estimated at €65,000 Million. The dominance is driven by the continuous innovation in advanced analytics, data visualization, predictive modeling, and AI-powered insights offered by leading software providers. Key drivers include the increasing sophistication of analytical tools and the integration of machine learning algorithms that enhance the predictive and prescriptive capabilities of BI platforms. The demand for cloud-native BI platforms, offering scalability and cost-efficiency, further propels this segment's growth.
Deployment: Cloud The cloud deployment model is the fastest-growing segment, expected to capture a market share exceeding 60% by 2025, valued at approximately €45,000 Million. The shift towards cloud is attributed to its inherent advantages like agility, reduced infrastructure costs, and easier scalability. Economic policies promoting digital infrastructure and the widespread adoption of Software-as-a-Service (SaaS) models by enterprises are key enablers. Cloud BI solutions provide businesses with the flexibility to access powerful analytics tools without significant upfront capital investment.
End-User Industry: BFSI The Banking, Financial Services, and Insurance (BFSI) sector represents a leading end-user industry for BI solutions, with an estimated market size of €20,000 Million in 2025. This dominance stems from the highly data-intensive nature of the BFSI industry, where BI is crucial for risk management, fraud detection, customer analytics, regulatory compliance, and personalized financial product offerings. Economic policies encouraging financial inclusion and digital transformation within the banking sector further amplify the demand for advanced BI tools.
End-User Industry: IT and Telecommunication The IT and Telecommunication sector is another significant market for BI, projected at €15,000 Million in 2025. This industry leverages BI for network performance monitoring, customer churn prediction, service optimization, and cybersecurity analytics. The rapidly evolving technological landscape and the constant need to improve service delivery and customer experience drive the adoption of BI solutions.
End-User Industry: Retail The Retail sector is a rapidly growing consumer of BI, with an estimated market value of €12,000 Million in 2025. BI is instrumental for inventory management, sales forecasting, customer segmentation, personalized marketing campaigns, and optimizing supply chains. E-commerce growth and the increasing focus on customer-centric strategies fuel the demand for BI tools in this segment.
BI Market Product Developments
The BI market is characterized by continuous product innovation, with a focus on democratizing data access and enhancing analytical capabilities. Key developments include the integration of Artificial Intelligence (AI) and Machine Learning (ML) into BI platforms, enabling more sophisticated predictive and prescriptive analytics. Advancements in data visualization techniques offer more intuitive and interactive ways to explore complex datasets, making insights accessible to a broader audience. Self-service BI tools are increasingly empowering business users, reducing reliance on IT departments. Furthermore, the development of cloud-native BI solutions emphasizes scalability, flexibility, and real-time data processing, catering to the dynamic needs of modern enterprises. These innovations aim to provide a competitive advantage by enabling faster, more informed decision-making and optimizing business processes.
Report Scope & Segmentation Analysis
This report offers a comprehensive analysis of the global Business Intelligence (BI) market, covering its intricate segmentation. The market is analyzed across key Components, including Software and Platform (estimated market size of €65,000 Million in 2025) and Services (estimated market size of €25,000 Million in 2025). Deployment models are dissected into On-Premise (estimated market size of €30,000 Million in 2025) and Cloud (estimated market size of €45,000 Million in 2025). The End-User Industry segmentation encompasses BFSI (estimated market size of €20,000 Million in 2025), IT and Telecommunication (estimated market size of €15,000 Million in 2025), Retail (estimated market size of €12,000 Million in 2025), Healthcare (estimated market size of €9,000 Million in 2025), and Other End-User Industries (estimated market size of €14,000 Million in 2025). Each segment is analyzed for its growth projections, market size, and competitive dynamics, providing stakeholders with detailed insights.
Key Drivers of BI Market Growth
The BI market's growth is propelled by several interconnected factors. Technological advancements, particularly the integration of Artificial Intelligence (AI) and Machine Learning (ML) into BI platforms, are a primary driver, enabling predictive analytics and automated insights. The exponential growth in data volume across all industries necessitates sophisticated tools for analysis and interpretation. Furthermore, the increasing emphasis on data-driven decision-making and the need for enhanced operational efficiency and customer experience are compelling organizations to invest in BI solutions. Supportive government initiatives promoting digital transformation and the growing adoption of cloud-based BI solutions, offering scalability and cost-effectiveness, also contribute significantly to market expansion.
Challenges in the BI Market Sector
Despite its robust growth, the BI market faces several challenges. Data security and privacy concerns remain paramount, with stringent regulations like GDPR and CCPA requiring significant compliance efforts from BI vendors and users. The complexity of integrating diverse data sources and ensuring data quality can hinder the effective deployment and utilization of BI solutions. A shortage of skilled data scientists and analysts poses another significant barrier, limiting the ability of organizations to fully leverage their BI investments. Additionally, the high cost of advanced BI solutions and the need for substantial upfront investment in infrastructure can be prohibitive for small and medium-sized enterprises (SMEs), impacting market penetration in certain segments.
Emerging Opportunities in BI Market
The BI market presents numerous emerging opportunities driven by evolving technological landscapes and business needs. The increasing adoption of AI and ML for advanced analytics, such as predictive and prescriptive modeling, offers significant growth potential. The expansion of the Internet of Things (IoT) generates massive amounts of real-time data, creating a demand for BI solutions capable of handling and analyzing this influx. The growing trend of embedded analytics, where BI functionalities are integrated directly into business applications, provides new avenues for market reach. Furthermore, the focus on democratizing data through user-friendly self-service BI tools and natural language processing (NLP) opens up opportunities to cater to a wider user base, including non-technical professionals. Emerging economies with rapidly digitizing industries also represent significant untapped markets.
Leading Players in the BI Market Market
- SAS Institute Inc
- GoodData Corporation
- Cisco Systems Inc
- Microsoft Corporation
- Rackspace US Inc
- International Business Machines Corporation
- Tableau Software Inc (Salesforce)
- Oracle Corporation
- Targit AS
- VMware Inc
- SAP SE
Key Developments in BI Market Industry
- May 2023: Rackspace US Inc announced Object Storage, enabling organizations to securely store and utilize large pools of unstructured data. This solution saves substantial costs by eliminating data egress, retrieval, and transaction charges, offering over 80% savings compared to hyper-scale cloud storage options for multi-cloud customers operating modern S3-enabled applications, facilitating better performance and lower costs for data-intensive applications.
- May 2023: GoodData announced the release of its new Last Mile ETL feature. This enhancement streamlines data management processes, maximizing data velocity and enabling more effective use of time and resources for customers. It fully supports changes made to the logical data model (LDM) within the GoodData interface without affecting the data and data structure in a user's database.
Strategic Outlook for BI Market Market
The strategic outlook for the BI market is exceptionally positive, driven by the continued digital transformation across industries and the increasing recognition of data's strategic value. Future growth will be fueled by the deeper integration of AI and ML, leading to more sophisticated predictive and prescriptive analytics capabilities. The expansion of cloud-native BI solutions will further democratize access to powerful analytical tools, reducing cost barriers and increasing agility. The increasing demand for real-time insights and the proliferation of IoT data will create significant opportunities for scalable and robust BI platforms. Moreover, advancements in user experience, including natural language querying and intuitive visualization, will empower a broader range of users, fostering a data-driven culture within organizations and driving greater adoption across all sectors.
BI Market Segmentation
-
1. Component
- 1.1. Software and Platform
- 1.2. Services
-
2. Deployment
- 2.1. On-Premise
- 2.2. Cloud
-
3. End-User Industry
- 3.1. BFSI
- 3.2. IT and Telecommunication
- 3.3. Retail
- 3.4. Healthcare
- 3.5. Other End-User Industries
BI Market Segmentation By Geography
- 1. North America
- 2. Europe
- 3. Asia
- 4. Australia and New Zealand
- 5. Latin America
- 6. Middle East and Africa
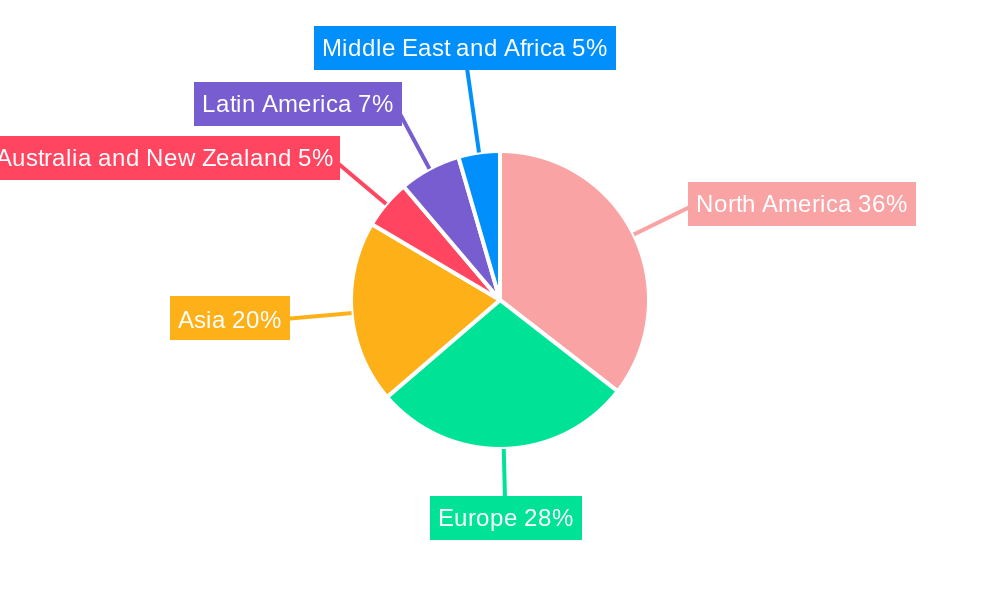
BI Market Regional Market Share
Geographic Coverage of BI Market
BI Market REPORT HIGHLIGHTS
| Aspects | Details |
|---|---|
| Study Period | 2020-2034 |
| Base Year | 2025 |
| Estimated Year | 2026 |
| Forecast Period | 2026-2034 |
| Historical Period | 2020-2025 |
| Growth Rate | CAGR of 13.16% from 2020-2034 |
| Segmentation |
|
Table of Contents
- 1. Introduction
- 1.1. Research Scope
- 1.2. Market Segmentation
- 1.3. Research Methodology
- 1.4. Definitions and Assumptions
- 2. Executive Summary
- 2.1. Introduction
- 3. Market Dynamics
- 3.1. Introduction
- 3.2. Market Drivers
- 3.2.1. Increasing Adoption of Data Analytics by Enterprises; Emergence of IoT-Enabled Technologies
- 3.3. Market Restrains
- 3.3.1. High Investment Costs for On-Premise Solutions; Lack of Skilled Professionals
- 3.4. Market Trends
- 3.4.1. BFSI Industry is Expected to Drive the Market Growth
- 4. Market Factor Analysis
- 4.1. Porters Five Forces
- 4.2. Supply/Value Chain
- 4.3. PESTEL analysis
- 4.4. Market Entropy
- 4.5. Patent/Trademark Analysis
- 5. Global BI Market Analysis, Insights and Forecast, 2020-2032
- 5.1. Market Analysis, Insights and Forecast - by Component
- 5.1.1. Software and Platform
- 5.1.2. Services
- 5.2. Market Analysis, Insights and Forecast - by Deployment
- 5.2.1. On-Premise
- 5.2.2. Cloud
- 5.3. Market Analysis, Insights and Forecast - by End-User Industry
- 5.3.1. BFSI
- 5.3.2. IT and Telecommunication
- 5.3.3. Retail
- 5.3.4. Healthcare
- 5.3.5. Other End-User Industries
- 5.4. Market Analysis, Insights and Forecast - by Region
- 5.4.1. North America
- 5.4.2. Europe
- 5.4.3. Asia
- 5.4.4. Australia and New Zealand
- 5.4.5. Latin America
- 5.4.6. Middle East and Africa
- 5.1. Market Analysis, Insights and Forecast - by Component
- 6. North America BI Market Analysis, Insights and Forecast, 2020-2032
- 6.1. Market Analysis, Insights and Forecast - by Component
- 6.1.1. Software and Platform
- 6.1.2. Services
- 6.2. Market Analysis, Insights and Forecast - by Deployment
- 6.2.1. On-Premise
- 6.2.2. Cloud
- 6.3. Market Analysis, Insights and Forecast - by End-User Industry
- 6.3.1. BFSI
- 6.3.2. IT and Telecommunication
- 6.3.3. Retail
- 6.3.4. Healthcare
- 6.3.5. Other End-User Industries
- 6.1. Market Analysis, Insights and Forecast - by Component
- 7. Europe BI Market Analysis, Insights and Forecast, 2020-2032
- 7.1. Market Analysis, Insights and Forecast - by Component
- 7.1.1. Software and Platform
- 7.1.2. Services
- 7.2. Market Analysis, Insights and Forecast - by Deployment
- 7.2.1. On-Premise
- 7.2.2. Cloud
- 7.3. Market Analysis, Insights and Forecast - by End-User Industry
- 7.3.1. BFSI
- 7.3.2. IT and Telecommunication
- 7.3.3. Retail
- 7.3.4. Healthcare
- 7.3.5. Other End-User Industries
- 7.1. Market Analysis, Insights and Forecast - by Component
- 8. Asia BI Market Analysis, Insights and Forecast, 2020-2032
- 8.1. Market Analysis, Insights and Forecast - by Component
- 8.1.1. Software and Platform
- 8.1.2. Services
- 8.2. Market Analysis, Insights and Forecast - by Deployment
- 8.2.1. On-Premise
- 8.2.2. Cloud
- 8.3. Market Analysis, Insights and Forecast - by End-User Industry
- 8.3.1. BFSI
- 8.3.2. IT and Telecommunication
- 8.3.3. Retail
- 8.3.4. Healthcare
- 8.3.5. Other End-User Industries
- 8.1. Market Analysis, Insights and Forecast - by Component
- 9. Australia and New Zealand BI Market Analysis, Insights and Forecast, 2020-2032
- 9.1. Market Analysis, Insights and Forecast - by Component
- 9.1.1. Software and Platform
- 9.1.2. Services
- 9.2. Market Analysis, Insights and Forecast - by Deployment
- 9.2.1. On-Premise
- 9.2.2. Cloud
- 9.3. Market Analysis, Insights and Forecast - by End-User Industry
- 9.3.1. BFSI
- 9.3.2. IT and Telecommunication
- 9.3.3. Retail
- 9.3.4. Healthcare
- 9.3.5. Other End-User Industries
- 9.1. Market Analysis, Insights and Forecast - by Component
- 10. Latin America BI Market Analysis, Insights and Forecast, 2020-2032
- 10.1. Market Analysis, Insights and Forecast - by Component
- 10.1.1. Software and Platform
- 10.1.2. Services
- 10.2. Market Analysis, Insights and Forecast - by Deployment
- 10.2.1. On-Premise
- 10.2.2. Cloud
- 10.3. Market Analysis, Insights and Forecast - by End-User Industry
- 10.3.1. BFSI
- 10.3.2. IT and Telecommunication
- 10.3.3. Retail
- 10.3.4. Healthcare
- 10.3.5. Other End-User Industries
- 10.1. Market Analysis, Insights and Forecast - by Component
- 11. Middle East and Africa BI Market Analysis, Insights and Forecast, 2020-2032
- 11.1. Market Analysis, Insights and Forecast - by Component
- 11.1.1. Software and Platform
- 11.1.2. Services
- 11.2. Market Analysis, Insights and Forecast - by Deployment
- 11.2.1. On-Premise
- 11.2.2. Cloud
- 11.3. Market Analysis, Insights and Forecast - by End-User Industry
- 11.3.1. BFSI
- 11.3.2. IT and Telecommunication
- 11.3.3. Retail
- 11.3.4. Healthcare
- 11.3.5. Other End-User Industries
- 11.1. Market Analysis, Insights and Forecast - by Component
- 12. Competitive Analysis
- 12.1. Global Market Share Analysis 2025
- 12.2. Company Profiles
- 12.2.1 SAS Institute Inc
- 12.2.1.1. Overview
- 12.2.1.2. Products
- 12.2.1.3. SWOT Analysis
- 12.2.1.4. Recent Developments
- 12.2.1.5. Financials (Based on Availability)
- 12.2.2 GoodData Corporation
- 12.2.2.1. Overview
- 12.2.2.2. Products
- 12.2.2.3. SWOT Analysis
- 12.2.2.4. Recent Developments
- 12.2.2.5. Financials (Based on Availability)
- 12.2.3 Cisco Systems Inc
- 12.2.3.1. Overview
- 12.2.3.2. Products
- 12.2.3.3. SWOT Analysis
- 12.2.3.4. Recent Developments
- 12.2.3.5. Financials (Based on Availability)
- 12.2.4 Microsoft Corporation
- 12.2.4.1. Overview
- 12.2.4.2. Products
- 12.2.4.3. SWOT Analysis
- 12.2.4.4. Recent Developments
- 12.2.4.5. Financials (Based on Availability)
- 12.2.5 Rackspace US Inc
- 12.2.5.1. Overview
- 12.2.5.2. Products
- 12.2.5.3. SWOT Analysis
- 12.2.5.4. Recent Developments
- 12.2.5.5. Financials (Based on Availability)
- 12.2.6 International Business Machines Corporation
- 12.2.6.1. Overview
- 12.2.6.2. Products
- 12.2.6.3. SWOT Analysis
- 12.2.6.4. Recent Developments
- 12.2.6.5. Financials (Based on Availability)
- 12.2.7 Tableau Software Inc (Salesforce)*List Not Exhaustive
- 12.2.7.1. Overview
- 12.2.7.2. Products
- 12.2.7.3. SWOT Analysis
- 12.2.7.4. Recent Developments
- 12.2.7.5. Financials (Based on Availability)
- 12.2.8 Oracle Corporation
- 12.2.8.1. Overview
- 12.2.8.2. Products
- 12.2.8.3. SWOT Analysis
- 12.2.8.4. Recent Developments
- 12.2.8.5. Financials (Based on Availability)
- 12.2.9 Targit AS
- 12.2.9.1. Overview
- 12.2.9.2. Products
- 12.2.9.3. SWOT Analysis
- 12.2.9.4. Recent Developments
- 12.2.9.5. Financials (Based on Availability)
- 12.2.10 VMware Inc
- 12.2.10.1. Overview
- 12.2.10.2. Products
- 12.2.10.3. SWOT Analysis
- 12.2.10.4. Recent Developments
- 12.2.10.5. Financials (Based on Availability)
- 12.2.11 SAP SE
- 12.2.11.1. Overview
- 12.2.11.2. Products
- 12.2.11.3. SWOT Analysis
- 12.2.11.4. Recent Developments
- 12.2.11.5. Financials (Based on Availability)
- 12.2.1 SAS Institute Inc
List of Figures
- Figure 1: Global BI Market Revenue Breakdown (Million, %) by Region 2025 & 2033
- Figure 2: North America BI Market Revenue (Million), by Component 2025 & 2033
- Figure 3: North America BI Market Revenue Share (%), by Component 2025 & 2033
- Figure 4: North America BI Market Revenue (Million), by Deployment 2025 & 2033
- Figure 5: North America BI Market Revenue Share (%), by Deployment 2025 & 2033
- Figure 6: North America BI Market Revenue (Million), by End-User Industry 2025 & 2033
- Figure 7: North America BI Market Revenue Share (%), by End-User Industry 2025 & 2033
- Figure 8: North America BI Market Revenue (Million), by Country 2025 & 2033
- Figure 9: North America BI Market Revenue Share (%), by Country 2025 & 2033
- Figure 10: Europe BI Market Revenue (Million), by Component 2025 & 2033
- Figure 11: Europe BI Market Revenue Share (%), by Component 2025 & 2033
- Figure 12: Europe BI Market Revenue (Million), by Deployment 2025 & 2033
- Figure 13: Europe BI Market Revenue Share (%), by Deployment 2025 & 2033
- Figure 14: Europe BI Market Revenue (Million), by End-User Industry 2025 & 2033
- Figure 15: Europe BI Market Revenue Share (%), by End-User Industry 2025 & 2033
- Figure 16: Europe BI Market Revenue (Million), by Country 2025 & 2033
- Figure 17: Europe BI Market Revenue Share (%), by Country 2025 & 2033
- Figure 18: Asia BI Market Revenue (Million), by Component 2025 & 2033
- Figure 19: Asia BI Market Revenue Share (%), by Component 2025 & 2033
- Figure 20: Asia BI Market Revenue (Million), by Deployment 2025 & 2033
- Figure 21: Asia BI Market Revenue Share (%), by Deployment 2025 & 2033
- Figure 22: Asia BI Market Revenue (Million), by End-User Industry 2025 & 2033
- Figure 23: Asia BI Market Revenue Share (%), by End-User Industry 2025 & 2033
- Figure 24: Asia BI Market Revenue (Million), by Country 2025 & 2033
- Figure 25: Asia BI Market Revenue Share (%), by Country 2025 & 2033
- Figure 26: Australia and New Zealand BI Market Revenue (Million), by Component 2025 & 2033
- Figure 27: Australia and New Zealand BI Market Revenue Share (%), by Component 2025 & 2033
- Figure 28: Australia and New Zealand BI Market Revenue (Million), by Deployment 2025 & 2033
- Figure 29: Australia and New Zealand BI Market Revenue Share (%), by Deployment 2025 & 2033
- Figure 30: Australia and New Zealand BI Market Revenue (Million), by End-User Industry 2025 & 2033
- Figure 31: Australia and New Zealand BI Market Revenue Share (%), by End-User Industry 2025 & 2033
- Figure 32: Australia and New Zealand BI Market Revenue (Million), by Country 2025 & 2033
- Figure 33: Australia and New Zealand BI Market Revenue Share (%), by Country 2025 & 2033
- Figure 34: Latin America BI Market Revenue (Million), by Component 2025 & 2033
- Figure 35: Latin America BI Market Revenue Share (%), by Component 2025 & 2033
- Figure 36: Latin America BI Market Revenue (Million), by Deployment 2025 & 2033
- Figure 37: Latin America BI Market Revenue Share (%), by Deployment 2025 & 2033
- Figure 38: Latin America BI Market Revenue (Million), by End-User Industry 2025 & 2033
- Figure 39: Latin America BI Market Revenue Share (%), by End-User Industry 2025 & 2033
- Figure 40: Latin America BI Market Revenue (Million), by Country 2025 & 2033
- Figure 41: Latin America BI Market Revenue Share (%), by Country 2025 & 2033
- Figure 42: Middle East and Africa BI Market Revenue (Million), by Component 2025 & 2033
- Figure 43: Middle East and Africa BI Market Revenue Share (%), by Component 2025 & 2033
- Figure 44: Middle East and Africa BI Market Revenue (Million), by Deployment 2025 & 2033
- Figure 45: Middle East and Africa BI Market Revenue Share (%), by Deployment 2025 & 2033
- Figure 46: Middle East and Africa BI Market Revenue (Million), by End-User Industry 2025 & 2033
- Figure 47: Middle East and Africa BI Market Revenue Share (%), by End-User Industry 2025 & 2033
- Figure 48: Middle East and Africa BI Market Revenue (Million), by Country 2025 & 2033
- Figure 49: Middle East and Africa BI Market Revenue Share (%), by Country 2025 & 2033
List of Tables
- Table 1: Global BI Market Revenue Million Forecast, by Component 2020 & 2033
- Table 2: Global BI Market Revenue Million Forecast, by Deployment 2020 & 2033
- Table 3: Global BI Market Revenue Million Forecast, by End-User Industry 2020 & 2033
- Table 4: Global BI Market Revenue Million Forecast, by Region 2020 & 2033
- Table 5: Global BI Market Revenue Million Forecast, by Component 2020 & 2033
- Table 6: Global BI Market Revenue Million Forecast, by Deployment 2020 & 2033
- Table 7: Global BI Market Revenue Million Forecast, by End-User Industry 2020 & 2033
- Table 8: Global BI Market Revenue Million Forecast, by Country 2020 & 2033
- Table 9: Global BI Market Revenue Million Forecast, by Component 2020 & 2033
- Table 10: Global BI Market Revenue Million Forecast, by Deployment 2020 & 2033
- Table 11: Global BI Market Revenue Million Forecast, by End-User Industry 2020 & 2033
- Table 12: Global BI Market Revenue Million Forecast, by Country 2020 & 2033
- Table 13: Global BI Market Revenue Million Forecast, by Component 2020 & 2033
- Table 14: Global BI Market Revenue Million Forecast, by Deployment 2020 & 2033
- Table 15: Global BI Market Revenue Million Forecast, by End-User Industry 2020 & 2033
- Table 16: Global BI Market Revenue Million Forecast, by Country 2020 & 2033
- Table 17: Global BI Market Revenue Million Forecast, by Component 2020 & 2033
- Table 18: Global BI Market Revenue Million Forecast, by Deployment 2020 & 2033
- Table 19: Global BI Market Revenue Million Forecast, by End-User Industry 2020 & 2033
- Table 20: Global BI Market Revenue Million Forecast, by Country 2020 & 2033
- Table 21: Global BI Market Revenue Million Forecast, by Component 2020 & 2033
- Table 22: Global BI Market Revenue Million Forecast, by Deployment 2020 & 2033
- Table 23: Global BI Market Revenue Million Forecast, by End-User Industry 2020 & 2033
- Table 24: Global BI Market Revenue Million Forecast, by Country 2020 & 2033
- Table 25: Global BI Market Revenue Million Forecast, by Component 2020 & 2033
- Table 26: Global BI Market Revenue Million Forecast, by Deployment 2020 & 2033
- Table 27: Global BI Market Revenue Million Forecast, by End-User Industry 2020 & 2033
- Table 28: Global BI Market Revenue Million Forecast, by Country 2020 & 2033
Frequently Asked Questions
1. What is the projected Compound Annual Growth Rate (CAGR) of the BI Market?
The projected CAGR is approximately 13.16%.
2. Which companies are prominent players in the BI Market?
Key companies in the market include SAS Institute Inc, GoodData Corporation, Cisco Systems Inc, Microsoft Corporation, Rackspace US Inc, International Business Machines Corporation, Tableau Software Inc (Salesforce)*List Not Exhaustive, Oracle Corporation, Targit AS, VMware Inc, SAP SE.
3. What are the main segments of the BI Market?
The market segments include Component, Deployment, End-User Industry.
4. Can you provide details about the market size?
The market size is estimated to be USD 33.34 Million as of 2022.
5. What are some drivers contributing to market growth?
Increasing Adoption of Data Analytics by Enterprises; Emergence of IoT-Enabled Technologies.
6. What are the notable trends driving market growth?
BFSI Industry is Expected to Drive the Market Growth.
7. Are there any restraints impacting market growth?
High Investment Costs for On-Premise Solutions; Lack of Skilled Professionals.
8. Can you provide examples of recent developments in the market?
May 2023: Rackspace US Inc announced Object Storage which enables organizations securely store and utilize large pools of unstructured data, where Rackspace Object Storage saves substantial costs by eliminating data egress, retrieval, and transaction charges. In many cases, the Rackspace Object Storage solution can save more than 80% over hyper-scale cloud storage options. For multi-cloud customers operating modern S3-enabled applications, this is a new paradigm that facilitates better performance and lower costs, even as data-intensive applications continue to drive up the need for storage,
9. What pricing options are available for accessing the report?
Pricing options include single-user, multi-user, and enterprise licenses priced at USD 4750, USD 5250, and USD 8750 respectively.
10. Is the market size provided in terms of value or volume?
The market size is provided in terms of value, measured in Million.
11. Are there any specific market keywords associated with the report?
Yes, the market keyword associated with the report is "BI Market," which aids in identifying and referencing the specific market segment covered.
12. How do I determine which pricing option suits my needs best?
The pricing options vary based on user requirements and access needs. Individual users may opt for single-user licenses, while businesses requiring broader access may choose multi-user or enterprise licenses for cost-effective access to the report.
13. Are there any additional resources or data provided in the BI Market report?
While the report offers comprehensive insights, it's advisable to review the specific contents or supplementary materials provided to ascertain if additional resources or data are available.
14. How can I stay updated on further developments or reports in the BI Market?
To stay informed about further developments, trends, and reports in the BI Market, consider subscribing to industry newsletters, following relevant companies and organizations, or regularly checking reputable industry news sources and publications.
Methodology
Step 1 - Identification of Relevant Samples Size from Population Database


Step 2 - Approaches for Defining Global Market Size (Value, Volume* & Price*)

Note*: In applicable scenarios
Step 3 - Data Sources
Primary Research
- Web Analytics
- Survey Reports
- Research Institute
- Latest Research Reports
- Opinion Leaders
Secondary Research
- Annual Reports
- White Paper
- Latest Press Release
- Industry Association
- Paid Database
- Investor Presentations

Step 4 - Data Triangulation
Involves using different sources of information in order to increase the validity of a study
These sources are likely to be stakeholders in a program - participants, other researchers, program staff, other community members, and so on.
Then we put all data in single framework & apply various statistical tools to find out the dynamic on the market.
During the analysis stage, feedback from the stakeholder groups would be compared to determine areas of agreement as well as areas of divergence