
Key Insights
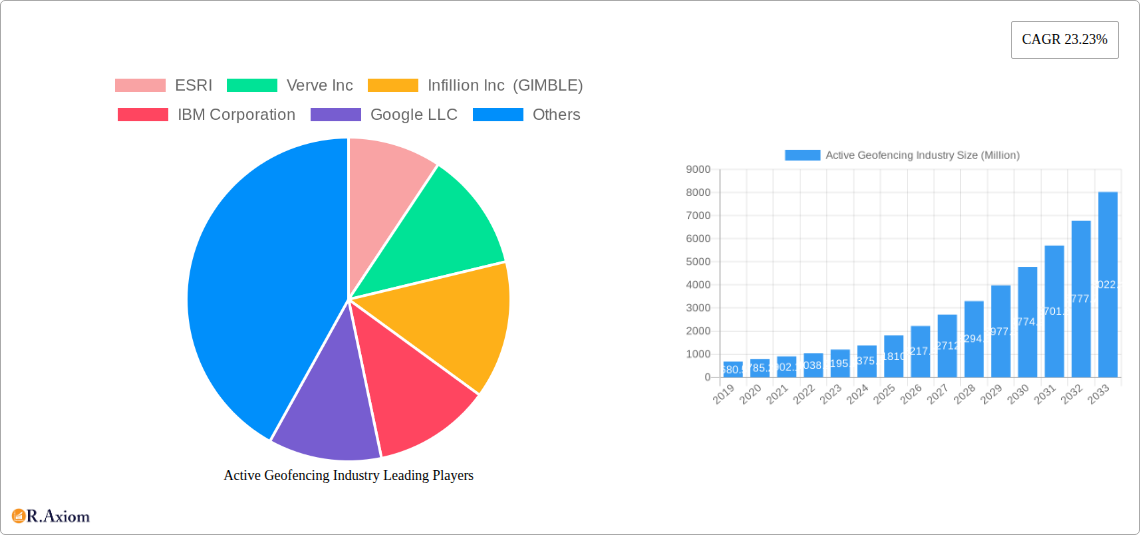
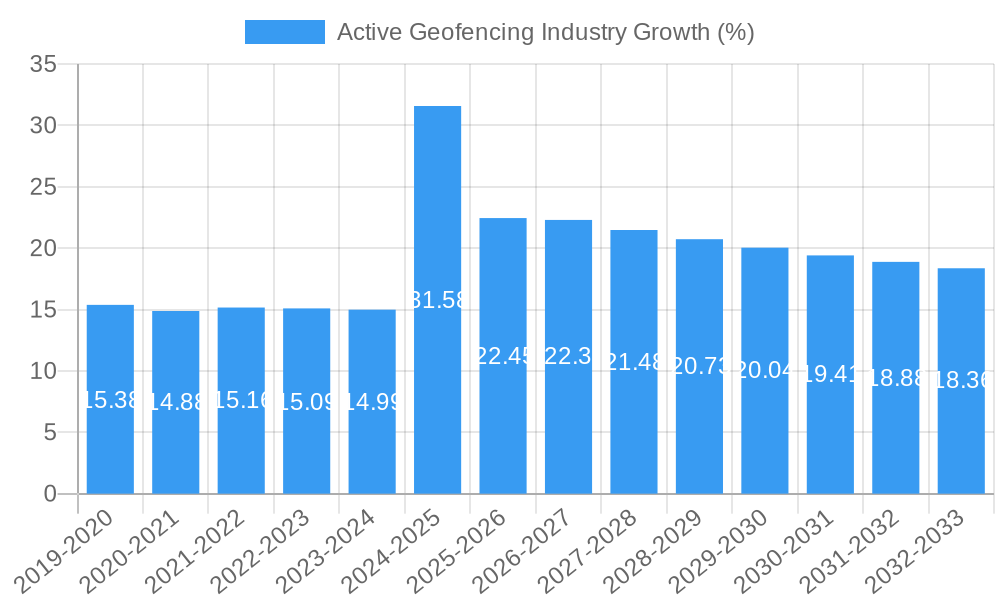
The global Active Geofencing Industry is poised for substantial growth, projected to reach an estimated USD 1.81 billion in 2025, driven by a remarkable Compound Annual Growth Rate (CAGR) of 23.23% throughout the forecast period of 2025-2033. This rapid expansion is fueled by increasing adoption of location-aware technologies across diverse sectors, enabling businesses to deliver contextually relevant experiences and optimize operations. Key drivers include the burgeoning demand for personalized marketing campaigns, enhanced operational efficiency through real-time asset tracking and management, and improved safety and security protocols in various industries. The proliferation of smart devices and the growing comfort with location-based services are creating a fertile ground for geofencing solutions to flourish. Furthermore, advancements in AI and IoT are augmenting the capabilities of geofencing, leading to more sophisticated and intelligent applications that promise to revolutionize how businesses interact with their customers and manage their resources.
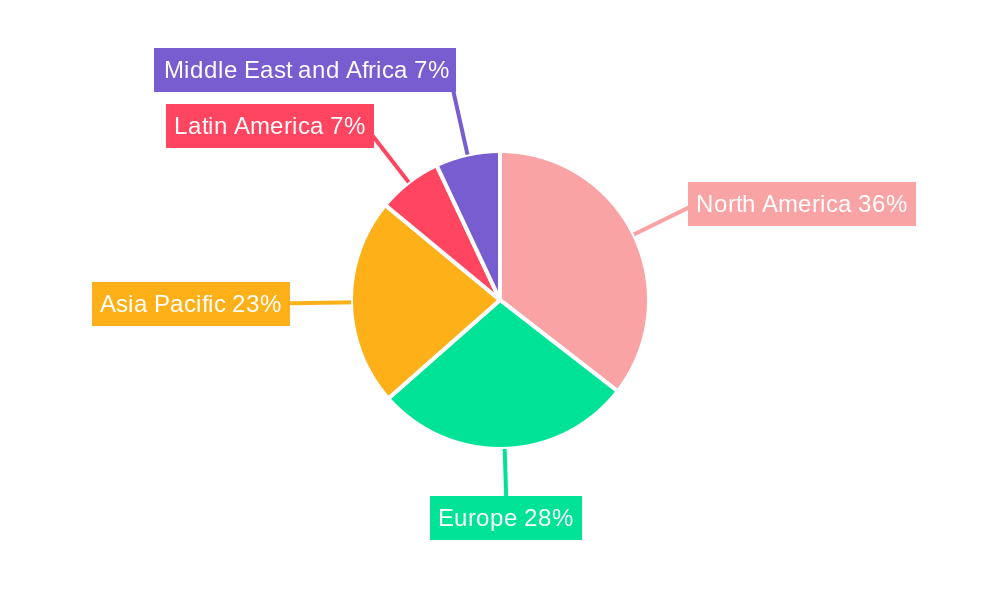
The market is characterized by a dynamic segmentation landscape, with Small-Scale and Medium-Scale Businesses increasingly leveraging cost-effective geofencing solutions to compete with larger enterprises. Large-Scale Businesses continue to be significant adopters, integrating geofencing into their complex operational frameworks. Major end-user industries such as Banking, Financial Services, and Insurance (BFSI), Retail, Healthcare, and Transportation and Logistics are at the forefront of this adoption curve, utilizing geofencing for everything from targeted promotions and fraud detection to patient management and supply chain optimization. Emerging applications in Defense, Government, and Military sectors further underscore the versatility and critical importance of active geofencing. Key industry players like IBM Corporation, Google LLC, Microsoft Corporation, and Apple Inc. are heavily investing in R&D and strategic partnerships, intensifying competition and fostering innovation to capture a larger share of this rapidly evolving market. The geographical landscape indicates a strong presence and continued growth in North America and Europe, with the Asia Pacific region exhibiting the highest growth potential due to rapid digitalization and increasing mobile penetration.
Active Geofencing Industry Market Concentration & Innovation
The active geofencing industry is characterized by a moderate level of market concentration, with a few key players holding significant market share, estimated at over 60% combined. Innovation is primarily driven by advancements in location-based technologies, artificial intelligence for real-time analytics, and the increasing demand for personalized customer experiences. Regulatory frameworks are evolving, particularly concerning data privacy and consent, influencing how geofencing solutions are developed and deployed. Product substitutes, such as broad location targeting or manual customer identification, exist but lack the precision and automation offered by geofencing. End-user trends favor hyper-local marketing, enhanced operational efficiency, and improved customer engagement, with a growing emphasis on privacy-preserving geofencing techniques. Mergers and acquisitions are a notable feature, with significant M&A deal values in the tens of millions to hundreds of millions of dollars, as larger tech firms and specialized location analytics providers consolidate capabilities and expand their market reach. Key M&A activities aim to integrate advanced geofencing functionalities into broader platform offerings, strengthening competitive moats and accelerating innovation cycles.
Active Geofencing Industry Industry Trends & Insights
The active geofencing industry is experiencing robust growth, fueled by an increasing reliance on location-aware technologies across diverse business sectors. The market is projected to expand at a compound annual growth rate (CAGR) of approximately 25% from 2025 to 2033. Market penetration is steadily rising, with an estimated 35% of businesses in key sectors already leveraging some form of geofencing for operational or marketing purposes, and this figure is expected to exceed 70% by the end of the forecast period. A primary growth driver is the escalating demand for personalized marketing campaigns that deliver highly relevant offers and messages to consumers based on their real-time proximity to physical locations. This hyper-localization strategy demonstrably enhances conversion rates and customer loyalty.
Technological disruptions are continuously reshaping the landscape. The integration of AI and machine learning with geofencing platforms is enabling more sophisticated predictive analytics, allowing businesses to anticipate customer behavior and optimize resource allocation. For instance, AI-powered geofencing can predict peak customer traffic hours, enabling proactive staffing and inventory management in retail and quick-service restaurants. Furthermore, advancements in GPS accuracy and the proliferation of IoT devices are expanding the reach and reliability of geofencing applications beyond mobile devices.
Consumer preferences are increasingly shifting towards personalized and seamless experiences. Geofencing facilitates this by enabling "just-in-time" notifications, location-based loyalty programs, and frictionless check-ins or payments. As privacy concerns grow, there is a concurrent trend towards privacy-preserving geofencing techniques, such as differential privacy and on-device processing, which build user trust and ensure compliance with evolving data protection regulations.
Competitive dynamics within the active geofencing industry are characterized by innovation and strategic partnerships. Companies are investing heavily in R&D to develop more accurate, scalable, and feature-rich geofencing solutions. The competitive landscape sees a mix of large technology providers, specialized location intelligence firms, and niche solution developers. Strategic alliances and collaborations are common, as companies aim to integrate geofencing capabilities into broader marketing automation, CRM, and analytics platforms to offer comprehensive, end-to-end solutions. The emphasis is on providing actionable insights derived from location data, moving beyond simple boundary alerts to sophisticated behavioral analysis and automated response mechanisms.
Dominant Markets & Segments in Active Geofencing Industry
The Retail end-user industry stands out as a dominant market for active geofencing solutions. This dominance is propelled by the sector's intrinsic need for proximity-based marketing, customer engagement, and operational efficiency. Retailers leverage geofencing for a multitude of applications, including sending personalized promotional offers to shoppers entering a store's vicinity, triggering loyalty program rewards, optimizing in-store experiences through foot traffic analysis, and enabling "buy online, pick up in-store" (BOPIS) services by alerting staff when a customer is en route. The economic policies favoring consumer spending and the competitive nature of retail drive significant investment in technologies that can provide a tangible return on investment.
Transportation and Logistics is another highly dominant segment, driven by the critical need for real-time tracking, route optimization, and delivery management. Geofencing enables logistics companies to monitor vehicle movements, ensure adherence to delivery schedules, trigger automated alerts for arrival and departure at depots or customer sites, and manage fleet operations more efficiently. The infrastructure supporting robust logistics networks, coupled with the economic imperative for cost reduction and timely delivery, makes geofencing an indispensable tool.
Within Organization Size, Large-Scale Businesses are currently the primary adopters and drivers of the active geofencing market. Their extensive resources, broader customer bases, and complex operational needs necessitate sophisticated location intelligence solutions. However, Small-Scale and Medium-Scale Businesses are rapidly increasing their adoption, driven by the availability of more accessible and affordable geofencing tools and platforms, recognizing the potential for competitive advantage even with limited budgets.
The Banking, Financial Services, and Insurance (BFSI) sector is also a significant and growing market. Geofencing is employed for fraud detection by flagging unusual transaction locations, enabling targeted offers for financial products to customers in specific areas, and facilitating personalized customer service by alerting bank representatives when a valued client is nearby. Regulatory frameworks in BFSI often mandate stringent security measures, and geofencing can contribute to enhanced security protocols.
The Government, and Military sector utilizes active geofencing for critical applications such as defense operations, border security, emergency response coordination, and public safety initiatives. The demand for precision, reliability, and real-time situational awareness in these high-stakes environments makes geofencing an invaluable technology.
Key Drivers for Retail Dominance:
- Hyper-local marketing effectiveness (e.g., driving foot traffic).
- Personalized customer offers and loyalty programs.
- Streamlined "buy online, pick up in-store" (BOPIS) operations.
- Enhanced in-store analytics and customer journey mapping.
- Competitive pressure to adopt innovative customer engagement strategies.
Key Drivers for Transportation and Logistics Dominance:
- Real-time fleet tracking and management.
- Route optimization and mileage tracking.
- Automated delivery notifications and proof of delivery.
- Enhanced supply chain visibility and efficiency.
- Cost reduction through optimized operations.
Active Geofencing Industry Product Developments
Active geofencing technology continues to evolve with a focus on enhanced accuracy, broader application integration, and improved privacy controls. Recent product developments include the integration of geofencing capabilities into sophisticated mapping platforms, offering developers tools to accurately trace complex paths and calculate distances from imprecise location data. Innovations are also centered around enabling geofencing for a wider range of devices beyond smartphones, including wearables and IoT sensors, expanding the scope for contextual awareness. Furthermore, product roadmaps emphasize AI-driven predictive analytics, allowing geofencing to trigger automated actions based on anticipated user behavior rather than just immediate presence. These advancements aim to unlock new use cases, from dynamic pricing in retail to proactive maintenance scheduling in industrial manufacturing, offering significant competitive advantages through more intelligent and responsive location-based services.
Report Scope & Segmentation Analysis
This report provides a comprehensive analysis of the active geofencing industry from 2019 to 2033, with a base year of 2025 and a forecast period extending to 2033. The market is segmented by Organization Size and End-User Industry.
Organization Size: The analysis covers Large-Scale Businesses, which are currently the dominant segment due to their substantial investment capacity and complex needs. Small-Scale and Medium-Scale Businesses are identified as a rapidly growing segment, driven by the increasing accessibility and affordability of geofencing solutions, with projected growth rates of over 30% annually within this segment.
End-User Industry: The report delves into key industries including Banking, Financial Services, and Insurance (BFSI), Retail, Defense, Government, and Military, Healthcare, Industrial Manufacturing, and Transportation and Logistics. Retail and Transportation & Logistics are projected to maintain their leading positions, with significant growth also anticipated in Healthcare and BFSI due to increasing demand for personalized services and enhanced security. The "Other End-user Industries" category captures emerging applications in sectors like media, events, and real estate.
Key Drivers of Active Geofencing Industry Growth
The growth of the active geofencing industry is primarily propelled by several interconnected factors. Technologically, the continuous improvement in GPS accuracy, the proliferation of mobile devices and IoT sensors, and advancements in cloud computing and AI are foundational. Economically, businesses across sectors are seeking to optimize operational efficiency and enhance customer engagement for competitive advantage, with geofencing offering tangible ROI through personalized marketing, targeted promotions, and streamlined logistics. Regulatory shifts, while sometimes posing challenges, also drive innovation towards more privacy-compliant solutions, fostering trust and broader adoption. The increasing demand for hyper-local marketing and personalized customer experiences is a significant consumer-driven factor, pushing businesses to adopt these advanced location-based strategies.
Challenges in the Active Geofencing Industry Sector
Despite its robust growth, the active geofencing industry faces several challenges. Privacy concerns and evolving data protection regulations, such as GDPR and CCPA, necessitate careful implementation and transparent user consent mechanisms, which can add complexity and cost. The accuracy of geofencing can be impacted by environmental factors like urban canyons or indoor environments, requiring sophisticated solutions to overcome. Ensuring seamless integration with existing IT infrastructure and legacy systems for many enterprises can be a significant hurdle. Furthermore, the competitive landscape is becoming increasingly crowded, leading to pricing pressures and the need for continuous innovation to differentiate offerings. Supply chain issues related to hardware components for IoT devices used in geofencing applications can also impact deployment timelines and costs.
Emerging Opportunities in Active Geofencing Industry
Emerging opportunities in the active geofencing industry are abundant, driven by evolving technological capabilities and shifting consumer expectations. The expansion of 5G networks promises lower latency and higher bandwidth, enabling more real-time and complex geofencing applications. The growing adoption of IoT devices across smart homes, industrial settings, and wearables creates new avenues for location-aware services and data collection. There is a significant opportunity in developing more sophisticated AI-driven predictive analytics that can anticipate user behavior based on geofencing data, leading to hyper-personalized services and proactive customer support. The increasing demand for privacy-preserving geofencing solutions also presents an opportunity for companies that can offer secure, transparent, and compliant location-based services. Furthermore, the untapped potential in emerging markets and niche industry applications offers substantial room for growth and specialization.
Leading Players in the Active Geofencing Industry Market
- ESRI
- Verve Inc
- Infillion Inc (GIMBLE)
- IBM Corporation
- Google LLC
- SZ DJI Technology Co
- Samsung Electronics Co
- LocationSmart
- Microsoft Corporation
- Radar Labs Inc
- Bluedot Innovation Pty Ltd
- Apple Inc
Key Developments in Active Geofencing Industry Industry
- December 2023: McDonald’s announced the expansion of its "Ready on Arrival" pilot program, which utilizes geofencing to alert employees when a mobile order customer is nearing the restaurant. This initiative aims to ensure customer food is ready upon arrival, enhancing efficiency and customer satisfaction, with plans to roll out to its top six markets by 2025.
- July 2023: Radar Labs Inc. introduced the Routr Matching API, a new addition to its Maps Platform. This development addresses challenges with fuzzy and imprecise location data from mobile devices or GPS units, aiming to improve the accuracy of tracing driving or walking paths and mileage calculations, further enhancing their comprehensive geofencing platform capabilities.
Strategic Outlook for Active Geofencing Industry Market
The strategic outlook for the active geofencing industry remains exceptionally strong, driven by an ongoing digital transformation across all business sectors and the increasing value placed on contextual, real-time data. Future growth will be catalyzed by the integration of geofencing with advanced technologies like AI, IoT, and 5G, enabling more sophisticated predictive analytics and automated decision-making. The focus will shift from basic location triggering to proactive, personalized engagement and operational optimization. Companies that can offer robust, privacy-compliant, and easily integrable geofencing solutions with clear ROI will lead the market. Strategic partnerships and acquisitions are expected to continue as firms seek to consolidate their positions and expand their service portfolios, creating a more interconnected and intelligent location-based service ecosystem. The market is poised for sustained innovation and widespread adoption across an expanding array of industries.
Active Geofencing Industry Segmentation
-
1. Organization Size
- 1.1. Small-Scale and Medium-Scale Businesses
- 1.2. Large-Scale Businesses
-
2. End-user Industry
- 2.1. Banking, Financial Services, and Insurance
- 2.2. Retail
- 2.3. Defense, Government, and Military
- 2.4. Healthcare
- 2.5. Industrial Manufacturing
- 2.6. Transportation and Logistics
- 2.7. Other End-user Industries
Active Geofencing Industry Segmentation By Geography
- 1. North America
- 2. Europe
- 3. Asia Pacific
- 4. Latin America
- 5. Middle East and Africa
Active Geofencing Industry REPORT HIGHLIGHTS
| Aspects | Details |
|---|---|
| Study Period | 2019-2033 |
| Base Year | 2024 |
| Estimated Year | 2025 |
| Forecast Period | 2025-2033 |
| Historical Period | 2019-2024 |
| Growth Rate | CAGR of 23.23% from 2019-2033 |
| Segmentation |
|
Table of Contents
- 1. Introduction
- 1.1. Research Scope
- 1.2. Market Segmentation
- 1.3. Research Methodology
- 1.4. Definitions and Assumptions
- 2. Executive Summary
- 2.1. Introduction
- 3. Market Dynamics
- 3.1. Introduction
- 3.2. Market Drivers
- 3.2.1. Increased Use of Spatial Data and Improved Real-time Location Technology; Higher Adoption of Location-based Application among Consumers
- 3.3. Market Restrains
- 3.3.1. Rising Awareness Regarding Safety and Security among Consumers of Location Tracking
- 3.4. Market Trends
- 3.4.1. Retail Segment to Witness Significant Growth
- 4. Market Factor Analysis
- 4.1. Porters Five Forces
- 4.2. Supply/Value Chain
- 4.3. PESTEL analysis
- 4.4. Market Entropy
- 4.5. Patent/Trademark Analysis
- 5. Global Active Geofencing Industry Analysis, Insights and Forecast, 2019-2031
- 5.1. Market Analysis, Insights and Forecast - by Organization Size
- 5.1.1. Small-Scale and Medium-Scale Businesses
- 5.1.2. Large-Scale Businesses
- 5.2. Market Analysis, Insights and Forecast - by End-user Industry
- 5.2.1. Banking, Financial Services, and Insurance
- 5.2.2. Retail
- 5.2.3. Defense, Government, and Military
- 5.2.4. Healthcare
- 5.2.5. Industrial Manufacturing
- 5.2.6. Transportation and Logistics
- 5.2.7. Other End-user Industries
- 5.3. Market Analysis, Insights and Forecast - by Region
- 5.3.1. North America
- 5.3.2. Europe
- 5.3.3. Asia Pacific
- 5.3.4. Latin America
- 5.3.5. Middle East and Africa
- 5.1. Market Analysis, Insights and Forecast - by Organization Size
- 6. North America Active Geofencing Industry Analysis, Insights and Forecast, 2019-2031
- 6.1. Market Analysis, Insights and Forecast - by Organization Size
- 6.1.1. Small-Scale and Medium-Scale Businesses
- 6.1.2. Large-Scale Businesses
- 6.2. Market Analysis, Insights and Forecast - by End-user Industry
- 6.2.1. Banking, Financial Services, and Insurance
- 6.2.2. Retail
- 6.2.3. Defense, Government, and Military
- 6.2.4. Healthcare
- 6.2.5. Industrial Manufacturing
- 6.2.6. Transportation and Logistics
- 6.2.7. Other End-user Industries
- 6.1. Market Analysis, Insights and Forecast - by Organization Size
- 7. Europe Active Geofencing Industry Analysis, Insights and Forecast, 2019-2031
- 7.1. Market Analysis, Insights and Forecast - by Organization Size
- 7.1.1. Small-Scale and Medium-Scale Businesses
- 7.1.2. Large-Scale Businesses
- 7.2. Market Analysis, Insights and Forecast - by End-user Industry
- 7.2.1. Banking, Financial Services, and Insurance
- 7.2.2. Retail
- 7.2.3. Defense, Government, and Military
- 7.2.4. Healthcare
- 7.2.5. Industrial Manufacturing
- 7.2.6. Transportation and Logistics
- 7.2.7. Other End-user Industries
- 7.1. Market Analysis, Insights and Forecast - by Organization Size
- 8. Asia Pacific Active Geofencing Industry Analysis, Insights and Forecast, 2019-2031
- 8.1. Market Analysis, Insights and Forecast - by Organization Size
- 8.1.1. Small-Scale and Medium-Scale Businesses
- 8.1.2. Large-Scale Businesses
- 8.2. Market Analysis, Insights and Forecast - by End-user Industry
- 8.2.1. Banking, Financial Services, and Insurance
- 8.2.2. Retail
- 8.2.3. Defense, Government, and Military
- 8.2.4. Healthcare
- 8.2.5. Industrial Manufacturing
- 8.2.6. Transportation and Logistics
- 8.2.7. Other End-user Industries
- 8.1. Market Analysis, Insights and Forecast - by Organization Size
- 9. Latin America Active Geofencing Industry Analysis, Insights and Forecast, 2019-2031
- 9.1. Market Analysis, Insights and Forecast - by Organization Size
- 9.1.1. Small-Scale and Medium-Scale Businesses
- 9.1.2. Large-Scale Businesses
- 9.2. Market Analysis, Insights and Forecast - by End-user Industry
- 9.2.1. Banking, Financial Services, and Insurance
- 9.2.2. Retail
- 9.2.3. Defense, Government, and Military
- 9.2.4. Healthcare
- 9.2.5. Industrial Manufacturing
- 9.2.6. Transportation and Logistics
- 9.2.7. Other End-user Industries
- 9.1. Market Analysis, Insights and Forecast - by Organization Size
- 10. Middle East and Africa Active Geofencing Industry Analysis, Insights and Forecast, 2019-2031
- 10.1. Market Analysis, Insights and Forecast - by Organization Size
- 10.1.1. Small-Scale and Medium-Scale Businesses
- 10.1.2. Large-Scale Businesses
- 10.2. Market Analysis, Insights and Forecast - by End-user Industry
- 10.2.1. Banking, Financial Services, and Insurance
- 10.2.2. Retail
- 10.2.3. Defense, Government, and Military
- 10.2.4. Healthcare
- 10.2.5. Industrial Manufacturing
- 10.2.6. Transportation and Logistics
- 10.2.7. Other End-user Industries
- 10.1. Market Analysis, Insights and Forecast - by Organization Size
- 11. North America Active Geofencing Industry Analysis, Insights and Forecast, 2019-2031
- 11.1. Market Analysis, Insights and Forecast - By Country/Sub-region
- 11.1.1 United States
- 11.1.2 Canada
- 11.1.3 Mexico
- 12. Europe Active Geofencing Industry Analysis, Insights and Forecast, 2019-2031
- 12.1. Market Analysis, Insights and Forecast - By Country/Sub-region
- 12.1.1 Germany
- 12.1.2 United Kingdom
- 12.1.3 France
- 12.1.4 Spain
- 12.1.5 Italy
- 12.1.6 Spain
- 12.1.7 Belgium
- 12.1.8 Netherland
- 12.1.9 Nordics
- 12.1.10 Rest of Europe
- 13. Asia Pacific Active Geofencing Industry Analysis, Insights and Forecast, 2019-2031
- 13.1. Market Analysis, Insights and Forecast - By Country/Sub-region
- 13.1.1 China
- 13.1.2 Japan
- 13.1.3 India
- 13.1.4 South Korea
- 13.1.5 Southeast Asia
- 13.1.6 Australia
- 13.1.7 Indonesia
- 13.1.8 Phillipes
- 13.1.9 Singapore
- 13.1.10 Thailandc
- 13.1.11 Rest of Asia Pacific
- 14. South America Active Geofencing Industry Analysis, Insights and Forecast, 2019-2031
- 14.1. Market Analysis, Insights and Forecast - By Country/Sub-region
- 14.1.1 Brazil
- 14.1.2 Argentina
- 14.1.3 Peru
- 14.1.4 Chile
- 14.1.5 Colombia
- 14.1.6 Ecuador
- 14.1.7 Venezuela
- 14.1.8 Rest of South America
- 15. North America Active Geofencing Industry Analysis, Insights and Forecast, 2019-2031
- 15.1. Market Analysis, Insights and Forecast - By Country/Sub-region
- 15.1.1 United States
- 15.1.2 Canada
- 15.1.3 Mexico
- 16. MEA Active Geofencing Industry Analysis, Insights and Forecast, 2019-2031
- 16.1. Market Analysis, Insights and Forecast - By Country/Sub-region
- 16.1.1 United Arab Emirates
- 16.1.2 Saudi Arabia
- 16.1.3 South Africa
- 16.1.4 Rest of Middle East and Africa
- 17. Competitive Analysis
- 17.1. Global Market Share Analysis 2024
- 17.2. Company Profiles
- 17.2.1 ESRI
- 17.2.1.1. Overview
- 17.2.1.2. Products
- 17.2.1.3. SWOT Analysis
- 17.2.1.4. Recent Developments
- 17.2.1.5. Financials (Based on Availability)
- 17.2.2 Verve Inc
- 17.2.2.1. Overview
- 17.2.2.2. Products
- 17.2.2.3. SWOT Analysis
- 17.2.2.4. Recent Developments
- 17.2.2.5. Financials (Based on Availability)
- 17.2.3 Infillion Inc (GIMBLE)
- 17.2.3.1. Overview
- 17.2.3.2. Products
- 17.2.3.3. SWOT Analysis
- 17.2.3.4. Recent Developments
- 17.2.3.5. Financials (Based on Availability)
- 17.2.4 IBM Corporation
- 17.2.4.1. Overview
- 17.2.4.2. Products
- 17.2.4.3. SWOT Analysis
- 17.2.4.4. Recent Developments
- 17.2.4.5. Financials (Based on Availability)
- 17.2.5 Google LLC
- 17.2.5.1. Overview
- 17.2.5.2. Products
- 17.2.5.3. SWOT Analysis
- 17.2.5.4. Recent Developments
- 17.2.5.5. Financials (Based on Availability)
- 17.2.6 SZ DJI Technology Co
- 17.2.6.1. Overview
- 17.2.6.2. Products
- 17.2.6.3. SWOT Analysis
- 17.2.6.4. Recent Developments
- 17.2.6.5. Financials (Based on Availability)
- 17.2.7 Samsung Electronics Co
- 17.2.7.1. Overview
- 17.2.7.2. Products
- 17.2.7.3. SWOT Analysis
- 17.2.7.4. Recent Developments
- 17.2.7.5. Financials (Based on Availability)
- 17.2.8 LocationSmart
- 17.2.8.1. Overview
- 17.2.8.2. Products
- 17.2.8.3. SWOT Analysis
- 17.2.8.4. Recent Developments
- 17.2.8.5. Financials (Based on Availability)
- 17.2.9 Microsoft Corporation
- 17.2.9.1. Overview
- 17.2.9.2. Products
- 17.2.9.3. SWOT Analysis
- 17.2.9.4. Recent Developments
- 17.2.9.5. Financials (Based on Availability)
- 17.2.10 Radar Labs Inc
- 17.2.10.1. Overview
- 17.2.10.2. Products
- 17.2.10.3. SWOT Analysis
- 17.2.10.4. Recent Developments
- 17.2.10.5. Financials (Based on Availability)
- 17.2.11 Bluedot Innovation Pty Ltd
- 17.2.11.1. Overview
- 17.2.11.2. Products
- 17.2.11.3. SWOT Analysis
- 17.2.11.4. Recent Developments
- 17.2.11.5. Financials (Based on Availability)
- 17.2.12 Apple Inc
- 17.2.12.1. Overview
- 17.2.12.2. Products
- 17.2.12.3. SWOT Analysis
- 17.2.12.4. Recent Developments
- 17.2.12.5. Financials (Based on Availability)
- 17.2.1 ESRI
List of Figures
- Figure 1: Global Active Geofencing Industry Revenue Breakdown (Million, %) by Region 2024 & 2032
- Figure 2: North America Active Geofencing Industry Revenue (Million), by Country 2024 & 2032
- Figure 3: North America Active Geofencing Industry Revenue Share (%), by Country 2024 & 2032
- Figure 4: Europe Active Geofencing Industry Revenue (Million), by Country 2024 & 2032
- Figure 5: Europe Active Geofencing Industry Revenue Share (%), by Country 2024 & 2032
- Figure 6: Asia Pacific Active Geofencing Industry Revenue (Million), by Country 2024 & 2032
- Figure 7: Asia Pacific Active Geofencing Industry Revenue Share (%), by Country 2024 & 2032
- Figure 8: South America Active Geofencing Industry Revenue (Million), by Country 2024 & 2032
- Figure 9: South America Active Geofencing Industry Revenue Share (%), by Country 2024 & 2032
- Figure 10: North America Active Geofencing Industry Revenue (Million), by Country 2024 & 2032
- Figure 11: North America Active Geofencing Industry Revenue Share (%), by Country 2024 & 2032
- Figure 12: MEA Active Geofencing Industry Revenue (Million), by Country 2024 & 2032
- Figure 13: MEA Active Geofencing Industry Revenue Share (%), by Country 2024 & 2032
- Figure 14: North America Active Geofencing Industry Revenue (Million), by Organization Size 2024 & 2032
- Figure 15: North America Active Geofencing Industry Revenue Share (%), by Organization Size 2024 & 2032
- Figure 16: North America Active Geofencing Industry Revenue (Million), by End-user Industry 2024 & 2032
- Figure 17: North America Active Geofencing Industry Revenue Share (%), by End-user Industry 2024 & 2032
- Figure 18: North America Active Geofencing Industry Revenue (Million), by Country 2024 & 2032
- Figure 19: North America Active Geofencing Industry Revenue Share (%), by Country 2024 & 2032
- Figure 20: Europe Active Geofencing Industry Revenue (Million), by Organization Size 2024 & 2032
- Figure 21: Europe Active Geofencing Industry Revenue Share (%), by Organization Size 2024 & 2032
- Figure 22: Europe Active Geofencing Industry Revenue (Million), by End-user Industry 2024 & 2032
- Figure 23: Europe Active Geofencing Industry Revenue Share (%), by End-user Industry 2024 & 2032
- Figure 24: Europe Active Geofencing Industry Revenue (Million), by Country 2024 & 2032
- Figure 25: Europe Active Geofencing Industry Revenue Share (%), by Country 2024 & 2032
- Figure 26: Asia Pacific Active Geofencing Industry Revenue (Million), by Organization Size 2024 & 2032
- Figure 27: Asia Pacific Active Geofencing Industry Revenue Share (%), by Organization Size 2024 & 2032
- Figure 28: Asia Pacific Active Geofencing Industry Revenue (Million), by End-user Industry 2024 & 2032
- Figure 29: Asia Pacific Active Geofencing Industry Revenue Share (%), by End-user Industry 2024 & 2032
- Figure 30: Asia Pacific Active Geofencing Industry Revenue (Million), by Country 2024 & 2032
- Figure 31: Asia Pacific Active Geofencing Industry Revenue Share (%), by Country 2024 & 2032
- Figure 32: Latin America Active Geofencing Industry Revenue (Million), by Organization Size 2024 & 2032
- Figure 33: Latin America Active Geofencing Industry Revenue Share (%), by Organization Size 2024 & 2032
- Figure 34: Latin America Active Geofencing Industry Revenue (Million), by End-user Industry 2024 & 2032
- Figure 35: Latin America Active Geofencing Industry Revenue Share (%), by End-user Industry 2024 & 2032
- Figure 36: Latin America Active Geofencing Industry Revenue (Million), by Country 2024 & 2032
- Figure 37: Latin America Active Geofencing Industry Revenue Share (%), by Country 2024 & 2032
- Figure 38: Middle East and Africa Active Geofencing Industry Revenue (Million), by Organization Size 2024 & 2032
- Figure 39: Middle East and Africa Active Geofencing Industry Revenue Share (%), by Organization Size 2024 & 2032
- Figure 40: Middle East and Africa Active Geofencing Industry Revenue (Million), by End-user Industry 2024 & 2032
- Figure 41: Middle East and Africa Active Geofencing Industry Revenue Share (%), by End-user Industry 2024 & 2032
- Figure 42: Middle East and Africa Active Geofencing Industry Revenue (Million), by Country 2024 & 2032
- Figure 43: Middle East and Africa Active Geofencing Industry Revenue Share (%), by Country 2024 & 2032
List of Tables
- Table 1: Global Active Geofencing Industry Revenue Million Forecast, by Region 2019 & 2032
- Table 2: Global Active Geofencing Industry Revenue Million Forecast, by Organization Size 2019 & 2032
- Table 3: Global Active Geofencing Industry Revenue Million Forecast, by End-user Industry 2019 & 2032
- Table 4: Global Active Geofencing Industry Revenue Million Forecast, by Region 2019 & 2032
- Table 5: Global Active Geofencing Industry Revenue Million Forecast, by Country 2019 & 2032
- Table 6: United States Active Geofencing Industry Revenue (Million) Forecast, by Application 2019 & 2032
- Table 7: Canada Active Geofencing Industry Revenue (Million) Forecast, by Application 2019 & 2032
- Table 8: Mexico Active Geofencing Industry Revenue (Million) Forecast, by Application 2019 & 2032
- Table 9: Global Active Geofencing Industry Revenue Million Forecast, by Country 2019 & 2032
- Table 10: Germany Active Geofencing Industry Revenue (Million) Forecast, by Application 2019 & 2032
- Table 11: United Kingdom Active Geofencing Industry Revenue (Million) Forecast, by Application 2019 & 2032
- Table 12: France Active Geofencing Industry Revenue (Million) Forecast, by Application 2019 & 2032
- Table 13: Spain Active Geofencing Industry Revenue (Million) Forecast, by Application 2019 & 2032
- Table 14: Italy Active Geofencing Industry Revenue (Million) Forecast, by Application 2019 & 2032
- Table 15: Spain Active Geofencing Industry Revenue (Million) Forecast, by Application 2019 & 2032
- Table 16: Belgium Active Geofencing Industry Revenue (Million) Forecast, by Application 2019 & 2032
- Table 17: Netherland Active Geofencing Industry Revenue (Million) Forecast, by Application 2019 & 2032
- Table 18: Nordics Active Geofencing Industry Revenue (Million) Forecast, by Application 2019 & 2032
- Table 19: Rest of Europe Active Geofencing Industry Revenue (Million) Forecast, by Application 2019 & 2032
- Table 20: Global Active Geofencing Industry Revenue Million Forecast, by Country 2019 & 2032
- Table 21: China Active Geofencing Industry Revenue (Million) Forecast, by Application 2019 & 2032
- Table 22: Japan Active Geofencing Industry Revenue (Million) Forecast, by Application 2019 & 2032
- Table 23: India Active Geofencing Industry Revenue (Million) Forecast, by Application 2019 & 2032
- Table 24: South Korea Active Geofencing Industry Revenue (Million) Forecast, by Application 2019 & 2032
- Table 25: Southeast Asia Active Geofencing Industry Revenue (Million) Forecast, by Application 2019 & 2032
- Table 26: Australia Active Geofencing Industry Revenue (Million) Forecast, by Application 2019 & 2032
- Table 27: Indonesia Active Geofencing Industry Revenue (Million) Forecast, by Application 2019 & 2032
- Table 28: Phillipes Active Geofencing Industry Revenue (Million) Forecast, by Application 2019 & 2032
- Table 29: Singapore Active Geofencing Industry Revenue (Million) Forecast, by Application 2019 & 2032
- Table 30: Thailandc Active Geofencing Industry Revenue (Million) Forecast, by Application 2019 & 2032
- Table 31: Rest of Asia Pacific Active Geofencing Industry Revenue (Million) Forecast, by Application 2019 & 2032
- Table 32: Global Active Geofencing Industry Revenue Million Forecast, by Country 2019 & 2032
- Table 33: Brazil Active Geofencing Industry Revenue (Million) Forecast, by Application 2019 & 2032
- Table 34: Argentina Active Geofencing Industry Revenue (Million) Forecast, by Application 2019 & 2032
- Table 35: Peru Active Geofencing Industry Revenue (Million) Forecast, by Application 2019 & 2032
- Table 36: Chile Active Geofencing Industry Revenue (Million) Forecast, by Application 2019 & 2032
- Table 37: Colombia Active Geofencing Industry Revenue (Million) Forecast, by Application 2019 & 2032
- Table 38: Ecuador Active Geofencing Industry Revenue (Million) Forecast, by Application 2019 & 2032
- Table 39: Venezuela Active Geofencing Industry Revenue (Million) Forecast, by Application 2019 & 2032
- Table 40: Rest of South America Active Geofencing Industry Revenue (Million) Forecast, by Application 2019 & 2032
- Table 41: Global Active Geofencing Industry Revenue Million Forecast, by Country 2019 & 2032
- Table 42: United States Active Geofencing Industry Revenue (Million) Forecast, by Application 2019 & 2032
- Table 43: Canada Active Geofencing Industry Revenue (Million) Forecast, by Application 2019 & 2032
- Table 44: Mexico Active Geofencing Industry Revenue (Million) Forecast, by Application 2019 & 2032
- Table 45: Global Active Geofencing Industry Revenue Million Forecast, by Country 2019 & 2032
- Table 46: United Arab Emirates Active Geofencing Industry Revenue (Million) Forecast, by Application 2019 & 2032
- Table 47: Saudi Arabia Active Geofencing Industry Revenue (Million) Forecast, by Application 2019 & 2032
- Table 48: South Africa Active Geofencing Industry Revenue (Million) Forecast, by Application 2019 & 2032
- Table 49: Rest of Middle East and Africa Active Geofencing Industry Revenue (Million) Forecast, by Application 2019 & 2032
- Table 50: Global Active Geofencing Industry Revenue Million Forecast, by Organization Size 2019 & 2032
- Table 51: Global Active Geofencing Industry Revenue Million Forecast, by End-user Industry 2019 & 2032
- Table 52: Global Active Geofencing Industry Revenue Million Forecast, by Country 2019 & 2032
- Table 53: Global Active Geofencing Industry Revenue Million Forecast, by Organization Size 2019 & 2032
- Table 54: Global Active Geofencing Industry Revenue Million Forecast, by End-user Industry 2019 & 2032
- Table 55: Global Active Geofencing Industry Revenue Million Forecast, by Country 2019 & 2032
- Table 56: Global Active Geofencing Industry Revenue Million Forecast, by Organization Size 2019 & 2032
- Table 57: Global Active Geofencing Industry Revenue Million Forecast, by End-user Industry 2019 & 2032
- Table 58: Global Active Geofencing Industry Revenue Million Forecast, by Country 2019 & 2032
- Table 59: Global Active Geofencing Industry Revenue Million Forecast, by Organization Size 2019 & 2032
- Table 60: Global Active Geofencing Industry Revenue Million Forecast, by End-user Industry 2019 & 2032
- Table 61: Global Active Geofencing Industry Revenue Million Forecast, by Country 2019 & 2032
- Table 62: Global Active Geofencing Industry Revenue Million Forecast, by Organization Size 2019 & 2032
- Table 63: Global Active Geofencing Industry Revenue Million Forecast, by End-user Industry 2019 & 2032
- Table 64: Global Active Geofencing Industry Revenue Million Forecast, by Country 2019 & 2032
Frequently Asked Questions
1. What is the projected Compound Annual Growth Rate (CAGR) of the Active Geofencing Industry?
The projected CAGR is approximately 23.23%.
2. Which companies are prominent players in the Active Geofencing Industry?
Key companies in the market include ESRI, Verve Inc, Infillion Inc (GIMBLE), IBM Corporation, Google LLC, SZ DJI Technology Co, Samsung Electronics Co, LocationSmart, Microsoft Corporation, Radar Labs Inc, Bluedot Innovation Pty Ltd, Apple Inc.
3. What are the main segments of the Active Geofencing Industry?
The market segments include Organization Size, End-user Industry.
4. Can you provide details about the market size?
The market size is estimated to be USD 1.81 Million as of 2022.
5. What are some drivers contributing to market growth?
Increased Use of Spatial Data and Improved Real-time Location Technology; Higher Adoption of Location-based Application among Consumers.
6. What are the notable trends driving market growth?
Retail Segment to Witness Significant Growth.
7. Are there any restraints impacting market growth?
Rising Awareness Regarding Safety and Security among Consumers of Location Tracking.
8. Can you provide examples of recent developments in the market?
December 2023 : McDonald’s has announced the expanding its Ready on Arrival pilot which uses geofencing to alert employees when a mobile order customer is nearing the restaurant so they can get the customer’s food ready to its top six markets by 2025
9. What pricing options are available for accessing the report?
Pricing options include single-user, multi-user, and enterprise licenses priced at USD 4750, USD 5250, and USD 8750 respectively.
10. Is the market size provided in terms of value or volume?
The market size is provided in terms of value, measured in Million.
11. Are there any specific market keywords associated with the report?
Yes, the market keyword associated with the report is "Active Geofencing Industry," which aids in identifying and referencing the specific market segment covered.
12. How do I determine which pricing option suits my needs best?
The pricing options vary based on user requirements and access needs. Individual users may opt for single-user licenses, while businesses requiring broader access may choose multi-user or enterprise licenses for cost-effective access to the report.
13. Are there any additional resources or data provided in the Active Geofencing Industry report?
While the report offers comprehensive insights, it's advisable to review the specific contents or supplementary materials provided to ascertain if additional resources or data are available.
14. How can I stay updated on further developments or reports in the Active Geofencing Industry?
To stay informed about further developments, trends, and reports in the Active Geofencing Industry, consider subscribing to industry newsletters, following relevant companies and organizations, or regularly checking reputable industry news sources and publications.
Methodology
Step 1 - Identification of Relevant Samples Size from Population Database


Step 2 - Approaches for Defining Global Market Size (Value, Volume* & Price*)

Note*: In applicable scenarios
Step 3 - Data Sources
Primary Research
- Web Analytics
- Survey Reports
- Research Institute
- Latest Research Reports
- Opinion Leaders
Secondary Research
- Annual Reports
- White Paper
- Latest Press Release
- Industry Association
- Paid Database
- Investor Presentations

Step 4 - Data Triangulation
Involves using different sources of information in order to increase the validity of a study
These sources are likely to be stakeholders in a program - participants, other researchers, program staff, other community members, and so on.
Then we put all data in single framework & apply various statistical tools to find out the dynamic on the market.
During the analysis stage, feedback from the stakeholder groups would be compared to determine areas of agreement as well as areas of divergence


