
Key Insights
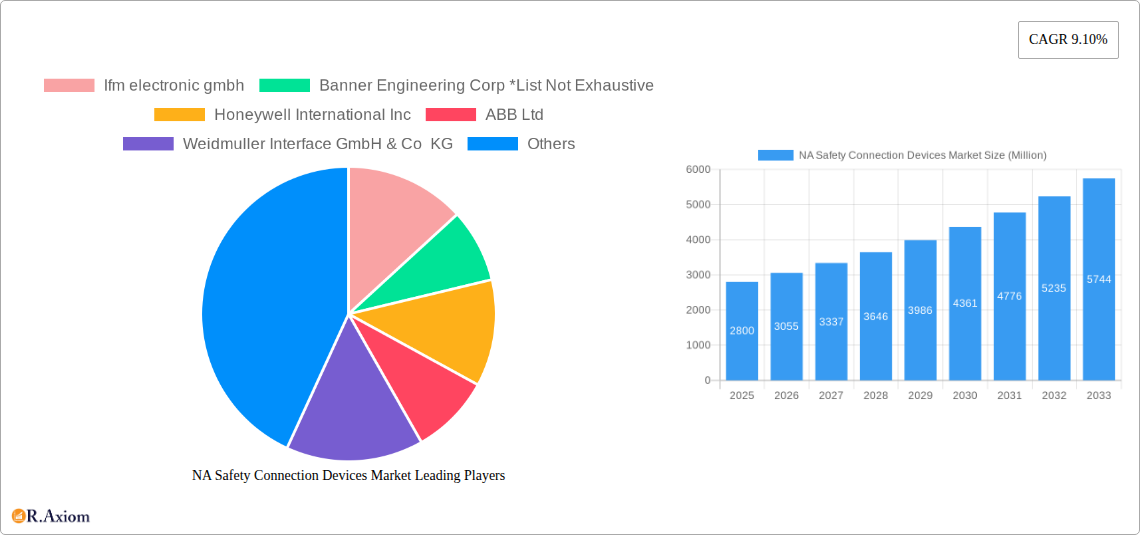
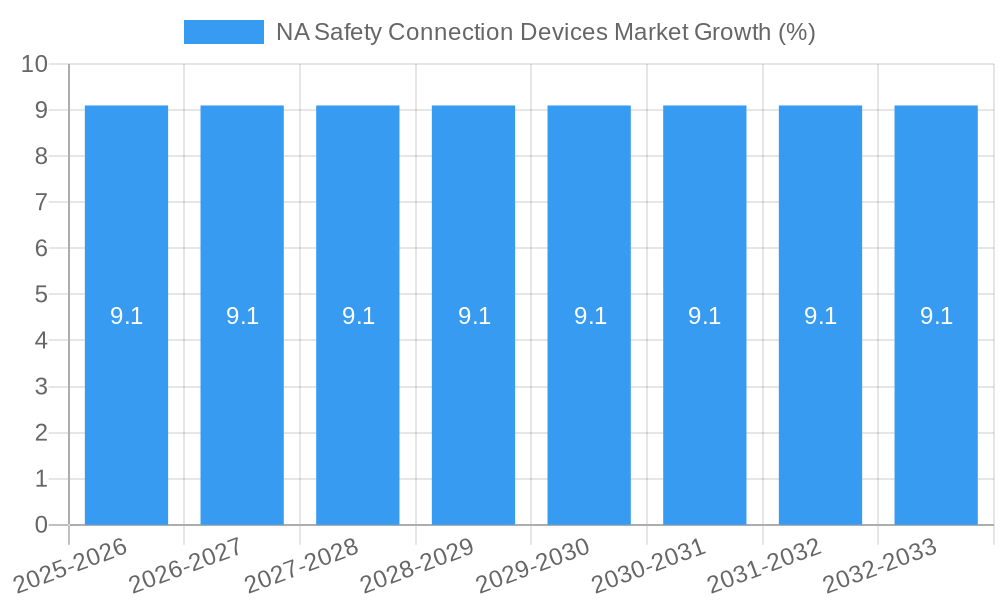
The North American Safety Connection Devices Market is poised for significant expansion, projected to reach a substantial market size in 2025 and grow at a Compound Annual Growth Rate (CAGR) of 9.10% through 2033. This robust growth is underpinned by a confluence of factors, primarily driven by the escalating demand for enhanced industrial safety across key sectors. The increasing adoption of automation and sophisticated machinery in manufacturing, coupled with stringent regulatory mandates for workplace safety, are primary catalysts. Furthermore, the burgeoning automotive industry's emphasis on advanced safety features, including those integrated into vehicle electronics and production lines, is a significant contributor. Healthcare, too, presents a growing opportunity, with the need for reliable and safe connection devices in medical equipment and facilities becoming paramount. The energy and power sector's ongoing infrastructure development and the imperative for secure operational connections further bolster market demand. Key growth drivers include the continuous innovation in product offerings, such as the development of more robust and intelligent connection solutions that integrate advanced sensing and diagnostic capabilities, and the increasing trend towards smart factory initiatives and the Industrial Internet of Things (IIoT), which necessitate secure and reliable data transmission.
The market's dynamism is further shaped by emerging trends that favor advanced connectivity solutions. The integration of smart technologies and Industry 4.0 principles is driving the demand for intelligent gateways, adaptors, and relays that facilitate seamless data exchange and real-time monitoring of safety parameters. The growing adoption of Ethernet-based industrial communication protocols also fuels the need for specialized connectors and cables designed for harsh industrial environments. However, the market faces certain restraints, including the initial high cost of advanced safety connection devices and the perceived complexity of integrating new systems into existing infrastructure. Supply chain disruptions and the availability of skilled labor for installation and maintenance can also pose challenges. Despite these hurdles, the North American market's strong focus on technological advancement and safety compliance, supported by a well-established industrial base and leading global players in the safety connection devices sector, ensures a promising trajectory for sustained growth and innovation.
This in-depth report provides a detailed analysis of the North American (NA) Safety Connection Devices Market, covering the historical period from 2019 to 2024, the base year of 2025, and an extensive forecast period from 2025 to 2033. The market is characterized by rapid technological advancements, evolving regulatory landscapes, and increasing demand from diverse end-user industries. Our analysis delves into market concentration, innovation drivers, dominant segments, product developments, key growth drivers, challenges, emerging opportunities, leading players, and significant industry developments to offer a holistic view and actionable insights for stakeholders. The report leverages high-traffic keywords such as "North America safety connectors," "industrial automation safety devices," "automotive safety components," "manufacturing safety solutions," and "energy sector electrical safety" to maximize search visibility and engagement.
NA Safety Connection Devices Market Market Concentration & Innovation
The North American Safety Connection Devices Market exhibits a moderate level of market concentration, with a mix of large multinational corporations and smaller specialized manufacturers. Key players like Ifm electronic gmbh, Banner Engineering Corp, Honeywell International Inc, ABB Ltd, Weidmuller Interface GmbH & Co KG, Schneider Electric SE, Bihl + Wiedemann GmbH, Murrelektronik Inc, TE Connectivity Ltd, Advantech Co Ltd, Rockwell Automation Inc, and Lumberg Automation Components GmbH are vying for market share. Innovation is a critical differentiator, driven by the relentless pursuit of enhanced safety features, increased reliability, and seamless integration within complex industrial automation systems. The development of smart connectors with embedded diagnostics and predictive maintenance capabilities is a significant innovation trend. Regulatory frameworks, such as OSHA standards and specific industry guidelines, play a pivotal role in shaping product development and market entry. While direct product substitutes are limited due to stringent safety requirements, advancements in alternative safety technologies indirectly influence market dynamics. End-user trends, particularly the growing adoption of Industry 4.0 and the increasing demand for automation in sectors like automotive and manufacturing, are fueling market growth. Mergers and acquisitions (M&A) are also observed as companies seek to expand their product portfolios, technological capabilities, and geographical reach. For instance, M&A deal values are estimated to be in the hundreds of millions of US dollars, signaling consolidation and strategic growth initiatives.
NA Safety Connection Devices Market Industry Trends & Insights
The North American Safety Connection Devices Market is experiencing robust growth, projected to witness a Compound Annual Growth Rate (CAGR) of approximately 7.8% during the forecast period (2025-2033). This expansion is underpinned by several key industry trends and insights. The escalating emphasis on workplace safety across all industrial sectors is a primary growth driver. Stringent government regulations and corporate responsibility initiatives mandate the implementation of advanced safety connection devices to prevent accidents, reduce downtime, and ensure compliance. The rapid adoption of industrial automation and the proliferation of smart factories, driven by Industry 4.0 principles, are significantly boosting the demand for sophisticated safety components that can seamlessly integrate with interconnected systems. The automotive sector, in particular, is a major contributor, with increasing electrification and advanced driver-assistance systems (ADAS) requiring highly reliable and safe electrical connections. Similarly, the manufacturing industry is witnessing a surge in robotic integration and automated production lines, necessitating robust safety solutions to protect personnel and equipment. The energy and power sector, including renewable energy installations, also presents substantial opportunities due to the need for safe and reliable power distribution and transmission. Technological disruptions, such as the development of wireless safety communication protocols and the integration of AI-powered diagnostic features within connection devices, are creating new market avenues and enhancing product performance. Consumer preferences are leaning towards integrated, plug-and-play solutions that simplify installation and maintenance while offering superior safety performance. Competitive dynamics are intensifying, with established players investing heavily in research and development to stay ahead of the curve and new entrants focusing on niche markets and specialized solutions. Market penetration is steadily increasing as businesses recognize the long-term economic benefits of investing in safety, including reduced insurance premiums and improved operational efficiency. The overall market size is estimated to reach over 10,000 Million US dollars by 2033, reflecting a significant upward trajectory.
Dominant Markets & Segments in NA Safety Connection Devices Market
The North American Safety Connection Devices Market is characterized by the dominance of certain regions and product segments, driven by specific economic policies, infrastructure development, and end-user industry growth.
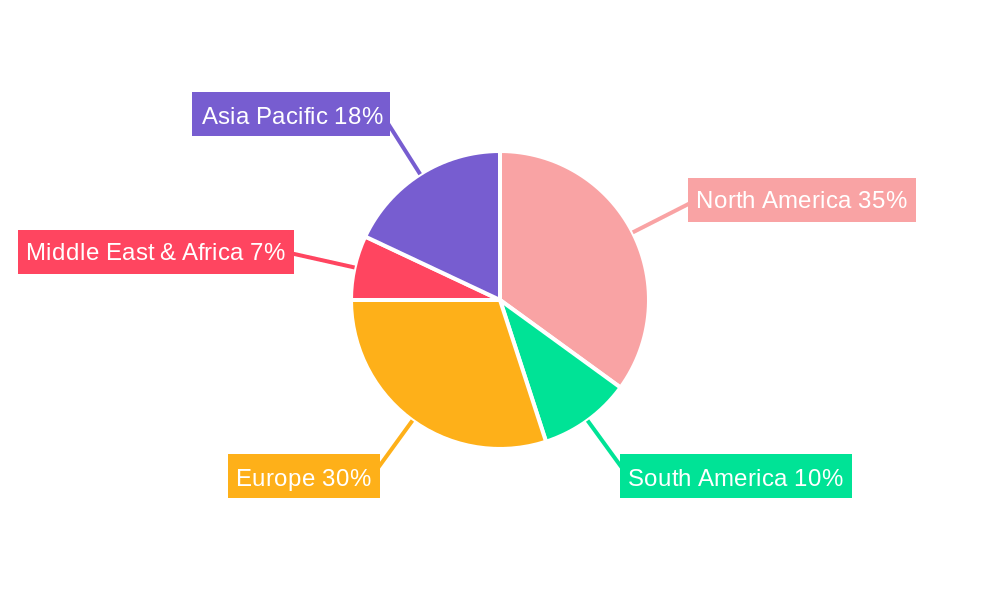
Leading Region: The United States holds the largest market share within North America, attributed to its advanced industrial base, significant investments in automation, and stringent safety regulations. Canada and Mexico follow, with growing industrial sectors and increasing adoption of safety technologies.
Dominant Segments by Type:
- Connectors: This segment is the largest and most rapidly growing, driven by their ubiquitous use across all industrial applications for establishing reliable electrical and data connections. The demand for high-performance, robust, and miniaturized connectors is a key driver.
- Cable and Cords: Essential for transmitting power and signals, this segment benefits from the overall growth in automation and industrial machinery deployment. The need for specialized, industrial-grade cables designed for harsh environments is significant.
- Gateways: With the rise of Industry 4.0 and the Industrial Internet of Things (IIoT), gateways that facilitate communication between different networks and protocols are experiencing substantial growth. They are crucial for data acquisition and system integration.
- Relays: Safety relays are indispensable for critical safety functions such as emergency stops, light curtains, and safety gates. The increasing complexity of safety circuits drives demand for advanced relay solutions.
- T-Couplers and Distribution Boxes: These components are vital for efficient power and signal distribution in industrial control cabinets and machinery. Their market is tied to the overall expansion of automated systems and infrastructure.
- Adaptors: These play a crucial role in ensuring compatibility between different types of connectors and systems, facilitating seamless integration and upgrade paths for existing infrastructure.
Dominant Segments by End-user Industry:
- Manufacturing: This sector is the largest consumer of safety connection devices, driven by the extensive use of automated machinery, robotics, and complex production lines. The implementation of lean manufacturing and safety-first principles further bolsters demand.
- Automotive: The automotive industry is a significant growth driver, with the increasing adoption of electric vehicles (EVs), advanced driver-assistance systems (ADAS), and highly automated assembly lines requiring sophisticated and reliable safety connection solutions.
- Energy and Power: This sector, including traditional power generation and the rapidly expanding renewable energy sector (solar, wind), requires robust safety connection devices for power distribution, control systems, and grid infrastructure to ensure operational safety and reliability.
- Healthcare: While a smaller segment compared to manufacturing, the healthcare industry is increasingly adopting automation in medical devices and diagnostics, leading to a growing demand for specialized safety connection components.
- Other End-user Applications: This encompasses sectors like logistics, material handling, and building automation, all of which are progressively integrating safety connection devices into their operations.
NA Safety Connection Devices Market Product Developments
Product development in the NA Safety Connection Devices Market is centered on enhancing safety, efficiency, and connectivity. Innovations include the introduction of smart connectors with integrated diagnostic capabilities for predictive maintenance, reducing unplanned downtime. Advancements in miniaturization are enabling the development of smaller, more powerful connection devices suitable for increasingly compact machinery. Furthermore, the integration of advanced materials is improving the durability and environmental resistance of these components, making them suitable for harsh industrial conditions. Competitive advantages are being gained through the development of solutions that offer plug-and-play functionality, simplifying installation and reducing commissioning times for end-users. Wireless safety technologies are also emerging as a key area of innovation, offering greater flexibility in machine design and deployment.
Report Scope & Segmentation Analysis
This report provides a comprehensive analysis of the North American Safety Connection Devices Market, segmenting it by type and end-user industry.
- By Type:
- Cable and Cords: This segment encompasses a wide range of industrial cables and cords designed for power and signal transmission in safety-critical applications. Market growth is projected to be steady, driven by overall industrial expansion.
- Connectors: This is a significant and growing segment, including various types of electrical, data, and hybrid connectors essential for system integration and operation. High growth is anticipated due to increasing automation.
- Gateways: This segment focuses on devices that enable communication and data exchange between different industrial networks and systems. Strong growth is expected due to IIoT adoption.
- Adaptors: This segment includes devices that ensure compatibility and facilitate integration between disparate systems and connectors.
- Relays: This segment comprises safety relays designed for critical protective functions. Steady growth is anticipated as safety standards become more stringent.
- T-Couplers: These are essential for power and signal distribution, contributing to the overall market growth driven by infrastructure development.
- Distribution Box: This segment includes enclosures and cabinets for housing and organizing electrical components.
- By End-user Industry:
- Automotive: This segment is projected for robust growth, driven by EV adoption and advanced manufacturing technologies.
- Manufacturing: Expected to remain the largest segment, with continuous demand for safety solutions in automated production environments.
- Healthcare: Anticipated to show steady growth as automation increases in medical devices and facilities.
- Energy and Power: This segment is poised for significant growth, particularly with the expansion of renewable energy infrastructure.
- Other End-user Applications: This broad category is expected to exhibit moderate growth, reflecting the increasing adoption of safety connection devices across diverse industries.
Key Drivers of NA Safety Connection Devices Market Growth
The North American Safety Connection Devices Market is propelled by several key drivers. The paramount driver is the increasing emphasis on workplace safety and regulatory compliance, driven by governmental mandates and a heightened corporate awareness of accident prevention. Technological advancements, particularly in industrial automation, Industry 4.0, and the Industrial Internet of Things (IIoT), are creating a demand for sophisticated and integrated safety solutions. The growing adoption of electric vehicles (EVs) in the automotive sector necessitates advanced connection technologies for charging and in-vehicle systems. Furthermore, infrastructure development and modernization projects across various industries, including energy and manufacturing, require robust and reliable electrical safety components. Finally, the need to reduce operational costs and minimize downtime through enhanced safety and predictive maintenance capabilities is a significant economic driver.
Challenges in the NA Safety Connection Devices Market Sector
Despite the robust growth, the NA Safety Connection Devices Market faces several challenges. Stringent and evolving regulatory landscapes can pose compliance hurdles and increase R&D costs for manufacturers. Supply chain disruptions, exacerbated by global geopolitical events and raw material shortages, can impact production timelines and cost-effectiveness. Intense price competition among manufacturers, especially in more commoditized segments, can squeeze profit margins. The complexity of integration with existing legacy systems for some end-users can also act as a barrier to adoption. Additionally, a shortage of skilled labor capable of understanding and implementing advanced safety systems can hinder market penetration.
Emerging Opportunities in NA Safety Connection Devices Market
The NA Safety Connection Devices Market is ripe with emerging opportunities. The rapid expansion of the renewable energy sector, including solar and wind power, presents a substantial market for specialized safety connection devices designed for distributed energy systems and grid integration. The increasing adoption of collaborative robots (cobots) in manufacturing and logistics opens new avenues for safety sensors and connection solutions that ensure safe human-robot interaction. The ongoing trend of digitalization and the adoption of IIoT will drive demand for smart connectors with enhanced data acquisition and communication capabilities. Furthermore, the development of advanced materials and miniaturization technologies will lead to the creation of new product categories catering to niche applications. The growing demand for sustainable and energy-efficient solutions also presents an opportunity for manufacturers to innovate in these areas.
Leading Players in the NA Safety Connection Devices Market Market
- Ifm electronic gmbh
- Banner Engineering Corp
- Honeywell International Inc
- ABB Ltd
- Weidmuller Interface GmbH & Co KG
- Schneider Electric SE
- Bihl + Wiedemann GmbH
- Murrelektronik Inc
- TE Connectivity Ltd
- Advantech Co Ltd
- Rockwell Automation Inc
- Lumberg Automation Components GmbH
Key Developments in NA Safety Connection Devices Market Industry
- November 2021: Tesla is introducing a new at-home wall charger with the capacity to work with all-electric vehicles (EVs) in North America. The charger, which comes with a J1772 connector, is designed for both outdoor and indoor installation and can charge up to 9.6 kW. Tesla vehicle owners can use the device with an adapter. This development highlights the growing demand for reliable and versatile EV charging infrastructure and the importance of standardized safety connection components.
- November 2021: IDEA, The Industry Data Exchange Association, announces that Grace Technologies, a Global electrical safety device manufacturer, is syndicating its digital product content through that IDEA Connector, providing trading partners with the most accurate and timely product data and marketing content. This initiative underscores the trend towards increased data transparency and interoperability in the industrial supply chain, impacting how safety device information is shared and accessed.
Strategic Outlook for NA Safety Connection Devices Market Market
The strategic outlook for the North American Safety Connection Devices Market is highly positive, characterized by sustained growth and innovation. Key growth catalysts include the continued push for industrial automation and digitalization, the burgeoning electric vehicle market, and the ongoing expansion of renewable energy infrastructure. Manufacturers that can offer integrated, intelligent, and highly reliable safety solutions will be well-positioned for success. Strategic investments in research and development focused on smart connectivity, predictive maintenance, and compliance with evolving safety standards will be crucial. Furthermore, exploring partnerships and collaborations to expand market reach and technological capabilities will be a key strategy for companies looking to capitalize on emerging opportunities. The market's trajectory indicates a significant future potential for companies that can adapt to technological advancements and address the evolving safety needs of diverse end-user industries.
NA Safety Connection Devices Market Segmentation
-
1. Type
- 1.1. Cable and Cords
- 1.2. Connectors
- 1.3. Gateways
- 1.4. Adaptors
- 1.5. Relays
- 1.6. T-Couplers
- 1.7. Distribution Box
-
2. End-user Industry
- 2.1. Automotive
- 2.2. Manufacturing
- 2.3. Healthcare
- 2.4. Energy and Power
- 2.5. Other End-user Applications
NA Safety Connection Devices Market Segmentation By Geography
-
1. North America
- 1.1. United States
- 1.2. Canada
- 1.3. Mexico
-
2. South America
- 2.1. Brazil
- 2.2. Argentina
- 2.3. Rest of South America
-
3. Europe
- 3.1. United Kingdom
- 3.2. Germany
- 3.3. France
- 3.4. Italy
- 3.5. Spain
- 3.6. Russia
- 3.7. Benelux
- 3.8. Nordics
- 3.9. Rest of Europe
-
4. Middle East & Africa
- 4.1. Turkey
- 4.2. Israel
- 4.3. GCC
- 4.4. North Africa
- 4.5. South Africa
- 4.6. Rest of Middle East & Africa
-
5. Asia Pacific
- 5.1. China
- 5.2. India
- 5.3. Japan
- 5.4. South Korea
- 5.5. ASEAN
- 5.6. Oceania
- 5.7. Rest of Asia Pacific
NA Safety Connection Devices Market REPORT HIGHLIGHTS
| Aspects | Details |
|---|---|
| Study Period | 2019-2033 |
| Base Year | 2024 |
| Estimated Year | 2025 |
| Forecast Period | 2025-2033 |
| Historical Period | 2019-2024 |
| Growth Rate | CAGR of 9.10% from 2019-2033 |
| Segmentation |
|
Table of Contents
- 1. Introduction
- 1.1. Research Scope
- 1.2. Market Segmentation
- 1.3. Research Methodology
- 1.4. Definitions and Assumptions
- 2. Executive Summary
- 2.1. Introduction
- 3. Market Dynamics
- 3.1. Introduction
- 3.2. Market Drivers
- 3.2.1. Growth in Industry 4.0 and Rapid Factory Automation; Increasing demand of Safety devices in Automotive Industry
- 3.3. Market Restrains
- 3.3.1. Higher Cost of Devices
- 3.4. Market Trends
- 3.4.1. Automotive Industry to Show Significant Growth
- 4. Market Factor Analysis
- 4.1. Porters Five Forces
- 4.2. Supply/Value Chain
- 4.3. PESTEL analysis
- 4.4. Market Entropy
- 4.5. Patent/Trademark Analysis
- 5. Global NA Safety Connection Devices Market Analysis, Insights and Forecast, 2019-2031
- 5.1. Market Analysis, Insights and Forecast - by Type
- 5.1.1. Cable and Cords
- 5.1.2. Connectors
- 5.1.3. Gateways
- 5.1.4. Adaptors
- 5.1.5. Relays
- 5.1.6. T-Couplers
- 5.1.7. Distribution Box
- 5.2. Market Analysis, Insights and Forecast - by End-user Industry
- 5.2.1. Automotive
- 5.2.2. Manufacturing
- 5.2.3. Healthcare
- 5.2.4. Energy and Power
- 5.2.5. Other End-user Applications
- 5.3. Market Analysis, Insights and Forecast - by Region
- 5.3.1. North America
- 5.3.2. South America
- 5.3.3. Europe
- 5.3.4. Middle East & Africa
- 5.3.5. Asia Pacific
- 5.1. Market Analysis, Insights and Forecast - by Type
- 6. North America NA Safety Connection Devices Market Analysis, Insights and Forecast, 2019-2031
- 6.1. Market Analysis, Insights and Forecast - by Type
- 6.1.1. Cable and Cords
- 6.1.2. Connectors
- 6.1.3. Gateways
- 6.1.4. Adaptors
- 6.1.5. Relays
- 6.1.6. T-Couplers
- 6.1.7. Distribution Box
- 6.2. Market Analysis, Insights and Forecast - by End-user Industry
- 6.2.1. Automotive
- 6.2.2. Manufacturing
- 6.2.3. Healthcare
- 6.2.4. Energy and Power
- 6.2.5. Other End-user Applications
- 6.1. Market Analysis, Insights and Forecast - by Type
- 7. South America NA Safety Connection Devices Market Analysis, Insights and Forecast, 2019-2031
- 7.1. Market Analysis, Insights and Forecast - by Type
- 7.1.1. Cable and Cords
- 7.1.2. Connectors
- 7.1.3. Gateways
- 7.1.4. Adaptors
- 7.1.5. Relays
- 7.1.6. T-Couplers
- 7.1.7. Distribution Box
- 7.2. Market Analysis, Insights and Forecast - by End-user Industry
- 7.2.1. Automotive
- 7.2.2. Manufacturing
- 7.2.3. Healthcare
- 7.2.4. Energy and Power
- 7.2.5. Other End-user Applications
- 7.1. Market Analysis, Insights and Forecast - by Type
- 8. Europe NA Safety Connection Devices Market Analysis, Insights and Forecast, 2019-2031
- 8.1. Market Analysis, Insights and Forecast - by Type
- 8.1.1. Cable and Cords
- 8.1.2. Connectors
- 8.1.3. Gateways
- 8.1.4. Adaptors
- 8.1.5. Relays
- 8.1.6. T-Couplers
- 8.1.7. Distribution Box
- 8.2. Market Analysis, Insights and Forecast - by End-user Industry
- 8.2.1. Automotive
- 8.2.2. Manufacturing
- 8.2.3. Healthcare
- 8.2.4. Energy and Power
- 8.2.5. Other End-user Applications
- 8.1. Market Analysis, Insights and Forecast - by Type
- 9. Middle East & Africa NA Safety Connection Devices Market Analysis, Insights and Forecast, 2019-2031
- 9.1. Market Analysis, Insights and Forecast - by Type
- 9.1.1. Cable and Cords
- 9.1.2. Connectors
- 9.1.3. Gateways
- 9.1.4. Adaptors
- 9.1.5. Relays
- 9.1.6. T-Couplers
- 9.1.7. Distribution Box
- 9.2. Market Analysis, Insights and Forecast - by End-user Industry
- 9.2.1. Automotive
- 9.2.2. Manufacturing
- 9.2.3. Healthcare
- 9.2.4. Energy and Power
- 9.2.5. Other End-user Applications
- 9.1. Market Analysis, Insights and Forecast - by Type
- 10. Asia Pacific NA Safety Connection Devices Market Analysis, Insights and Forecast, 2019-2031
- 10.1. Market Analysis, Insights and Forecast - by Type
- 10.1.1. Cable and Cords
- 10.1.2. Connectors
- 10.1.3. Gateways
- 10.1.4. Adaptors
- 10.1.5. Relays
- 10.1.6. T-Couplers
- 10.1.7. Distribution Box
- 10.2. Market Analysis, Insights and Forecast - by End-user Industry
- 10.2.1. Automotive
- 10.2.2. Manufacturing
- 10.2.3. Healthcare
- 10.2.4. Energy and Power
- 10.2.5. Other End-user Applications
- 10.1. Market Analysis, Insights and Forecast - by Type
- 11. North America NA Safety Connection Devices Market Analysis, Insights and Forecast, 2019-2031
- 11.1. Market Analysis, Insights and Forecast - By Country/Sub-region
- 11.1.1.
- 12. Europe NA Safety Connection Devices Market Analysis, Insights and Forecast, 2019-2031
- 12.1. Market Analysis, Insights and Forecast - By Country/Sub-region
- 12.1.1.
- 13. Asia Pacific NA Safety Connection Devices Market Analysis, Insights and Forecast, 2019-2031
- 13.1. Market Analysis, Insights and Forecast - By Country/Sub-region
- 13.1.1.
- 14. Latin America NA Safety Connection Devices Market Analysis, Insights and Forecast, 2019-2031
- 14.1. Market Analysis, Insights and Forecast - By Country/Sub-region
- 14.1.1.
- 15. Middle East NA Safety Connection Devices Market Analysis, Insights and Forecast, 2019-2031
- 15.1. Market Analysis, Insights and Forecast - By Country/Sub-region
- 15.1.1.
- 16. Competitive Analysis
- 16.1. Global Market Share Analysis 2024
- 16.2. Company Profiles
- 16.2.1 Ifm electronic gmbh
- 16.2.1.1. Overview
- 16.2.1.2. Products
- 16.2.1.3. SWOT Analysis
- 16.2.1.4. Recent Developments
- 16.2.1.5. Financials (Based on Availability)
- 16.2.2 Banner Engineering Corp *List Not Exhaustive
- 16.2.2.1. Overview
- 16.2.2.2. Products
- 16.2.2.3. SWOT Analysis
- 16.2.2.4. Recent Developments
- 16.2.2.5. Financials (Based on Availability)
- 16.2.3 Honeywell International Inc
- 16.2.3.1. Overview
- 16.2.3.2. Products
- 16.2.3.3. SWOT Analysis
- 16.2.3.4. Recent Developments
- 16.2.3.5. Financials (Based on Availability)
- 16.2.4 ABB Ltd
- 16.2.4.1. Overview
- 16.2.4.2. Products
- 16.2.4.3. SWOT Analysis
- 16.2.4.4. Recent Developments
- 16.2.4.5. Financials (Based on Availability)
- 16.2.5 Weidmuller Interface GmbH & Co KG
- 16.2.5.1. Overview
- 16.2.5.2. Products
- 16.2.5.3. SWOT Analysis
- 16.2.5.4. Recent Developments
- 16.2.5.5. Financials (Based on Availability)
- 16.2.6 Schneider Electric SE
- 16.2.6.1. Overview
- 16.2.6.2. Products
- 16.2.6.3. SWOT Analysis
- 16.2.6.4. Recent Developments
- 16.2.6.5. Financials (Based on Availability)
- 16.2.7 Bihl + Wiedemann GmbH
- 16.2.7.1. Overview
- 16.2.7.2. Products
- 16.2.7.3. SWOT Analysis
- 16.2.7.4. Recent Developments
- 16.2.7.5. Financials (Based on Availability)
- 16.2.8 Murrelektronik Inc
- 16.2.8.1. Overview
- 16.2.8.2. Products
- 16.2.8.3. SWOT Analysis
- 16.2.8.4. Recent Developments
- 16.2.8.5. Financials (Based on Availability)
- 16.2.9 TE Connectivity Ltd
- 16.2.9.1. Overview
- 16.2.9.2. Products
- 16.2.9.3. SWOT Analysis
- 16.2.9.4. Recent Developments
- 16.2.9.5. Financials (Based on Availability)
- 16.2.10 Advantech Co Ltd
- 16.2.10.1. Overview
- 16.2.10.2. Products
- 16.2.10.3. SWOT Analysis
- 16.2.10.4. Recent Developments
- 16.2.10.5. Financials (Based on Availability)
- 16.2.11 Rockwell Automation Inc
- 16.2.11.1. Overview
- 16.2.11.2. Products
- 16.2.11.3. SWOT Analysis
- 16.2.11.4. Recent Developments
- 16.2.11.5. Financials (Based on Availability)
- 16.2.12 Lumberg Automation Components GmbH
- 16.2.12.1. Overview
- 16.2.12.2. Products
- 16.2.12.3. SWOT Analysis
- 16.2.12.4. Recent Developments
- 16.2.12.5. Financials (Based on Availability)
- 16.2.1 Ifm electronic gmbh
List of Figures
- Figure 1: Global NA Safety Connection Devices Market Revenue Breakdown (Million, %) by Region 2024 & 2032
- Figure 2: North America NA Safety Connection Devices Market Revenue (Million), by Country 2024 & 2032
- Figure 3: North America NA Safety Connection Devices Market Revenue Share (%), by Country 2024 & 2032
- Figure 4: Europe NA Safety Connection Devices Market Revenue (Million), by Country 2024 & 2032
- Figure 5: Europe NA Safety Connection Devices Market Revenue Share (%), by Country 2024 & 2032
- Figure 6: Asia Pacific NA Safety Connection Devices Market Revenue (Million), by Country 2024 & 2032
- Figure 7: Asia Pacific NA Safety Connection Devices Market Revenue Share (%), by Country 2024 & 2032
- Figure 8: Latin America NA Safety Connection Devices Market Revenue (Million), by Country 2024 & 2032
- Figure 9: Latin America NA Safety Connection Devices Market Revenue Share (%), by Country 2024 & 2032
- Figure 10: Middle East NA Safety Connection Devices Market Revenue (Million), by Country 2024 & 2032
- Figure 11: Middle East NA Safety Connection Devices Market Revenue Share (%), by Country 2024 & 2032
- Figure 12: North America NA Safety Connection Devices Market Revenue (Million), by Type 2024 & 2032
- Figure 13: North America NA Safety Connection Devices Market Revenue Share (%), by Type 2024 & 2032
- Figure 14: North America NA Safety Connection Devices Market Revenue (Million), by End-user Industry 2024 & 2032
- Figure 15: North America NA Safety Connection Devices Market Revenue Share (%), by End-user Industry 2024 & 2032
- Figure 16: North America NA Safety Connection Devices Market Revenue (Million), by Country 2024 & 2032
- Figure 17: North America NA Safety Connection Devices Market Revenue Share (%), by Country 2024 & 2032
- Figure 18: South America NA Safety Connection Devices Market Revenue (Million), by Type 2024 & 2032
- Figure 19: South America NA Safety Connection Devices Market Revenue Share (%), by Type 2024 & 2032
- Figure 20: South America NA Safety Connection Devices Market Revenue (Million), by End-user Industry 2024 & 2032
- Figure 21: South America NA Safety Connection Devices Market Revenue Share (%), by End-user Industry 2024 & 2032
- Figure 22: South America NA Safety Connection Devices Market Revenue (Million), by Country 2024 & 2032
- Figure 23: South America NA Safety Connection Devices Market Revenue Share (%), by Country 2024 & 2032
- Figure 24: Europe NA Safety Connection Devices Market Revenue (Million), by Type 2024 & 2032
- Figure 25: Europe NA Safety Connection Devices Market Revenue Share (%), by Type 2024 & 2032
- Figure 26: Europe NA Safety Connection Devices Market Revenue (Million), by End-user Industry 2024 & 2032
- Figure 27: Europe NA Safety Connection Devices Market Revenue Share (%), by End-user Industry 2024 & 2032
- Figure 28: Europe NA Safety Connection Devices Market Revenue (Million), by Country 2024 & 2032
- Figure 29: Europe NA Safety Connection Devices Market Revenue Share (%), by Country 2024 & 2032
- Figure 30: Middle East & Africa NA Safety Connection Devices Market Revenue (Million), by Type 2024 & 2032
- Figure 31: Middle East & Africa NA Safety Connection Devices Market Revenue Share (%), by Type 2024 & 2032
- Figure 32: Middle East & Africa NA Safety Connection Devices Market Revenue (Million), by End-user Industry 2024 & 2032
- Figure 33: Middle East & Africa NA Safety Connection Devices Market Revenue Share (%), by End-user Industry 2024 & 2032
- Figure 34: Middle East & Africa NA Safety Connection Devices Market Revenue (Million), by Country 2024 & 2032
- Figure 35: Middle East & Africa NA Safety Connection Devices Market Revenue Share (%), by Country 2024 & 2032
- Figure 36: Asia Pacific NA Safety Connection Devices Market Revenue (Million), by Type 2024 & 2032
- Figure 37: Asia Pacific NA Safety Connection Devices Market Revenue Share (%), by Type 2024 & 2032
- Figure 38: Asia Pacific NA Safety Connection Devices Market Revenue (Million), by End-user Industry 2024 & 2032
- Figure 39: Asia Pacific NA Safety Connection Devices Market Revenue Share (%), by End-user Industry 2024 & 2032
- Figure 40: Asia Pacific NA Safety Connection Devices Market Revenue (Million), by Country 2024 & 2032
- Figure 41: Asia Pacific NA Safety Connection Devices Market Revenue Share (%), by Country 2024 & 2032
List of Tables
- Table 1: Global NA Safety Connection Devices Market Revenue Million Forecast, by Region 2019 & 2032
- Table 2: Global NA Safety Connection Devices Market Revenue Million Forecast, by Type 2019 & 2032
- Table 3: Global NA Safety Connection Devices Market Revenue Million Forecast, by End-user Industry 2019 & 2032
- Table 4: Global NA Safety Connection Devices Market Revenue Million Forecast, by Region 2019 & 2032
- Table 5: Global NA Safety Connection Devices Market Revenue Million Forecast, by Country 2019 & 2032
- Table 6: NA Safety Connection Devices Market Revenue (Million) Forecast, by Application 2019 & 2032
- Table 7: Global NA Safety Connection Devices Market Revenue Million Forecast, by Country 2019 & 2032
- Table 8: NA Safety Connection Devices Market Revenue (Million) Forecast, by Application 2019 & 2032
- Table 9: Global NA Safety Connection Devices Market Revenue Million Forecast, by Country 2019 & 2032
- Table 10: NA Safety Connection Devices Market Revenue (Million) Forecast, by Application 2019 & 2032
- Table 11: Global NA Safety Connection Devices Market Revenue Million Forecast, by Country 2019 & 2032
- Table 12: NA Safety Connection Devices Market Revenue (Million) Forecast, by Application 2019 & 2032
- Table 13: Global NA Safety Connection Devices Market Revenue Million Forecast, by Country 2019 & 2032
- Table 14: NA Safety Connection Devices Market Revenue (Million) Forecast, by Application 2019 & 2032
- Table 15: Global NA Safety Connection Devices Market Revenue Million Forecast, by Type 2019 & 2032
- Table 16: Global NA Safety Connection Devices Market Revenue Million Forecast, by End-user Industry 2019 & 2032
- Table 17: Global NA Safety Connection Devices Market Revenue Million Forecast, by Country 2019 & 2032
- Table 18: United States NA Safety Connection Devices Market Revenue (Million) Forecast, by Application 2019 & 2032
- Table 19: Canada NA Safety Connection Devices Market Revenue (Million) Forecast, by Application 2019 & 2032
- Table 20: Mexico NA Safety Connection Devices Market Revenue (Million) Forecast, by Application 2019 & 2032
- Table 21: Global NA Safety Connection Devices Market Revenue Million Forecast, by Type 2019 & 2032
- Table 22: Global NA Safety Connection Devices Market Revenue Million Forecast, by End-user Industry 2019 & 2032
- Table 23: Global NA Safety Connection Devices Market Revenue Million Forecast, by Country 2019 & 2032
- Table 24: Brazil NA Safety Connection Devices Market Revenue (Million) Forecast, by Application 2019 & 2032
- Table 25: Argentina NA Safety Connection Devices Market Revenue (Million) Forecast, by Application 2019 & 2032
- Table 26: Rest of South America NA Safety Connection Devices Market Revenue (Million) Forecast, by Application 2019 & 2032
- Table 27: Global NA Safety Connection Devices Market Revenue Million Forecast, by Type 2019 & 2032
- Table 28: Global NA Safety Connection Devices Market Revenue Million Forecast, by End-user Industry 2019 & 2032
- Table 29: Global NA Safety Connection Devices Market Revenue Million Forecast, by Country 2019 & 2032
- Table 30: United Kingdom NA Safety Connection Devices Market Revenue (Million) Forecast, by Application 2019 & 2032
- Table 31: Germany NA Safety Connection Devices Market Revenue (Million) Forecast, by Application 2019 & 2032
- Table 32: France NA Safety Connection Devices Market Revenue (Million) Forecast, by Application 2019 & 2032
- Table 33: Italy NA Safety Connection Devices Market Revenue (Million) Forecast, by Application 2019 & 2032
- Table 34: Spain NA Safety Connection Devices Market Revenue (Million) Forecast, by Application 2019 & 2032
- Table 35: Russia NA Safety Connection Devices Market Revenue (Million) Forecast, by Application 2019 & 2032
- Table 36: Benelux NA Safety Connection Devices Market Revenue (Million) Forecast, by Application 2019 & 2032
- Table 37: Nordics NA Safety Connection Devices Market Revenue (Million) Forecast, by Application 2019 & 2032
- Table 38: Rest of Europe NA Safety Connection Devices Market Revenue (Million) Forecast, by Application 2019 & 2032
- Table 39: Global NA Safety Connection Devices Market Revenue Million Forecast, by Type 2019 & 2032
- Table 40: Global NA Safety Connection Devices Market Revenue Million Forecast, by End-user Industry 2019 & 2032
- Table 41: Global NA Safety Connection Devices Market Revenue Million Forecast, by Country 2019 & 2032
- Table 42: Turkey NA Safety Connection Devices Market Revenue (Million) Forecast, by Application 2019 & 2032
- Table 43: Israel NA Safety Connection Devices Market Revenue (Million) Forecast, by Application 2019 & 2032
- Table 44: GCC NA Safety Connection Devices Market Revenue (Million) Forecast, by Application 2019 & 2032
- Table 45: North Africa NA Safety Connection Devices Market Revenue (Million) Forecast, by Application 2019 & 2032
- Table 46: South Africa NA Safety Connection Devices Market Revenue (Million) Forecast, by Application 2019 & 2032
- Table 47: Rest of Middle East & Africa NA Safety Connection Devices Market Revenue (Million) Forecast, by Application 2019 & 2032
- Table 48: Global NA Safety Connection Devices Market Revenue Million Forecast, by Type 2019 & 2032
- Table 49: Global NA Safety Connection Devices Market Revenue Million Forecast, by End-user Industry 2019 & 2032
- Table 50: Global NA Safety Connection Devices Market Revenue Million Forecast, by Country 2019 & 2032
- Table 51: China NA Safety Connection Devices Market Revenue (Million) Forecast, by Application 2019 & 2032
- Table 52: India NA Safety Connection Devices Market Revenue (Million) Forecast, by Application 2019 & 2032
- Table 53: Japan NA Safety Connection Devices Market Revenue (Million) Forecast, by Application 2019 & 2032
- Table 54: South Korea NA Safety Connection Devices Market Revenue (Million) Forecast, by Application 2019 & 2032
- Table 55: ASEAN NA Safety Connection Devices Market Revenue (Million) Forecast, by Application 2019 & 2032
- Table 56: Oceania NA Safety Connection Devices Market Revenue (Million) Forecast, by Application 2019 & 2032
- Table 57: Rest of Asia Pacific NA Safety Connection Devices Market Revenue (Million) Forecast, by Application 2019 & 2032
Frequently Asked Questions
1. What is the projected Compound Annual Growth Rate (CAGR) of the NA Safety Connection Devices Market?
The projected CAGR is approximately 9.10%.
2. Which companies are prominent players in the NA Safety Connection Devices Market?
Key companies in the market include Ifm electronic gmbh, Banner Engineering Corp *List Not Exhaustive, Honeywell International Inc, ABB Ltd, Weidmuller Interface GmbH & Co KG, Schneider Electric SE, Bihl + Wiedemann GmbH, Murrelektronik Inc, TE Connectivity Ltd, Advantech Co Ltd, Rockwell Automation Inc, Lumberg Automation Components GmbH.
3. What are the main segments of the NA Safety Connection Devices Market?
The market segments include Type, End-user Industry.
4. Can you provide details about the market size?
The market size is estimated to be USD XX Million as of 2022.
5. What are some drivers contributing to market growth?
Growth in Industry 4.0 and Rapid Factory Automation; Increasing demand of Safety devices in Automotive Industry.
6. What are the notable trends driving market growth?
Automotive Industry to Show Significant Growth.
7. Are there any restraints impacting market growth?
Higher Cost of Devices.
8. Can you provide examples of recent developments in the market?
November 2021 - Tesla is introducing a new at-home wall charger with the capacity to work with all-electric vehicles (EVs) in North America. The charger, which comes with a J1772 connector, is designed for both outdoor and indoor installation and can charge up to 9.6 kW. Tesla vehicle owners can use the device with an adapter.
9. What pricing options are available for accessing the report?
Pricing options include single-user, multi-user, and enterprise licenses priced at USD 4750, USD 4950, and USD 6800 respectively.
10. Is the market size provided in terms of value or volume?
The market size is provided in terms of value, measured in Million.
11. Are there any specific market keywords associated with the report?
Yes, the market keyword associated with the report is "NA Safety Connection Devices Market," which aids in identifying and referencing the specific market segment covered.
12. How do I determine which pricing option suits my needs best?
The pricing options vary based on user requirements and access needs. Individual users may opt for single-user licenses, while businesses requiring broader access may choose multi-user or enterprise licenses for cost-effective access to the report.
13. Are there any additional resources or data provided in the NA Safety Connection Devices Market report?
While the report offers comprehensive insights, it's advisable to review the specific contents or supplementary materials provided to ascertain if additional resources or data are available.
14. How can I stay updated on further developments or reports in the NA Safety Connection Devices Market?
To stay informed about further developments, trends, and reports in the NA Safety Connection Devices Market, consider subscribing to industry newsletters, following relevant companies and organizations, or regularly checking reputable industry news sources and publications.
Methodology
Step 1 - Identification of Relevant Samples Size from Population Database


Step 2 - Approaches for Defining Global Market Size (Value, Volume* & Price*)

Note*: In applicable scenarios
Step 3 - Data Sources
Primary Research
- Web Analytics
- Survey Reports
- Research Institute
- Latest Research Reports
- Opinion Leaders
Secondary Research
- Annual Reports
- White Paper
- Latest Press Release
- Industry Association
- Paid Database
- Investor Presentations

Step 4 - Data Triangulation
Involves using different sources of information in order to increase the validity of a study
These sources are likely to be stakeholders in a program - participants, other researchers, program staff, other community members, and so on.
Then we put all data in single framework & apply various statistical tools to find out the dynamic on the market.
During the analysis stage, feedback from the stakeholder groups would be compared to determine areas of agreement as well as areas of divergence


