
Key Insights
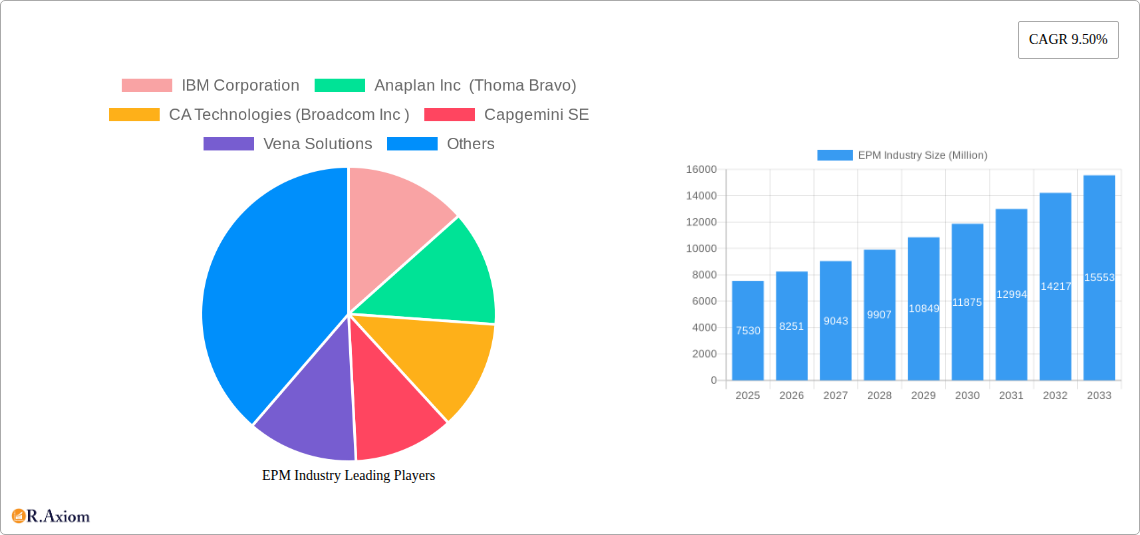
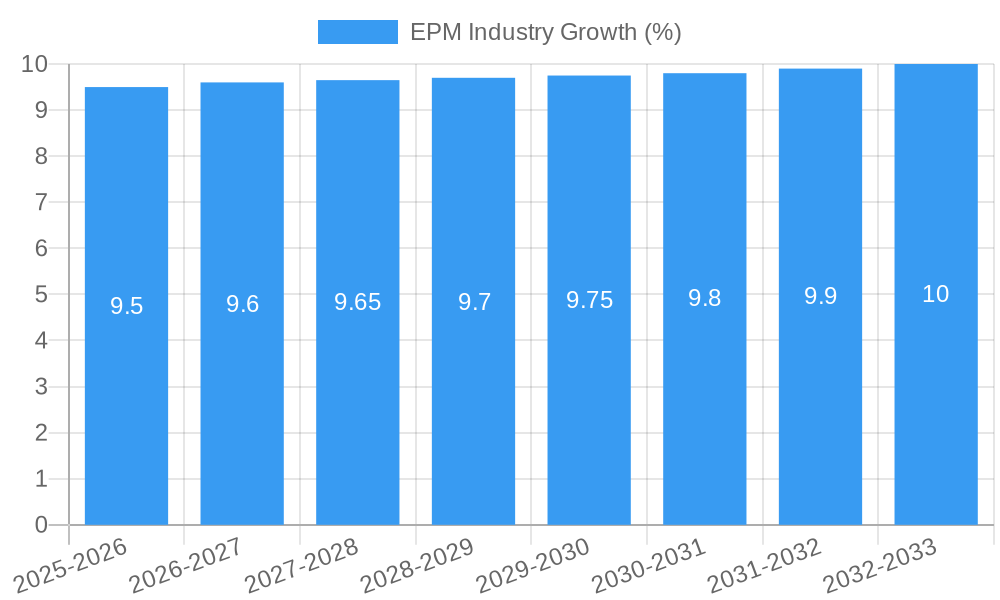
The Enterprise Performance Management (EPM) market is poised for significant expansion, projected to reach approximately $7.53 billion in value by 2025, demonstrating robust growth with a compound annual growth rate (CAGR) of 9.50%. This impressive trajectory is fueled by a confluence of critical market drivers, primarily the increasing demand for enhanced financial planning and analysis (FP&A), the growing complexity of global business operations, and the urgent need for real-time data-driven decision-making. Organizations across all sectors are actively seeking integrated EPM solutions to streamline budgeting, forecasting, reporting, and profitability analysis, thereby improving strategic agility and operational efficiency. The shift towards cloud-based EPM deployments is a dominant trend, offering scalability, accessibility, and cost-effectiveness, particularly attractive to small and medium-sized enterprises (SMEs) seeking to leverage advanced financial management capabilities without substantial upfront infrastructure investment.
Further solidifying this growth are evolving business needs in sectors such as Banking, Financial Services, and Insurance (BFSI), Telecommunications, Healthcare, and Manufacturing. These industries are increasingly adopting EPM solutions to navigate regulatory compliance, manage intricate risk assessments, and optimize resource allocation for improved profitability. While the market benefits from strong demand, certain restraints such as the high initial cost of implementation for comprehensive on-premise solutions and the inherent challenges in data integration from disparate systems can pose hurdles. However, the continuous innovation in AI and machine learning integration within EPM platforms is set to revolutionize how businesses approach performance management, offering predictive analytics and automated insights, thereby accelerating the adoption of these critical financial tools and ensuring sustained market momentum through to 2033.
This in-depth report provides a detailed analysis of the Enterprise Performance Management (EPM) industry, encompassing market dynamics, key players, emerging trends, and strategic outlooks. With a study period spanning from 2019 to 2033, the report leverages the base year 2025 to offer precise insights into the market's current state and project its trajectory through the forecast period (2025-2033), building upon historical data from 2019-2024. This report is designed to equip industry stakeholders, including investors, solution providers, and business leaders, with actionable intelligence to navigate the evolving EPM landscape and capitalize on future opportunities. The estimated market size for EPM solutions is projected to reach 50,000 Million by 2025, with a Compound Annual Growth Rate (CAGR) of 12.5% during the forecast period.
EPM Industry Market Concentration & Innovation
The EPM industry exhibits a moderate level of market concentration, with a blend of large, established enterprise software vendors and agile, specialized solution providers. Innovation is primarily driven by the increasing demand for real-time financial planning, advanced analytics, and seamless integration with other business systems. Key innovation drivers include the adoption of Artificial Intelligence (AI) and Machine Learning (ML) for predictive forecasting, enhanced data visualization capabilities, and the push towards cloud-native EPM solutions offering scalability and accessibility. Regulatory frameworks, such as evolving accounting standards and data privacy regulations (e.g., GDPR, CCPA), also influence EPM solution development, compelling vendors to enhance compliance and security features. Product substitutes, while present in the form of standalone spreadsheets or basic financial reporting tools, are increasingly being overshadowed by comprehensive EPM platforms that offer superior functionality and integration. End-user trends highlight a growing preference for integrated business planning (IBP) and a focus on operationalizing financial plans across the entire organization. Mergers and acquisitions (M&A) remain a significant strategy for market consolidation and capability expansion. Notable M&A deal values in the past have ranged from 500 Million to 5,000 Million, with strategic acquisitions aimed at enhancing cloud offerings or expanding into niche market segments. For instance, Thoma Bravo's acquisition of Anaplan Inc. for an undisclosed, but significant, sum underscores the strategic importance of cloud-based EPM solutions.
EPM Industry Industry Trends & Insights
The Enterprise Performance Management (EPM) industry is experiencing robust growth, fueled by a confluence of technological advancements, evolving business needs, and a strategic shift towards data-driven decision-making. Market growth drivers are primarily centered around the imperative for businesses to achieve greater financial agility, operational efficiency, and strategic alignment. The increasing complexity of global economies, coupled with volatile market conditions, necessitates sophisticated tools for forecasting, budgeting, planning, and reporting. Technological disruptions are revolutionizing the EPM landscape, with cloud computing emerging as a dominant deployment model, offering scalability, flexibility, and reduced IT overhead. The integration of Artificial Intelligence (AI) and Machine Learning (ML) is transforming EPM capabilities, enabling predictive analytics, anomaly detection, and automated scenario planning, leading to more informed and proactive business strategies. Consumer preferences are shifting towards user-friendly interfaces, mobile accessibility, and self-service analytics, empowering business users beyond the finance department to engage with performance management processes. Competitive dynamics are intensifying, with established players continuously innovating and new entrants offering specialized solutions, particularly in niche segments like sustainability reporting or supply chain planning. The market penetration of cloud-based EPM solutions is rapidly increasing, projected to exceed 80% of new deployments by 2027. The CAGR for the EPM market is estimated at 12.5% over the forecast period, driven by the continuous need for organizations to optimize financial performance and gain a competitive edge in an increasingly dynamic business environment. The market is projected to reach a valuation of 50,000 Million by the end of 2025, demonstrating significant expansion and opportunity.
Dominant Markets & Segments in EPM Industry
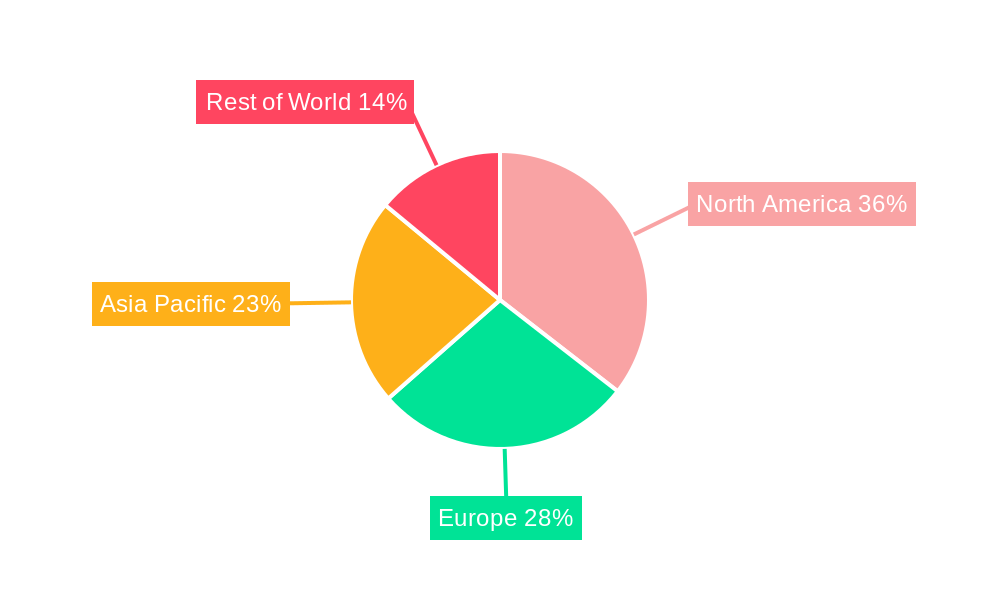
The Cloud deployment segment is currently dominating the EPM industry, driven by its inherent advantages in scalability, cost-effectiveness, and accessibility. This trend is further propelled by the increasing adoption of hybrid cloud strategies, allowing organizations to leverage the best of both on-premise and cloud environments. Within end-user industries, the BFSI (Banking, Financial Services, and Insurance) sector stands out as a leading adopter of EPM solutions. This dominance is attributed to the highly regulated nature of the BFSI industry, which demands stringent financial reporting, risk management, and compliance capabilities. The sheer volume of financial transactions and the need for real-time insights into profitability and risk exposure make EPM solutions indispensable for BFSI organizations.
Key drivers for BFSI dominance include:
- Stringent Regulatory Compliance: EPM solutions facilitate adherence to complex financial regulations like Basel III, IFRS 9, and Solvency II.
- Risk Management: Advanced analytics enable proactive identification and mitigation of financial and operational risks.
- Profitability Analysis: Detailed insights into product, customer, and channel profitability are crucial for strategic decision-making.
- Mergers and Acquisitions (M&A) Activity: The financial sector's high M&A rate necessitates robust EPM tools for integrating disparate financial systems and consolidating reporting.
The Large Enterprise segment also represents a significant portion of the EPM market. These organizations typically have complex organizational structures, extensive data volumes, and a greater need for sophisticated planning and consolidation capabilities. The high value and critical nature of decision-making in large enterprises make them prime candidates for comprehensive EPM suites. Economic policies encouraging digital transformation and investment in enterprise software further bolster the adoption of EPM solutions in this segment.
The Telecommunication sector is another major player, driven by the need to manage complex revenue streams, network investments, and pricing strategies in a highly competitive market. The Manufacturing industry is increasingly adopting EPM for optimizing supply chain costs, production planning, and new product introduction profitability.
EPM Industry Product Developments
Product developments in the EPM industry are increasingly focused on enhancing predictive capabilities, streamlining user experience, and fostering broader business integration. Leading vendors are investing heavily in AI and ML to automate forecasting processes, identify revenue leakage, and provide proactive insights. The expansion of cloud-native architectures offers greater scalability and agility for EPM solutions. Furthermore, there's a growing emphasis on embedding EPM functionalities directly into operational workflows, bridging the gap between financial planning and day-to-day business execution. Competitive advantages are being carved out through advanced scenario planning tools, robust data governance, and seamless integration with other enterprise systems like ERP and CRM, enabling a holistic view of business performance.
Report Scope & Segmentation Analysis
This report segments the EPM market across several key dimensions to provide a granular understanding of market dynamics.
- Deployment: The market is analyzed based on On-premise and Cloud deployments. The Cloud segment is experiencing rapid growth due to its scalability and cost-effectiveness, while On-premise solutions remain relevant for organizations with specific security or regulatory requirements.
- Size of Enterprise: Segments include Small and Medium Enterprises (SME) and Large Enterprises. SMEs are increasingly adopting cloud-based EPM solutions to gain competitive advantages previously only accessible to larger corporations, while large enterprises leverage advanced capabilities for complex financial operations.
- End-user Industry: Key sectors analyzed include BFSI, Telecommunication, Healthcare, Manufacturing, and Other End-user Industries. Each industry presents unique EPM requirements driven by regulatory landscapes, operational complexities, and competitive pressures. Growth projections and market sizes will be detailed for each of these industry verticals, offering insights into their specific adoption rates and investment priorities in EPM solutions.
Key Drivers of EPM Industry Growth
The EPM industry's growth is propelled by several interconnected factors. Technologically, the ubiquitous adoption of cloud computing provides a scalable and accessible platform for EPM solutions, while AI and ML are empowering more sophisticated predictive analytics and automated planning. Economically, businesses are increasingly driven by the need for enhanced financial agility and operational efficiency to navigate volatile global markets and gain a competitive edge. Regulatory landscapes, such as evolving accounting standards and data privacy mandates, necessitate robust EPM capabilities for compliance and risk management. The demand for real-time insights and data-driven decision-making across all business functions is a significant catalyst, pushing organizations to invest in integrated EPM platforms that break down data silos and foster collaboration between finance and operational departments.
Challenges in the EPM Industry Sector
Despite strong growth, the EPM industry faces several challenges. High implementation costs and the complexity of integrating EPM systems with existing IT infrastructures can be significant barriers, particularly for SMEs. The need for skilled personnel to manage and utilize EPM solutions effectively also presents a challenge. Regulatory hurdles, such as ever-changing compliance requirements, demand continuous adaptation of EPM software. Cybersecurity concerns associated with cloud-based EPM solutions require robust security measures. Furthermore, competitive pressures from both established vendors and emerging players necessitate continuous innovation and differentiation. Resistance to change within organizations and the perceived difficulty of adopting new EPM technologies can also slow down market penetration.
Emerging Opportunities in EPM Industry
Emerging opportunities in the EPM industry are centered around expanding into new technological frontiers and catering to evolving business needs. The integration of Environmental, Social, and Governance (ESG) reporting capabilities into EPM platforms presents a significant growth area, as companies face increasing pressure from stakeholders to track and report on sustainability metrics. The rise of data analytics and business intelligence tools is creating a demand for EPM solutions that can seamlessly integrate with these platforms, offering a unified view of performance. The expansion of EPM solutions into operational planning, beyond traditional financial planning, is another key opportunity, enabling integrated business planning (IBP) across the entire value chain. Furthermore, the increasing adoption of AI and ML is opening doors for more intelligent automation, predictive insights, and prescriptive analytics within EPM.
Leading Players in the EPM Industry Market
- IBM Corporation
- Anaplan Inc (Thoma Bravo)
- CA Technologies (Broadcom Inc)
- Capgemini SE
- Vena Solutions
- Adaptive Insights Inc (Workday Inc)
- Oracle Corporation
- Talentia Software
- Workiva Inc
- HCL Technologies Limited
- SAP SE
Key Developments in EPM Industry Industry
- April 2022: Oracle Corporation extended support for the Hyperion Enterprise Performance Management 11.2, including Oracle Applications Unlimited, through at least 2033. The Oracle Applications covered under the extension include Hyperion, PeopleSoft, Siebel CRM, Oracle E-Business Suite, and others. This development underscores Oracle's commitment to its existing EPM customer base and provides long-term stability for users of these critical financial systems.
- January 2022: PT Metrodata Electronics Tbk (Metrodata) became a regional integration partner of Anaplan Insights Inc. to deliver cloud-based enterprise performance management to its clients in Indonesia. Metrodata is among the prominent technology distributors and resellers in Indonesia. This partnership would introduce Anaplan's Connected Planning platform to enterprise and corporate clients looking for agility and real-time insights, indicating a growing focus on expanding cloud EPM reach in emerging markets.
Strategic Outlook for EPM Industry Market
The strategic outlook for the EPM industry remains exceptionally strong, driven by the fundamental need for organizations to achieve greater financial transparency, operational efficiency, and strategic agility. The ongoing digital transformation initiatives across all sectors, coupled with the increasing complexity of the global business environment, will continue to fuel the demand for sophisticated EPM solutions. The growing emphasis on data-driven decision-making and the integration of AI and ML will further elevate the capabilities of EPM platforms, transforming them from mere reporting tools into strategic intelligence engines. Opportunities lie in expanding offerings to encompass ESG reporting and operational planning, thereby providing a more holistic view of business performance. Strategic partnerships and continued innovation in cloud-native technologies will be critical for vendors to maintain a competitive edge and capture market share in this dynamic and expanding industry.
EPM Industry Segmentation
-
1. Deployment
- 1.1. On-premise
- 1.2. Cloud
-
2. Size of Enterprise
- 2.1. Small and Medium
- 2.2. Large
-
3. End-user Industry
- 3.1. BFSI
- 3.2. Telecommunication
- 3.3. Healthcare
- 3.4. Manufacturing
- 3.5. Other End -user Industries
EPM Industry Segmentation By Geography
- 1. North America
- 2. Europe
- 3. Asia Pacific
- 4. Rest of World
EPM Industry REPORT HIGHLIGHTS
| Aspects | Details |
|---|---|
| Study Period | 2019-2033 |
| Base Year | 2024 |
| Estimated Year | 2025 |
| Forecast Period | 2025-2033 |
| Historical Period | 2019-2024 |
| Growth Rate | CAGR of 9.50% from 2019-2033 |
| Segmentation |
|
Table of Contents
- 1. Introduction
- 1.1. Research Scope
- 1.2. Market Segmentation
- 1.3. Research Methodology
- 1.4. Definitions and Assumptions
- 2. Executive Summary
- 2.1. Introduction
- 3. Market Dynamics
- 3.1. Introduction
- 3.2. Market Drivers
- 3.2.1. Need for Minimizing Operational Expenses; Proliferation of Data Driven Decision Making
- 3.3. Market Restrains
- 3.3.1. Lack of Awareness and Knowledge Among Enterprises
- 3.4. Market Trends
- 3.4.1. BFSI Sector is Expected to Account for Major Market Share
- 4. Market Factor Analysis
- 4.1. Porters Five Forces
- 4.2. Supply/Value Chain
- 4.3. PESTEL analysis
- 4.4. Market Entropy
- 4.5. Patent/Trademark Analysis
- 5. Global EPM Industry Analysis, Insights and Forecast, 2019-2031
- 5.1. Market Analysis, Insights and Forecast - by Deployment
- 5.1.1. On-premise
- 5.1.2. Cloud
- 5.2. Market Analysis, Insights and Forecast - by Size of Enterprise
- 5.2.1. Small and Medium
- 5.2.2. Large
- 5.3. Market Analysis, Insights and Forecast - by End-user Industry
- 5.3.1. BFSI
- 5.3.2. Telecommunication
- 5.3.3. Healthcare
- 5.3.4. Manufacturing
- 5.3.5. Other End -user Industries
- 5.4. Market Analysis, Insights and Forecast - by Region
- 5.4.1. North America
- 5.4.2. Europe
- 5.4.3. Asia Pacific
- 5.4.4. Rest of World
- 5.1. Market Analysis, Insights and Forecast - by Deployment
- 6. North America EPM Industry Analysis, Insights and Forecast, 2019-2031
- 6.1. Market Analysis, Insights and Forecast - by Deployment
- 6.1.1. On-premise
- 6.1.2. Cloud
- 6.2. Market Analysis, Insights and Forecast - by Size of Enterprise
- 6.2.1. Small and Medium
- 6.2.2. Large
- 6.3. Market Analysis, Insights and Forecast - by End-user Industry
- 6.3.1. BFSI
- 6.3.2. Telecommunication
- 6.3.3. Healthcare
- 6.3.4. Manufacturing
- 6.3.5. Other End -user Industries
- 6.1. Market Analysis, Insights and Forecast - by Deployment
- 7. Europe EPM Industry Analysis, Insights and Forecast, 2019-2031
- 7.1. Market Analysis, Insights and Forecast - by Deployment
- 7.1.1. On-premise
- 7.1.2. Cloud
- 7.2. Market Analysis, Insights and Forecast - by Size of Enterprise
- 7.2.1. Small and Medium
- 7.2.2. Large
- 7.3. Market Analysis, Insights and Forecast - by End-user Industry
- 7.3.1. BFSI
- 7.3.2. Telecommunication
- 7.3.3. Healthcare
- 7.3.4. Manufacturing
- 7.3.5. Other End -user Industries
- 7.1. Market Analysis, Insights and Forecast - by Deployment
- 8. Asia Pacific EPM Industry Analysis, Insights and Forecast, 2019-2031
- 8.1. Market Analysis, Insights and Forecast - by Deployment
- 8.1.1. On-premise
- 8.1.2. Cloud
- 8.2. Market Analysis, Insights and Forecast - by Size of Enterprise
- 8.2.1. Small and Medium
- 8.2.2. Large
- 8.3. Market Analysis, Insights and Forecast - by End-user Industry
- 8.3.1. BFSI
- 8.3.2. Telecommunication
- 8.3.3. Healthcare
- 8.3.4. Manufacturing
- 8.3.5. Other End -user Industries
- 8.1. Market Analysis, Insights and Forecast - by Deployment
- 9. Rest of World EPM Industry Analysis, Insights and Forecast, 2019-2031
- 9.1. Market Analysis, Insights and Forecast - by Deployment
- 9.1.1. On-premise
- 9.1.2. Cloud
- 9.2. Market Analysis, Insights and Forecast - by Size of Enterprise
- 9.2.1. Small and Medium
- 9.2.2. Large
- 9.3. Market Analysis, Insights and Forecast - by End-user Industry
- 9.3.1. BFSI
- 9.3.2. Telecommunication
- 9.3.3. Healthcare
- 9.3.4. Manufacturing
- 9.3.5. Other End -user Industries
- 9.1. Market Analysis, Insights and Forecast - by Deployment
- 10. North America EPM Industry Analysis, Insights and Forecast, 2019-2031
- 10.1. Market Analysis, Insights and Forecast - By Country/Sub-region
- 10.1.1 United States
- 10.1.2 Canada
- 10.1.3 Mexico
- 11. Europe EPM Industry Analysis, Insights and Forecast, 2019-2031
- 11.1. Market Analysis, Insights and Forecast - By Country/Sub-region
- 11.1.1 Germany
- 11.1.2 United Kingdom
- 11.1.3 France
- 11.1.4 Spain
- 11.1.5 Italy
- 11.1.6 Spain
- 11.1.7 Belgium
- 11.1.8 Netherland
- 11.1.9 Nordics
- 11.1.10 Rest of Europe
- 12. Asia Pacific EPM Industry Analysis, Insights and Forecast, 2019-2031
- 12.1. Market Analysis, Insights and Forecast - By Country/Sub-region
- 12.1.1 China
- 12.1.2 Japan
- 12.1.3 India
- 12.1.4 South Korea
- 12.1.5 Southeast Asia
- 12.1.6 Australia
- 12.1.7 Indonesia
- 12.1.8 Phillipes
- 12.1.9 Singapore
- 12.1.10 Thailandc
- 12.1.11 Rest of Asia Pacific
- 13. South America EPM Industry Analysis, Insights and Forecast, 2019-2031
- 13.1. Market Analysis, Insights and Forecast - By Country/Sub-region
- 13.1.1 Brazil
- 13.1.2 Argentina
- 13.1.3 Peru
- 13.1.4 Chile
- 13.1.5 Colombia
- 13.1.6 Ecuador
- 13.1.7 Venezuela
- 13.1.8 Rest of South America
- 14. North America EPM Industry Analysis, Insights and Forecast, 2019-2031
- 14.1. Market Analysis, Insights and Forecast - By Country/Sub-region
- 14.1.1 United States
- 14.1.2 Canada
- 14.1.3 Mexico
- 15. MEA EPM Industry Analysis, Insights and Forecast, 2019-2031
- 15.1. Market Analysis, Insights and Forecast - By Country/Sub-region
- 15.1.1 United Arab Emirates
- 15.1.2 Saudi Arabia
- 15.1.3 South Africa
- 15.1.4 Rest of Middle East and Africa
- 16. Competitive Analysis
- 16.1. Global Market Share Analysis 2024
- 16.2. Company Profiles
- 16.2.1 IBM Corporation
- 16.2.1.1. Overview
- 16.2.1.2. Products
- 16.2.1.3. SWOT Analysis
- 16.2.1.4. Recent Developments
- 16.2.1.5. Financials (Based on Availability)
- 16.2.2 Anaplan Inc (Thoma Bravo)
- 16.2.2.1. Overview
- 16.2.2.2. Products
- 16.2.2.3. SWOT Analysis
- 16.2.2.4. Recent Developments
- 16.2.2.5. Financials (Based on Availability)
- 16.2.3 CA Technologies (Broadcom Inc )
- 16.2.3.1. Overview
- 16.2.3.2. Products
- 16.2.3.3. SWOT Analysis
- 16.2.3.4. Recent Developments
- 16.2.3.5. Financials (Based on Availability)
- 16.2.4 Capgemini SE
- 16.2.4.1. Overview
- 16.2.4.2. Products
- 16.2.4.3. SWOT Analysis
- 16.2.4.4. Recent Developments
- 16.2.4.5. Financials (Based on Availability)
- 16.2.5 Vena Solutions
- 16.2.5.1. Overview
- 16.2.5.2. Products
- 16.2.5.3. SWOT Analysis
- 16.2.5.4. Recent Developments
- 16.2.5.5. Financials (Based on Availability)
- 16.2.6 Adaptive Insights Inc (Workday Inc )
- 16.2.6.1. Overview
- 16.2.6.2. Products
- 16.2.6.3. SWOT Analysis
- 16.2.6.4. Recent Developments
- 16.2.6.5. Financials (Based on Availability)
- 16.2.7 Oracle Corporation
- 16.2.7.1. Overview
- 16.2.7.2. Products
- 16.2.7.3. SWOT Analysis
- 16.2.7.4. Recent Developments
- 16.2.7.5. Financials (Based on Availability)
- 16.2.8 Talentia Software*List Not Exhaustive
- 16.2.8.1. Overview
- 16.2.8.2. Products
- 16.2.8.3. SWOT Analysis
- 16.2.8.4. Recent Developments
- 16.2.8.5. Financials (Based on Availability)
- 16.2.9 Workiva Inc
- 16.2.9.1. Overview
- 16.2.9.2. Products
- 16.2.9.3. SWOT Analysis
- 16.2.9.4. Recent Developments
- 16.2.9.5. Financials (Based on Availability)
- 16.2.10 HCL Technologies Limited
- 16.2.10.1. Overview
- 16.2.10.2. Products
- 16.2.10.3. SWOT Analysis
- 16.2.10.4. Recent Developments
- 16.2.10.5. Financials (Based on Availability)
- 16.2.11 SAP SE
- 16.2.11.1. Overview
- 16.2.11.2. Products
- 16.2.11.3. SWOT Analysis
- 16.2.11.4. Recent Developments
- 16.2.11.5. Financials (Based on Availability)
- 16.2.1 IBM Corporation
List of Figures
- Figure 1: Global EPM Industry Revenue Breakdown (Million, %) by Region 2024 & 2032
- Figure 2: North America EPM Industry Revenue (Million), by Country 2024 & 2032
- Figure 3: North America EPM Industry Revenue Share (%), by Country 2024 & 2032
- Figure 4: Europe EPM Industry Revenue (Million), by Country 2024 & 2032
- Figure 5: Europe EPM Industry Revenue Share (%), by Country 2024 & 2032
- Figure 6: Asia Pacific EPM Industry Revenue (Million), by Country 2024 & 2032
- Figure 7: Asia Pacific EPM Industry Revenue Share (%), by Country 2024 & 2032
- Figure 8: South America EPM Industry Revenue (Million), by Country 2024 & 2032
- Figure 9: South America EPM Industry Revenue Share (%), by Country 2024 & 2032
- Figure 10: North America EPM Industry Revenue (Million), by Country 2024 & 2032
- Figure 11: North America EPM Industry Revenue Share (%), by Country 2024 & 2032
- Figure 12: MEA EPM Industry Revenue (Million), by Country 2024 & 2032
- Figure 13: MEA EPM Industry Revenue Share (%), by Country 2024 & 2032
- Figure 14: North America EPM Industry Revenue (Million), by Deployment 2024 & 2032
- Figure 15: North America EPM Industry Revenue Share (%), by Deployment 2024 & 2032
- Figure 16: North America EPM Industry Revenue (Million), by Size of Enterprise 2024 & 2032
- Figure 17: North America EPM Industry Revenue Share (%), by Size of Enterprise 2024 & 2032
- Figure 18: North America EPM Industry Revenue (Million), by End-user Industry 2024 & 2032
- Figure 19: North America EPM Industry Revenue Share (%), by End-user Industry 2024 & 2032
- Figure 20: North America EPM Industry Revenue (Million), by Country 2024 & 2032
- Figure 21: North America EPM Industry Revenue Share (%), by Country 2024 & 2032
- Figure 22: Europe EPM Industry Revenue (Million), by Deployment 2024 & 2032
- Figure 23: Europe EPM Industry Revenue Share (%), by Deployment 2024 & 2032
- Figure 24: Europe EPM Industry Revenue (Million), by Size of Enterprise 2024 & 2032
- Figure 25: Europe EPM Industry Revenue Share (%), by Size of Enterprise 2024 & 2032
- Figure 26: Europe EPM Industry Revenue (Million), by End-user Industry 2024 & 2032
- Figure 27: Europe EPM Industry Revenue Share (%), by End-user Industry 2024 & 2032
- Figure 28: Europe EPM Industry Revenue (Million), by Country 2024 & 2032
- Figure 29: Europe EPM Industry Revenue Share (%), by Country 2024 & 2032
- Figure 30: Asia Pacific EPM Industry Revenue (Million), by Deployment 2024 & 2032
- Figure 31: Asia Pacific EPM Industry Revenue Share (%), by Deployment 2024 & 2032
- Figure 32: Asia Pacific EPM Industry Revenue (Million), by Size of Enterprise 2024 & 2032
- Figure 33: Asia Pacific EPM Industry Revenue Share (%), by Size of Enterprise 2024 & 2032
- Figure 34: Asia Pacific EPM Industry Revenue (Million), by End-user Industry 2024 & 2032
- Figure 35: Asia Pacific EPM Industry Revenue Share (%), by End-user Industry 2024 & 2032
- Figure 36: Asia Pacific EPM Industry Revenue (Million), by Country 2024 & 2032
- Figure 37: Asia Pacific EPM Industry Revenue Share (%), by Country 2024 & 2032
- Figure 38: Rest of World EPM Industry Revenue (Million), by Deployment 2024 & 2032
- Figure 39: Rest of World EPM Industry Revenue Share (%), by Deployment 2024 & 2032
- Figure 40: Rest of World EPM Industry Revenue (Million), by Size of Enterprise 2024 & 2032
- Figure 41: Rest of World EPM Industry Revenue Share (%), by Size of Enterprise 2024 & 2032
- Figure 42: Rest of World EPM Industry Revenue (Million), by End-user Industry 2024 & 2032
- Figure 43: Rest of World EPM Industry Revenue Share (%), by End-user Industry 2024 & 2032
- Figure 44: Rest of World EPM Industry Revenue (Million), by Country 2024 & 2032
- Figure 45: Rest of World EPM Industry Revenue Share (%), by Country 2024 & 2032
List of Tables
- Table 1: Global EPM Industry Revenue Million Forecast, by Region 2019 & 2032
- Table 2: Global EPM Industry Revenue Million Forecast, by Deployment 2019 & 2032
- Table 3: Global EPM Industry Revenue Million Forecast, by Size of Enterprise 2019 & 2032
- Table 4: Global EPM Industry Revenue Million Forecast, by End-user Industry 2019 & 2032
- Table 5: Global EPM Industry Revenue Million Forecast, by Region 2019 & 2032
- Table 6: Global EPM Industry Revenue Million Forecast, by Country 2019 & 2032
- Table 7: United States EPM Industry Revenue (Million) Forecast, by Application 2019 & 2032
- Table 8: Canada EPM Industry Revenue (Million) Forecast, by Application 2019 & 2032
- Table 9: Mexico EPM Industry Revenue (Million) Forecast, by Application 2019 & 2032
- Table 10: Global EPM Industry Revenue Million Forecast, by Country 2019 & 2032
- Table 11: Germany EPM Industry Revenue (Million) Forecast, by Application 2019 & 2032
- Table 12: United Kingdom EPM Industry Revenue (Million) Forecast, by Application 2019 & 2032
- Table 13: France EPM Industry Revenue (Million) Forecast, by Application 2019 & 2032
- Table 14: Spain EPM Industry Revenue (Million) Forecast, by Application 2019 & 2032
- Table 15: Italy EPM Industry Revenue (Million) Forecast, by Application 2019 & 2032
- Table 16: Spain EPM Industry Revenue (Million) Forecast, by Application 2019 & 2032
- Table 17: Belgium EPM Industry Revenue (Million) Forecast, by Application 2019 & 2032
- Table 18: Netherland EPM Industry Revenue (Million) Forecast, by Application 2019 & 2032
- Table 19: Nordics EPM Industry Revenue (Million) Forecast, by Application 2019 & 2032
- Table 20: Rest of Europe EPM Industry Revenue (Million) Forecast, by Application 2019 & 2032
- Table 21: Global EPM Industry Revenue Million Forecast, by Country 2019 & 2032
- Table 22: China EPM Industry Revenue (Million) Forecast, by Application 2019 & 2032
- Table 23: Japan EPM Industry Revenue (Million) Forecast, by Application 2019 & 2032
- Table 24: India EPM Industry Revenue (Million) Forecast, by Application 2019 & 2032
- Table 25: South Korea EPM Industry Revenue (Million) Forecast, by Application 2019 & 2032
- Table 26: Southeast Asia EPM Industry Revenue (Million) Forecast, by Application 2019 & 2032
- Table 27: Australia EPM Industry Revenue (Million) Forecast, by Application 2019 & 2032
- Table 28: Indonesia EPM Industry Revenue (Million) Forecast, by Application 2019 & 2032
- Table 29: Phillipes EPM Industry Revenue (Million) Forecast, by Application 2019 & 2032
- Table 30: Singapore EPM Industry Revenue (Million) Forecast, by Application 2019 & 2032
- Table 31: Thailandc EPM Industry Revenue (Million) Forecast, by Application 2019 & 2032
- Table 32: Rest of Asia Pacific EPM Industry Revenue (Million) Forecast, by Application 2019 & 2032
- Table 33: Global EPM Industry Revenue Million Forecast, by Country 2019 & 2032
- Table 34: Brazil EPM Industry Revenue (Million) Forecast, by Application 2019 & 2032
- Table 35: Argentina EPM Industry Revenue (Million) Forecast, by Application 2019 & 2032
- Table 36: Peru EPM Industry Revenue (Million) Forecast, by Application 2019 & 2032
- Table 37: Chile EPM Industry Revenue (Million) Forecast, by Application 2019 & 2032
- Table 38: Colombia EPM Industry Revenue (Million) Forecast, by Application 2019 & 2032
- Table 39: Ecuador EPM Industry Revenue (Million) Forecast, by Application 2019 & 2032
- Table 40: Venezuela EPM Industry Revenue (Million) Forecast, by Application 2019 & 2032
- Table 41: Rest of South America EPM Industry Revenue (Million) Forecast, by Application 2019 & 2032
- Table 42: Global EPM Industry Revenue Million Forecast, by Country 2019 & 2032
- Table 43: United States EPM Industry Revenue (Million) Forecast, by Application 2019 & 2032
- Table 44: Canada EPM Industry Revenue (Million) Forecast, by Application 2019 & 2032
- Table 45: Mexico EPM Industry Revenue (Million) Forecast, by Application 2019 & 2032
- Table 46: Global EPM Industry Revenue Million Forecast, by Country 2019 & 2032
- Table 47: United Arab Emirates EPM Industry Revenue (Million) Forecast, by Application 2019 & 2032
- Table 48: Saudi Arabia EPM Industry Revenue (Million) Forecast, by Application 2019 & 2032
- Table 49: South Africa EPM Industry Revenue (Million) Forecast, by Application 2019 & 2032
- Table 50: Rest of Middle East and Africa EPM Industry Revenue (Million) Forecast, by Application 2019 & 2032
- Table 51: Global EPM Industry Revenue Million Forecast, by Deployment 2019 & 2032
- Table 52: Global EPM Industry Revenue Million Forecast, by Size of Enterprise 2019 & 2032
- Table 53: Global EPM Industry Revenue Million Forecast, by End-user Industry 2019 & 2032
- Table 54: Global EPM Industry Revenue Million Forecast, by Country 2019 & 2032
- Table 55: Global EPM Industry Revenue Million Forecast, by Deployment 2019 & 2032
- Table 56: Global EPM Industry Revenue Million Forecast, by Size of Enterprise 2019 & 2032
- Table 57: Global EPM Industry Revenue Million Forecast, by End-user Industry 2019 & 2032
- Table 58: Global EPM Industry Revenue Million Forecast, by Country 2019 & 2032
- Table 59: Global EPM Industry Revenue Million Forecast, by Deployment 2019 & 2032
- Table 60: Global EPM Industry Revenue Million Forecast, by Size of Enterprise 2019 & 2032
- Table 61: Global EPM Industry Revenue Million Forecast, by End-user Industry 2019 & 2032
- Table 62: Global EPM Industry Revenue Million Forecast, by Country 2019 & 2032
- Table 63: Global EPM Industry Revenue Million Forecast, by Deployment 2019 & 2032
- Table 64: Global EPM Industry Revenue Million Forecast, by Size of Enterprise 2019 & 2032
- Table 65: Global EPM Industry Revenue Million Forecast, by End-user Industry 2019 & 2032
- Table 66: Global EPM Industry Revenue Million Forecast, by Country 2019 & 2032
Frequently Asked Questions
1. What is the projected Compound Annual Growth Rate (CAGR) of the EPM Industry?
The projected CAGR is approximately 9.50%.
2. Which companies are prominent players in the EPM Industry?
Key companies in the market include IBM Corporation, Anaplan Inc (Thoma Bravo), CA Technologies (Broadcom Inc ), Capgemini SE, Vena Solutions, Adaptive Insights Inc (Workday Inc ), Oracle Corporation, Talentia Software*List Not Exhaustive, Workiva Inc, HCL Technologies Limited, SAP SE.
3. What are the main segments of the EPM Industry?
The market segments include Deployment, Size of Enterprise, End-user Industry.
4. Can you provide details about the market size?
The market size is estimated to be USD 7.53 Million as of 2022.
5. What are some drivers contributing to market growth?
Need for Minimizing Operational Expenses; Proliferation of Data Driven Decision Making.
6. What are the notable trends driving market growth?
BFSI Sector is Expected to Account for Major Market Share.
7. Are there any restraints impacting market growth?
Lack of Awareness and Knowledge Among Enterprises.
8. Can you provide examples of recent developments in the market?
April 2022 - Oracle Corporation extended support for the Hyperion Enterprise Performance Management 11.2, including Oracle Applications Unlimited, through at least 2033. The Oracle Applications covered under the extension include Hyperion, PeopleSoft, Siebel CRM, Oracle E-Business Suite, and others.
9. What pricing options are available for accessing the report?
Pricing options include single-user, multi-user, and enterprise licenses priced at USD 4750, USD 5250, and USD 8750 respectively.
10. Is the market size provided in terms of value or volume?
The market size is provided in terms of value, measured in Million.
11. Are there any specific market keywords associated with the report?
Yes, the market keyword associated with the report is "EPM Industry," which aids in identifying and referencing the specific market segment covered.
12. How do I determine which pricing option suits my needs best?
The pricing options vary based on user requirements and access needs. Individual users may opt for single-user licenses, while businesses requiring broader access may choose multi-user or enterprise licenses for cost-effective access to the report.
13. Are there any additional resources or data provided in the EPM Industry report?
While the report offers comprehensive insights, it's advisable to review the specific contents or supplementary materials provided to ascertain if additional resources or data are available.
14. How can I stay updated on further developments or reports in the EPM Industry?
To stay informed about further developments, trends, and reports in the EPM Industry, consider subscribing to industry newsletters, following relevant companies and organizations, or regularly checking reputable industry news sources and publications.
Methodology
Step 1 - Identification of Relevant Samples Size from Population Database


Step 2 - Approaches for Defining Global Market Size (Value, Volume* & Price*)

Note*: In applicable scenarios
Step 3 - Data Sources
Primary Research
- Web Analytics
- Survey Reports
- Research Institute
- Latest Research Reports
- Opinion Leaders
Secondary Research
- Annual Reports
- White Paper
- Latest Press Release
- Industry Association
- Paid Database
- Investor Presentations

Step 4 - Data Triangulation
Involves using different sources of information in order to increase the validity of a study
These sources are likely to be stakeholders in a program - participants, other researchers, program staff, other community members, and so on.
Then we put all data in single framework & apply various statistical tools to find out the dynamic on the market.
During the analysis stage, feedback from the stakeholder groups would be compared to determine areas of agreement as well as areas of divergence


