
Key Insights
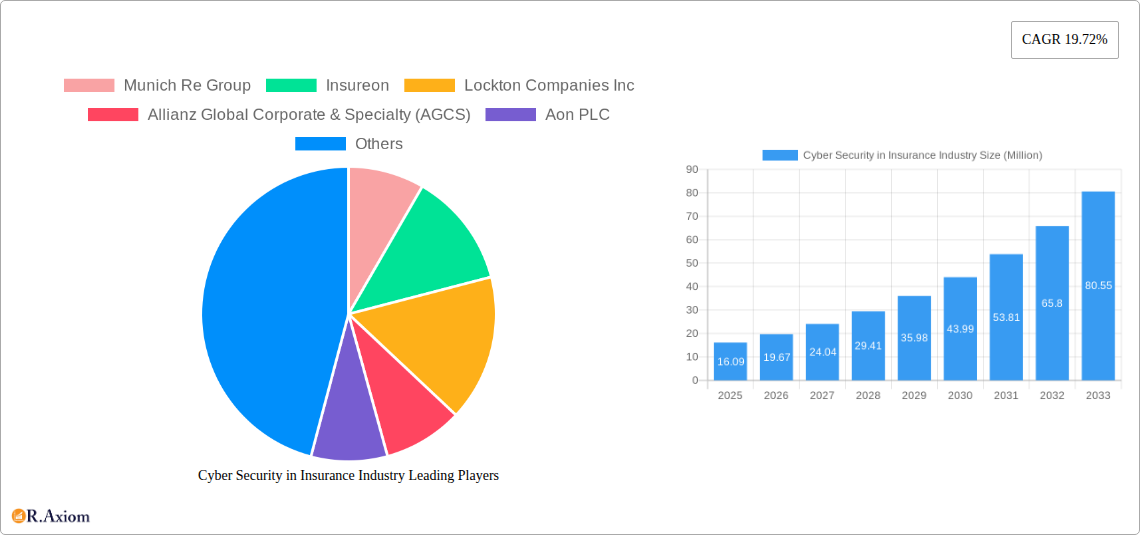
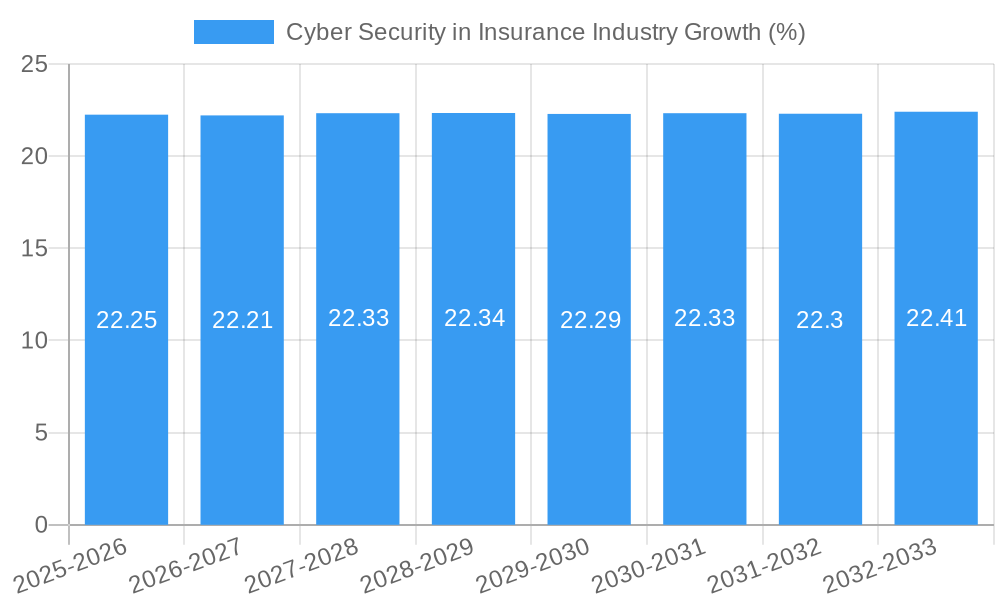
The Cyber Security in Insurance Industry is poised for significant expansion, with a projected market size of USD 16.09 million and an impressive Compound Annual Growth Rate (CAGR) of 19.72% between 2025 and 2033. This robust growth is fundamentally driven by the escalating sophistication and frequency of cyber threats targeting insurance companies and their vast repositories of sensitive customer data. The increasing reliance on digital platforms for policy management, claims processing, and customer interactions has amplified the attack surface, necessitating substantial investments in advanced cyber defenses. Furthermore, stringent regulatory frameworks like GDPR and CCPA are compelling insurers to prioritize data protection and cybersecurity measures to avoid hefty penalties and maintain customer trust. Key trends shaping this market include the adoption of AI and machine learning for threat detection and response, the rise of cloud-based security solutions for scalability and flexibility, and the growing demand for cyber insurance policies themselves, creating a dual-engine of growth for cybersecurity providers within the insurance sector.
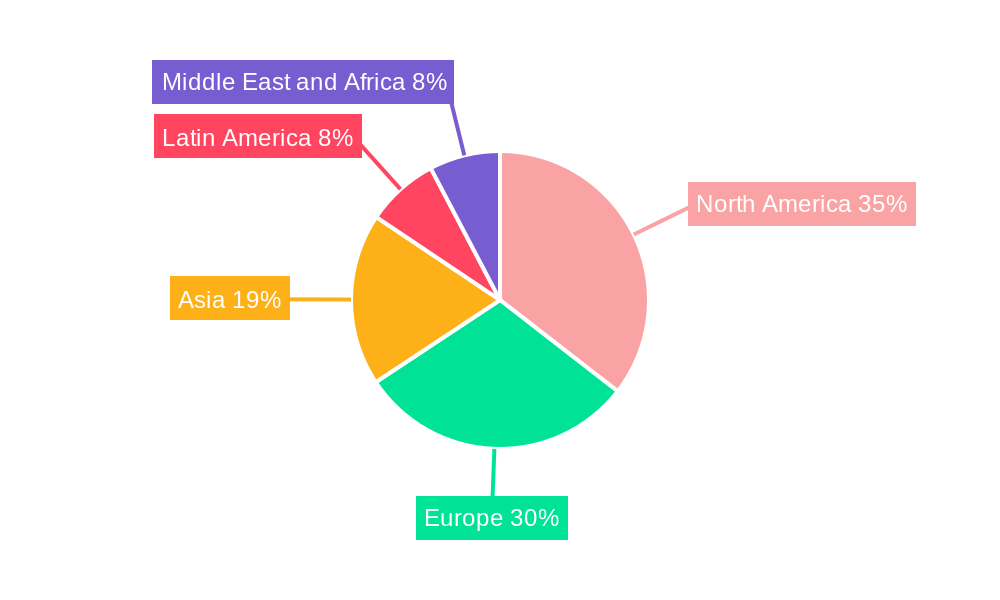
The market segmentation reveals a strong demand across various organization sizes, with large enterprises and small to medium-sized enterprises (SMEs) both actively seeking robust cyber solutions. End-user industries such as Retail, BFSI (Banking, Financial Services, and Insurance), and Healthcare are particularly vulnerable and are therefore key adopters of cybersecurity technologies and services. Geographically, North America and Europe currently lead in market penetration due to established regulatory landscapes and higher cyber insurance adoption rates. However, the Asia-Pacific region, spurred by rapid digitalization and increasing cyber awareness in countries like India and China, is emerging as a high-growth frontier. Emerging restraints, such as the high cost of implementing comprehensive cybersecurity solutions and a global shortage of skilled cybersecurity professionals, present challenges. However, the continuous evolution of cyber threats, coupled with the imperative to safeguard critical data and maintain business continuity, ensures that the cyber security market within the insurance industry will continue its upward trajectory.
Cyber Security in Insurance Industry Market Concentration & Innovation
The cyber security in insurance industry is characterized by a moderately concentrated market landscape, with key players like Munich Re Group, Allianz Global Corporate & Specialty (AGCS), Aon PLC, American International Group Inc. (AIG), and The Chubb Corporation holding significant market share, estimated to be around 75% collectively in 2025. Innovation is primarily driven by the escalating sophistication of cyber threats and the increasing demand for comprehensive cyber risk management solutions. Regulatory frameworks are rapidly evolving globally, pushing insurers to bolster their cyber security offerings and internal defenses, with compliance costs anticipated to reach over $500 Million annually. Product substitutes, such as traditional IT security measures, are increasingly being integrated with specialized cyber insurance policies, blurring the lines and enhancing value propositions. End-user trends indicate a growing preference for integrated cyber risk solutions, encompassing proactive security measures, incident response, and robust insurance coverage, particularly within the BFSI and Healthcare sectors. Mergers and acquisitions (M&A) are playing a crucial role in market consolidation and the acquisition of specialized cyber security capabilities. Notable M&A deals in the historical period (2019-2024) are estimated to have a cumulative value exceeding $10 Billion, facilitating market expansion and technological advancement.
Cyber Security in Insurance Industry Industry Trends & Insights
The cyber security in insurance industry is projected for robust growth, driven by an increasing frequency and severity of cyber-attacks, estimated to impact over 90% of businesses globally by 2030. The Compound Annual Growth Rate (CAGR) for the cyber insurance market is expected to be a significant 18% between 2025 and 2033. Market penetration, currently at approximately 20% for large enterprises and 5% for SMEs, is poised for substantial expansion as awareness of cyber risks and the need for financial protection grows. Technological disruptions, including the proliferation of ransomware, advanced persistent threats (APTs), and the growing attack surface due to IoT adoption, are compelling insurers to continuously innovate their product portfolios and underwriting practices. Consumer preferences are shifting towards more holistic cyber risk management solutions, where insurance acts as a financial backstop to comprehensive security strategies. This includes demand for services like threat intelligence, vulnerability assessments, and incident response support. The competitive dynamics are intensifying, with traditional insurers facing competition from insurtech startups and specialized cyber security firms entering the insurance domain. The integration of Artificial Intelligence (AI) and Machine Learning (ML) in underwriting, claims processing, and threat detection is becoming a critical differentiator. Furthermore, the growing reliance on cloud infrastructure by businesses across all sectors is creating new avenues for cyber insurance products and services. The increasing value of data and intellectual property makes these assets prime targets, escalating the potential financial losses for businesses and thus, the demand for adequate insurance coverage. The evolving regulatory landscape, with stricter data privacy laws like GDPR and CCPA, further necessitates robust cyber security measures and insurance.
Dominant Markets & Segments in Cyber Security in Insurance Industry
The BFSI (Banking, Financial Services, and Insurance) sector stands as the dominant end-user industry within the cyber security in insurance industry. This dominance is fueled by the sector's highly sensitive data assets, stringent regulatory requirements, and the substantial financial implications of cyber breaches, with potential losses per incident estimated to exceed $10 Million for financial institutions.
- Key Drivers for BFSI Dominance:
- High Value of Data: Financial institutions handle immense volumes of sensitive customer data, including personal identifiable information (PII), financial account details, and transaction histories, making them prime targets for cybercriminals.
- Regulatory Scrutiny: The BFSI sector is subject to rigorous compliance mandates (e.g., PCI DSS, GLBA, SOX) that necessitate strong cyber security postures and robust incident response capabilities, often covered by specialized insurance.
- Interconnectedness: The interconnected nature of the financial ecosystem means a breach in one institution can have cascading effects across the entire industry, increasing the overall risk appetite for comprehensive cyber insurance.
- Financial Impact of Breaches: The direct financial losses from fraud, theft, and operational disruptions can be catastrophic for BFSI entities, making cyber insurance a critical risk mitigation tool.
Large Enterprises represent another dominant segment in terms of market penetration and premium volume. These organizations typically possess larger, more complex IT infrastructures, a greater volume of sensitive data, and a higher potential for significant financial and reputational damage from cyber-attacks. Their proactive approach to risk management often leads to higher uptake of comprehensive cyber insurance policies, with average annual premiums for large enterprises estimated to be over $500,000.
- Key Drivers for Large Enterprise Dominance:
- Sophisticated Threats: Large enterprises are often targeted by more sophisticated and persistent threats, requiring advanced security solutions and comprehensive insurance coverage.
- Global Operations: Multinational corporations face a broader range of cyber risks due to diverse regulatory environments and geographically dispersed operations.
- Brand Reputation: A significant data breach can severely damage the reputation and brand equity of a large enterprise, leading to substantial long-term business impact.
- Board-Level Oversight: Cyber risk is increasingly a board-level concern for large enterprises, driving investment in cyber security and insurance.
Manufacturing is also emerging as a significant segment, driven by the increasing digitalization of industrial control systems (ICS) and operational technology (OT), creating new vulnerabilities. Healthcare, while also a high-value target, is growing in importance due to the sensitive nature of patient data and the critical need for uninterrupted healthcare services. The growth in these sectors is projected to drive substantial market expansion.
Cyber Security in Insurance Industry Product Developments
Recent product developments in cyber security for the insurance industry are focused on delivering more integrated and proactive risk management solutions. Insurers are moving beyond traditional indemnity coverage to offer value-added services such as continuous monitoring, proactive threat detection, and enhanced incident response capabilities. These advancements aim to reduce the likelihood and impact of cyber incidents, thereby lowering claims and improving the insurability of cyber risk. Competitive advantages are being built through partnerships with cyber security technology providers and incident response firms, enabling insurers to offer a more holistic cyber resilience package. The integration of AI and machine learning into underwriting and claims processing is further refining risk assessment and claim settlement efficiency.
Report Scope & Segmentation Analysis
This report analyzes the cyber security in insurance industry across several key segments.
Organization Size: The market is segmented into Large Enterprises and Small and Medium Enterprises (SMEs). Large Enterprises are projected to hold a larger market share due to higher risk profiles and greater purchasing power, with an estimated market size of over $15 Billion in 2025. SMEs, while currently smaller in individual premium value, represent a rapidly growing segment with an estimated CAGR of 20% due to increasing cyber threats and targeted solutions.
End-user Industry: Key end-user industries analyzed include Retail, BFSI, Healthcare, and Manufacturing. The BFSI sector is currently the largest segment, estimated at over $10 Billion in 2025, driven by regulatory pressures and high data sensitivity. Healthcare is a rapidly growing segment, projected to reach over $7 Billion by 2033, due to the increasing value of patient data and the critical nature of healthcare operations. Manufacturing and Retail are also experiencing significant growth as they embrace digitalization.
Key Drivers of Cyber Security in Insurance Industry Growth
The cyber security in insurance industry is propelled by several key drivers. The escalating frequency and sophistication of cyber-attacks across all sectors necessitate robust financial protection and risk management strategies, driving demand for cyber insurance. The increasing volume and value of data being generated and stored globally makes it a prime target, amplifying the need for insurance coverage. Evolving regulatory landscapes and data privacy laws worldwide are compelling organizations to enhance their cyber security defenses and obtain adequate insurance. Technological advancements, while sometimes creating vulnerabilities, also enable insurers to develop more sophisticated underwriting and risk assessment tools, further fueling market growth.
Challenges in the Cyber Security in Insurance Industry Sector
Despite robust growth, the cyber security in insurance industry faces significant challenges. The inherent difficulty in accurately assessing and pricing cyber risk, given its rapidly evolving nature and the lack of historical loss data, remains a primary concern. The increasing frequency and severity of "silent cyber" events, where traditional policies may inadvertently cover cyber-related losses, create underwriting complexities and potential for undiscovered liabilities, estimated to cost insurers over $2 Billion annually. The scarcity of skilled cyber security professionals to manage risks and respond to incidents impacts both insureds and insurers. Furthermore, the potential for systemic cyber events, where a single event could trigger widespread claims across multiple policies, poses a significant systemic risk to the insurance market.
Emerging Opportunities in Cyber Security in Insurance Industry
Emerging opportunities in the cyber security in insurance industry lie in the development of specialized insurance products for emerging technologies like AI, IoT, and quantum computing, which present unique cyber risks. The growing awareness among SMEs about cyber threats is creating a substantial untapped market for tailored, affordable cyber insurance solutions, with an estimated market potential exceeding $5 Billion. The demand for proactive cyber risk management services, integrated with insurance, presents an opportunity for insurers to offer bundled solutions that enhance client resilience. Furthermore, the development of parametric cyber insurance, triggered by pre-defined events (e.g., specific types of ransomware attacks), could streamline claims processing and provide faster payouts.
Leading Players in the Cyber Security in Insurance Industry Market
- Munich Re Group
- Insureon
- Lockton Companies Inc
- Allianz Global Corporate & Specialty (AGCS)
- Aon PLC
- Security Scorecard Inc
- American International Group Inc
- Zurich Insurance Co Ltd
- The Chubb Corporation
- Berkshire Hathaway Inc
- AXA XL
Key Developments in Cyber Security in Insurance Industry Industry
- September 2022: A coalition, a cyber insurer headquartered in San Francisco, expanded its offerings to small and medium businesses by integrating cybersecurity technologies, monitoring, digital forensics, incident response, and comprehensive insurance coverage within the USA. The company subsequently increased its client base and successfully entered the UK market.
- August 2022: SolCyber, a Managed Security Service Provider, announced a strategic partnership with Converge Insurance, LLC. This collaboration aims to enhance coverage options and streamline the application process for small and mid-sized businesses, thereby improving their security posture and reducing overall business risk.
Strategic Outlook for Cyber Security in Insurance Industry Market
The strategic outlook for the cyber security in insurance industry remains exceptionally strong, driven by the persistent and evolving nature of cyber threats. The market is expected to witness continued innovation in product development, with a growing emphasis on proactive risk management and integrated cyber resilience solutions. The increasing regulatory pressure and growing awareness of cyber risks will drive higher adoption rates across all business segments, particularly among SMEs. Strategic investments in technology, such as AI and advanced analytics, will be crucial for insurers to effectively underwrite, price, and manage cyber risk. Partnerships and collaborations within the cyber security ecosystem will further shape the competitive landscape, leading to more comprehensive and effective solutions for businesses. The market is poised for sustained growth, with opportunities to address emerging risks and serve a broadening client base.
Cyber Security in Insurance Industry Segmentation
-
1. Organization Size
- 1.1. Large Enterprises
- 1.2. Small and Medium Enterprises
-
2. End-user Industry
- 2.1. Retail
- 2.2. BFSI
- 2.3. Healthcare
- 2.4. Manufacturing
Cyber Security in Insurance Industry Segmentation By Geography
-
1. North America
- 1.1. United States
- 1.2. Canada
-
2. Europe
- 2.1. Germany
- 2.2. United Kingdom
- 2.3. France
-
3. Asia
- 3.1. India
- 3.2. China
- 3.3. Japan
- 3.4. Singapore
- 3.5. Australia and New Zealand
-
4. Latin America
- 4.1. Brazil
- 4.2. Argentina
- 4.3. Rest of South America
-
5. Middle East and Africa
- 5.1. UAE
- 5.2. South Africa
- 5.3. Saudi Arabia
- 5.4. Rest Of MEA
Cyber Security in Insurance Industry REPORT HIGHLIGHTS
| Aspects | Details |
|---|---|
| Study Period | 2019-2033 |
| Base Year | 2024 |
| Estimated Year | 2025 |
| Forecast Period | 2025-2033 |
| Historical Period | 2019-2024 |
| Growth Rate | CAGR of 19.72% from 2019-2033 |
| Segmentation |
|
Table of Contents
- 1. Introduction
- 1.1. Research Scope
- 1.2. Market Segmentation
- 1.3. Research Methodology
- 1.4. Definitions and Assumptions
- 2. Executive Summary
- 2.1. Introduction
- 3. Market Dynamics
- 3.1. Introduction
- 3.2. Market Drivers
- 3.2.1. Increasing Adoption of Cloud-based Services; Rising Data Security Breaches
- 3.3. Market Restrains
- 3.3.1. Difficulties in Implementing Cyber Insurance and High Costs
- 3.4. Market Trends
- 3.4.1. The BFSI Segment is Estimated to Hold a Significant Share
- 4. Market Factor Analysis
- 4.1. Porters Five Forces
- 4.2. Supply/Value Chain
- 4.3. PESTEL analysis
- 4.4. Market Entropy
- 4.5. Patent/Trademark Analysis
- 5. Global Cyber Security in Insurance Industry Analysis, Insights and Forecast, 2019-2031
- 5.1. Market Analysis, Insights and Forecast - by Organization Size
- 5.1.1. Large Enterprises
- 5.1.2. Small and Medium Enterprises
- 5.2. Market Analysis, Insights and Forecast - by End-user Industry
- 5.2.1. Retail
- 5.2.2. BFSI
- 5.2.3. Healthcare
- 5.2.4. Manufacturing
- 5.3. Market Analysis, Insights and Forecast - by Region
- 5.3.1. North America
- 5.3.2. Europe
- 5.3.3. Asia
- 5.3.4. Latin America
- 5.3.5. Middle East and Africa
- 5.1. Market Analysis, Insights and Forecast - by Organization Size
- 6. North America Cyber Security in Insurance Industry Analysis, Insights and Forecast, 2019-2031
- 6.1. Market Analysis, Insights and Forecast - by Organization Size
- 6.1.1. Large Enterprises
- 6.1.2. Small and Medium Enterprises
- 6.2. Market Analysis, Insights and Forecast - by End-user Industry
- 6.2.1. Retail
- 6.2.2. BFSI
- 6.2.3. Healthcare
- 6.2.4. Manufacturing
- 6.1. Market Analysis, Insights and Forecast - by Organization Size
- 7. Europe Cyber Security in Insurance Industry Analysis, Insights and Forecast, 2019-2031
- 7.1. Market Analysis, Insights and Forecast - by Organization Size
- 7.1.1. Large Enterprises
- 7.1.2. Small and Medium Enterprises
- 7.2. Market Analysis, Insights and Forecast - by End-user Industry
- 7.2.1. Retail
- 7.2.2. BFSI
- 7.2.3. Healthcare
- 7.2.4. Manufacturing
- 7.1. Market Analysis, Insights and Forecast - by Organization Size
- 8. Asia Cyber Security in Insurance Industry Analysis, Insights and Forecast, 2019-2031
- 8.1. Market Analysis, Insights and Forecast - by Organization Size
- 8.1.1. Large Enterprises
- 8.1.2. Small and Medium Enterprises
- 8.2. Market Analysis, Insights and Forecast - by End-user Industry
- 8.2.1. Retail
- 8.2.2. BFSI
- 8.2.3. Healthcare
- 8.2.4. Manufacturing
- 8.1. Market Analysis, Insights and Forecast - by Organization Size
- 9. Latin America Cyber Security in Insurance Industry Analysis, Insights and Forecast, 2019-2031
- 9.1. Market Analysis, Insights and Forecast - by Organization Size
- 9.1.1. Large Enterprises
- 9.1.2. Small and Medium Enterprises
- 9.2. Market Analysis, Insights and Forecast - by End-user Industry
- 9.2.1. Retail
- 9.2.2. BFSI
- 9.2.3. Healthcare
- 9.2.4. Manufacturing
- 9.1. Market Analysis, Insights and Forecast - by Organization Size
- 10. Middle East and Africa Cyber Security in Insurance Industry Analysis, Insights and Forecast, 2019-2031
- 10.1. Market Analysis, Insights and Forecast - by Organization Size
- 10.1.1. Large Enterprises
- 10.1.2. Small and Medium Enterprises
- 10.2. Market Analysis, Insights and Forecast - by End-user Industry
- 10.2.1. Retail
- 10.2.2. BFSI
- 10.2.3. Healthcare
- 10.2.4. Manufacturing
- 10.1. Market Analysis, Insights and Forecast - by Organization Size
- 11. North America Cyber Security in Insurance Industry Analysis, Insights and Forecast, 2019-2031
- 11.1. Market Analysis, Insights and Forecast - By Country/Sub-region
- 11.1.1 United States
- 11.1.2 Canada
- 11.1.3 Mexico
- 12. Europe Cyber Security in Insurance Industry Analysis, Insights and Forecast, 2019-2031
- 12.1. Market Analysis, Insights and Forecast - By Country/Sub-region
- 12.1.1 Germany
- 12.1.2 United Kingdom
- 12.1.3 France
- 12.1.4 Spain
- 12.1.5 Italy
- 12.1.6 Spain
- 12.1.7 Belgium
- 12.1.8 Netherland
- 12.1.9 Nordics
- 12.1.10 Rest of Europe
- 13. Asia Pacific Cyber Security in Insurance Industry Analysis, Insights and Forecast, 2019-2031
- 13.1. Market Analysis, Insights and Forecast - By Country/Sub-region
- 13.1.1 China
- 13.1.2 Japan
- 13.1.3 India
- 13.1.4 South Korea
- 13.1.5 Southeast Asia
- 13.1.6 Australia
- 13.1.7 Indonesia
- 13.1.8 Phillipes
- 13.1.9 Singapore
- 13.1.10 Thailandc
- 13.1.11 Rest of Asia Pacific
- 14. South America Cyber Security in Insurance Industry Analysis, Insights and Forecast, 2019-2031
- 14.1. Market Analysis, Insights and Forecast - By Country/Sub-region
- 14.1.1 Brazil
- 14.1.2 Argentina
- 14.1.3 Peru
- 14.1.4 Chile
- 14.1.5 Colombia
- 14.1.6 Ecuador
- 14.1.7 Venezuela
- 14.1.8 Rest of South America
- 15. North America Cyber Security in Insurance Industry Analysis, Insights and Forecast, 2019-2031
- 15.1. Market Analysis, Insights and Forecast - By Country/Sub-region
- 15.1.1 United States
- 15.1.2 Canada
- 15.1.3 Mexico
- 16. MEA Cyber Security in Insurance Industry Analysis, Insights and Forecast, 2019-2031
- 16.1. Market Analysis, Insights and Forecast - By Country/Sub-region
- 16.1.1 United Arab Emirates
- 16.1.2 Saudi Arabia
- 16.1.3 South Africa
- 16.1.4 Rest of Middle East and Africa
- 17. Competitive Analysis
- 17.1. Global Market Share Analysis 2024
- 17.2. Company Profiles
- 17.2.1 Munich Re Group
- 17.2.1.1. Overview
- 17.2.1.2. Products
- 17.2.1.3. SWOT Analysis
- 17.2.1.4. Recent Developments
- 17.2.1.5. Financials (Based on Availability)
- 17.2.2 Insureon
- 17.2.2.1. Overview
- 17.2.2.2. Products
- 17.2.2.3. SWOT Analysis
- 17.2.2.4. Recent Developments
- 17.2.2.5. Financials (Based on Availability)
- 17.2.3 Lockton Companies Inc
- 17.2.3.1. Overview
- 17.2.3.2. Products
- 17.2.3.3. SWOT Analysis
- 17.2.3.4. Recent Developments
- 17.2.3.5. Financials (Based on Availability)
- 17.2.4 Allianz Global Corporate & Specialty (AGCS)
- 17.2.4.1. Overview
- 17.2.4.2. Products
- 17.2.4.3. SWOT Analysis
- 17.2.4.4. Recent Developments
- 17.2.4.5. Financials (Based on Availability)
- 17.2.5 Aon PLC
- 17.2.5.1. Overview
- 17.2.5.2. Products
- 17.2.5.3. SWOT Analysis
- 17.2.5.4. Recent Developments
- 17.2.5.5. Financials (Based on Availability)
- 17.2.6 Security Scorecard Inc
- 17.2.6.1. Overview
- 17.2.6.2. Products
- 17.2.6.3. SWOT Analysis
- 17.2.6.4. Recent Developments
- 17.2.6.5. Financials (Based on Availability)
- 17.2.7 American International Group Inc
- 17.2.7.1. Overview
- 17.2.7.2. Products
- 17.2.7.3. SWOT Analysis
- 17.2.7.4. Recent Developments
- 17.2.7.5. Financials (Based on Availability)
- 17.2.8 Zurich Insurance Co Ltd
- 17.2.8.1. Overview
- 17.2.8.2. Products
- 17.2.8.3. SWOT Analysis
- 17.2.8.4. Recent Developments
- 17.2.8.5. Financials (Based on Availability)
- 17.2.9 The Chubb Corporation
- 17.2.9.1. Overview
- 17.2.9.2. Products
- 17.2.9.3. SWOT Analysis
- 17.2.9.4. Recent Developments
- 17.2.9.5. Financials (Based on Availability)
- 17.2.10 Berkshire Hathaway Inc
- 17.2.10.1. Overview
- 17.2.10.2. Products
- 17.2.10.3. SWOT Analysis
- 17.2.10.4. Recent Developments
- 17.2.10.5. Financials (Based on Availability)
- 17.2.11 AXA XL
- 17.2.11.1. Overview
- 17.2.11.2. Products
- 17.2.11.3. SWOT Analysis
- 17.2.11.4. Recent Developments
- 17.2.11.5. Financials (Based on Availability)
- 17.2.1 Munich Re Group
List of Figures
- Figure 1: Global Cyber Security in Insurance Industry Revenue Breakdown (Million, %) by Region 2024 & 2032
- Figure 2: Global Cyber Security in Insurance Industry Volume Breakdown (K Unit, %) by Region 2024 & 2032
- Figure 3: North America Cyber Security in Insurance Industry Revenue (Million), by Country 2024 & 2032
- Figure 4: North America Cyber Security in Insurance Industry Volume (K Unit), by Country 2024 & 2032
- Figure 5: North America Cyber Security in Insurance Industry Revenue Share (%), by Country 2024 & 2032
- Figure 6: North America Cyber Security in Insurance Industry Volume Share (%), by Country 2024 & 2032
- Figure 7: Europe Cyber Security in Insurance Industry Revenue (Million), by Country 2024 & 2032
- Figure 8: Europe Cyber Security in Insurance Industry Volume (K Unit), by Country 2024 & 2032
- Figure 9: Europe Cyber Security in Insurance Industry Revenue Share (%), by Country 2024 & 2032
- Figure 10: Europe Cyber Security in Insurance Industry Volume Share (%), by Country 2024 & 2032
- Figure 11: Asia Pacific Cyber Security in Insurance Industry Revenue (Million), by Country 2024 & 2032
- Figure 12: Asia Pacific Cyber Security in Insurance Industry Volume (K Unit), by Country 2024 & 2032
- Figure 13: Asia Pacific Cyber Security in Insurance Industry Revenue Share (%), by Country 2024 & 2032
- Figure 14: Asia Pacific Cyber Security in Insurance Industry Volume Share (%), by Country 2024 & 2032
- Figure 15: South America Cyber Security in Insurance Industry Revenue (Million), by Country 2024 & 2032
- Figure 16: South America Cyber Security in Insurance Industry Volume (K Unit), by Country 2024 & 2032
- Figure 17: South America Cyber Security in Insurance Industry Revenue Share (%), by Country 2024 & 2032
- Figure 18: South America Cyber Security in Insurance Industry Volume Share (%), by Country 2024 & 2032
- Figure 19: North America Cyber Security in Insurance Industry Revenue (Million), by Country 2024 & 2032
- Figure 20: North America Cyber Security in Insurance Industry Volume (K Unit), by Country 2024 & 2032
- Figure 21: North America Cyber Security in Insurance Industry Revenue Share (%), by Country 2024 & 2032
- Figure 22: North America Cyber Security in Insurance Industry Volume Share (%), by Country 2024 & 2032
- Figure 23: MEA Cyber Security in Insurance Industry Revenue (Million), by Country 2024 & 2032
- Figure 24: MEA Cyber Security in Insurance Industry Volume (K Unit), by Country 2024 & 2032
- Figure 25: MEA Cyber Security in Insurance Industry Revenue Share (%), by Country 2024 & 2032
- Figure 26: MEA Cyber Security in Insurance Industry Volume Share (%), by Country 2024 & 2032
- Figure 27: North America Cyber Security in Insurance Industry Revenue (Million), by Organization Size 2024 & 2032
- Figure 28: North America Cyber Security in Insurance Industry Volume (K Unit), by Organization Size 2024 & 2032
- Figure 29: North America Cyber Security in Insurance Industry Revenue Share (%), by Organization Size 2024 & 2032
- Figure 30: North America Cyber Security in Insurance Industry Volume Share (%), by Organization Size 2024 & 2032
- Figure 31: North America Cyber Security in Insurance Industry Revenue (Million), by End-user Industry 2024 & 2032
- Figure 32: North America Cyber Security in Insurance Industry Volume (K Unit), by End-user Industry 2024 & 2032
- Figure 33: North America Cyber Security in Insurance Industry Revenue Share (%), by End-user Industry 2024 & 2032
- Figure 34: North America Cyber Security in Insurance Industry Volume Share (%), by End-user Industry 2024 & 2032
- Figure 35: North America Cyber Security in Insurance Industry Revenue (Million), by Country 2024 & 2032
- Figure 36: North America Cyber Security in Insurance Industry Volume (K Unit), by Country 2024 & 2032
- Figure 37: North America Cyber Security in Insurance Industry Revenue Share (%), by Country 2024 & 2032
- Figure 38: North America Cyber Security in Insurance Industry Volume Share (%), by Country 2024 & 2032
- Figure 39: Europe Cyber Security in Insurance Industry Revenue (Million), by Organization Size 2024 & 2032
- Figure 40: Europe Cyber Security in Insurance Industry Volume (K Unit), by Organization Size 2024 & 2032
- Figure 41: Europe Cyber Security in Insurance Industry Revenue Share (%), by Organization Size 2024 & 2032
- Figure 42: Europe Cyber Security in Insurance Industry Volume Share (%), by Organization Size 2024 & 2032
- Figure 43: Europe Cyber Security in Insurance Industry Revenue (Million), by End-user Industry 2024 & 2032
- Figure 44: Europe Cyber Security in Insurance Industry Volume (K Unit), by End-user Industry 2024 & 2032
- Figure 45: Europe Cyber Security in Insurance Industry Revenue Share (%), by End-user Industry 2024 & 2032
- Figure 46: Europe Cyber Security in Insurance Industry Volume Share (%), by End-user Industry 2024 & 2032
- Figure 47: Europe Cyber Security in Insurance Industry Revenue (Million), by Country 2024 & 2032
- Figure 48: Europe Cyber Security in Insurance Industry Volume (K Unit), by Country 2024 & 2032
- Figure 49: Europe Cyber Security in Insurance Industry Revenue Share (%), by Country 2024 & 2032
- Figure 50: Europe Cyber Security in Insurance Industry Volume Share (%), by Country 2024 & 2032
- Figure 51: Asia Cyber Security in Insurance Industry Revenue (Million), by Organization Size 2024 & 2032
- Figure 52: Asia Cyber Security in Insurance Industry Volume (K Unit), by Organization Size 2024 & 2032
- Figure 53: Asia Cyber Security in Insurance Industry Revenue Share (%), by Organization Size 2024 & 2032
- Figure 54: Asia Cyber Security in Insurance Industry Volume Share (%), by Organization Size 2024 & 2032
- Figure 55: Asia Cyber Security in Insurance Industry Revenue (Million), by End-user Industry 2024 & 2032
- Figure 56: Asia Cyber Security in Insurance Industry Volume (K Unit), by End-user Industry 2024 & 2032
- Figure 57: Asia Cyber Security in Insurance Industry Revenue Share (%), by End-user Industry 2024 & 2032
- Figure 58: Asia Cyber Security in Insurance Industry Volume Share (%), by End-user Industry 2024 & 2032
- Figure 59: Asia Cyber Security in Insurance Industry Revenue (Million), by Country 2024 & 2032
- Figure 60: Asia Cyber Security in Insurance Industry Volume (K Unit), by Country 2024 & 2032
- Figure 61: Asia Cyber Security in Insurance Industry Revenue Share (%), by Country 2024 & 2032
- Figure 62: Asia Cyber Security in Insurance Industry Volume Share (%), by Country 2024 & 2032
- Figure 63: Latin America Cyber Security in Insurance Industry Revenue (Million), by Organization Size 2024 & 2032
- Figure 64: Latin America Cyber Security in Insurance Industry Volume (K Unit), by Organization Size 2024 & 2032
- Figure 65: Latin America Cyber Security in Insurance Industry Revenue Share (%), by Organization Size 2024 & 2032
- Figure 66: Latin America Cyber Security in Insurance Industry Volume Share (%), by Organization Size 2024 & 2032
- Figure 67: Latin America Cyber Security in Insurance Industry Revenue (Million), by End-user Industry 2024 & 2032
- Figure 68: Latin America Cyber Security in Insurance Industry Volume (K Unit), by End-user Industry 2024 & 2032
- Figure 69: Latin America Cyber Security in Insurance Industry Revenue Share (%), by End-user Industry 2024 & 2032
- Figure 70: Latin America Cyber Security in Insurance Industry Volume Share (%), by End-user Industry 2024 & 2032
- Figure 71: Latin America Cyber Security in Insurance Industry Revenue (Million), by Country 2024 & 2032
- Figure 72: Latin America Cyber Security in Insurance Industry Volume (K Unit), by Country 2024 & 2032
- Figure 73: Latin America Cyber Security in Insurance Industry Revenue Share (%), by Country 2024 & 2032
- Figure 74: Latin America Cyber Security in Insurance Industry Volume Share (%), by Country 2024 & 2032
- Figure 75: Middle East and Africa Cyber Security in Insurance Industry Revenue (Million), by Organization Size 2024 & 2032
- Figure 76: Middle East and Africa Cyber Security in Insurance Industry Volume (K Unit), by Organization Size 2024 & 2032
- Figure 77: Middle East and Africa Cyber Security in Insurance Industry Revenue Share (%), by Organization Size 2024 & 2032
- Figure 78: Middle East and Africa Cyber Security in Insurance Industry Volume Share (%), by Organization Size 2024 & 2032
- Figure 79: Middle East and Africa Cyber Security in Insurance Industry Revenue (Million), by End-user Industry 2024 & 2032
- Figure 80: Middle East and Africa Cyber Security in Insurance Industry Volume (K Unit), by End-user Industry 2024 & 2032
- Figure 81: Middle East and Africa Cyber Security in Insurance Industry Revenue Share (%), by End-user Industry 2024 & 2032
- Figure 82: Middle East and Africa Cyber Security in Insurance Industry Volume Share (%), by End-user Industry 2024 & 2032
- Figure 83: Middle East and Africa Cyber Security in Insurance Industry Revenue (Million), by Country 2024 & 2032
- Figure 84: Middle East and Africa Cyber Security in Insurance Industry Volume (K Unit), by Country 2024 & 2032
- Figure 85: Middle East and Africa Cyber Security in Insurance Industry Revenue Share (%), by Country 2024 & 2032
- Figure 86: Middle East and Africa Cyber Security in Insurance Industry Volume Share (%), by Country 2024 & 2032
List of Tables
- Table 1: Global Cyber Security in Insurance Industry Revenue Million Forecast, by Region 2019 & 2032
- Table 2: Global Cyber Security in Insurance Industry Volume K Unit Forecast, by Region 2019 & 2032
- Table 3: Global Cyber Security in Insurance Industry Revenue Million Forecast, by Organization Size 2019 & 2032
- Table 4: Global Cyber Security in Insurance Industry Volume K Unit Forecast, by Organization Size 2019 & 2032
- Table 5: Global Cyber Security in Insurance Industry Revenue Million Forecast, by End-user Industry 2019 & 2032
- Table 6: Global Cyber Security in Insurance Industry Volume K Unit Forecast, by End-user Industry 2019 & 2032
- Table 7: Global Cyber Security in Insurance Industry Revenue Million Forecast, by Region 2019 & 2032
- Table 8: Global Cyber Security in Insurance Industry Volume K Unit Forecast, by Region 2019 & 2032
- Table 9: Global Cyber Security in Insurance Industry Revenue Million Forecast, by Country 2019 & 2032
- Table 10: Global Cyber Security in Insurance Industry Volume K Unit Forecast, by Country 2019 & 2032
- Table 11: United States Cyber Security in Insurance Industry Revenue (Million) Forecast, by Application 2019 & 2032
- Table 12: United States Cyber Security in Insurance Industry Volume (K Unit) Forecast, by Application 2019 & 2032
- Table 13: Canada Cyber Security in Insurance Industry Revenue (Million) Forecast, by Application 2019 & 2032
- Table 14: Canada Cyber Security in Insurance Industry Volume (K Unit) Forecast, by Application 2019 & 2032
- Table 15: Mexico Cyber Security in Insurance Industry Revenue (Million) Forecast, by Application 2019 & 2032
- Table 16: Mexico Cyber Security in Insurance Industry Volume (K Unit) Forecast, by Application 2019 & 2032
- Table 17: Global Cyber Security in Insurance Industry Revenue Million Forecast, by Country 2019 & 2032
- Table 18: Global Cyber Security in Insurance Industry Volume K Unit Forecast, by Country 2019 & 2032
- Table 19: Germany Cyber Security in Insurance Industry Revenue (Million) Forecast, by Application 2019 & 2032
- Table 20: Germany Cyber Security in Insurance Industry Volume (K Unit) Forecast, by Application 2019 & 2032
- Table 21: United Kingdom Cyber Security in Insurance Industry Revenue (Million) Forecast, by Application 2019 & 2032
- Table 22: United Kingdom Cyber Security in Insurance Industry Volume (K Unit) Forecast, by Application 2019 & 2032
- Table 23: France Cyber Security in Insurance Industry Revenue (Million) Forecast, by Application 2019 & 2032
- Table 24: France Cyber Security in Insurance Industry Volume (K Unit) Forecast, by Application 2019 & 2032
- Table 25: Spain Cyber Security in Insurance Industry Revenue (Million) Forecast, by Application 2019 & 2032
- Table 26: Spain Cyber Security in Insurance Industry Volume (K Unit) Forecast, by Application 2019 & 2032
- Table 27: Italy Cyber Security in Insurance Industry Revenue (Million) Forecast, by Application 2019 & 2032
- Table 28: Italy Cyber Security in Insurance Industry Volume (K Unit) Forecast, by Application 2019 & 2032
- Table 29: Spain Cyber Security in Insurance Industry Revenue (Million) Forecast, by Application 2019 & 2032
- Table 30: Spain Cyber Security in Insurance Industry Volume (K Unit) Forecast, by Application 2019 & 2032
- Table 31: Belgium Cyber Security in Insurance Industry Revenue (Million) Forecast, by Application 2019 & 2032
- Table 32: Belgium Cyber Security in Insurance Industry Volume (K Unit) Forecast, by Application 2019 & 2032
- Table 33: Netherland Cyber Security in Insurance Industry Revenue (Million) Forecast, by Application 2019 & 2032
- Table 34: Netherland Cyber Security in Insurance Industry Volume (K Unit) Forecast, by Application 2019 & 2032
- Table 35: Nordics Cyber Security in Insurance Industry Revenue (Million) Forecast, by Application 2019 & 2032
- Table 36: Nordics Cyber Security in Insurance Industry Volume (K Unit) Forecast, by Application 2019 & 2032
- Table 37: Rest of Europe Cyber Security in Insurance Industry Revenue (Million) Forecast, by Application 2019 & 2032
- Table 38: Rest of Europe Cyber Security in Insurance Industry Volume (K Unit) Forecast, by Application 2019 & 2032
- Table 39: Global Cyber Security in Insurance Industry Revenue Million Forecast, by Country 2019 & 2032
- Table 40: Global Cyber Security in Insurance Industry Volume K Unit Forecast, by Country 2019 & 2032
- Table 41: China Cyber Security in Insurance Industry Revenue (Million) Forecast, by Application 2019 & 2032
- Table 42: China Cyber Security in Insurance Industry Volume (K Unit) Forecast, by Application 2019 & 2032
- Table 43: Japan Cyber Security in Insurance Industry Revenue (Million) Forecast, by Application 2019 & 2032
- Table 44: Japan Cyber Security in Insurance Industry Volume (K Unit) Forecast, by Application 2019 & 2032
- Table 45: India Cyber Security in Insurance Industry Revenue (Million) Forecast, by Application 2019 & 2032
- Table 46: India Cyber Security in Insurance Industry Volume (K Unit) Forecast, by Application 2019 & 2032
- Table 47: South Korea Cyber Security in Insurance Industry Revenue (Million) Forecast, by Application 2019 & 2032
- Table 48: South Korea Cyber Security in Insurance Industry Volume (K Unit) Forecast, by Application 2019 & 2032
- Table 49: Southeast Asia Cyber Security in Insurance Industry Revenue (Million) Forecast, by Application 2019 & 2032
- Table 50: Southeast Asia Cyber Security in Insurance Industry Volume (K Unit) Forecast, by Application 2019 & 2032
- Table 51: Australia Cyber Security in Insurance Industry Revenue (Million) Forecast, by Application 2019 & 2032
- Table 52: Australia Cyber Security in Insurance Industry Volume (K Unit) Forecast, by Application 2019 & 2032
- Table 53: Indonesia Cyber Security in Insurance Industry Revenue (Million) Forecast, by Application 2019 & 2032
- Table 54: Indonesia Cyber Security in Insurance Industry Volume (K Unit) Forecast, by Application 2019 & 2032
- Table 55: Phillipes Cyber Security in Insurance Industry Revenue (Million) Forecast, by Application 2019 & 2032
- Table 56: Phillipes Cyber Security in Insurance Industry Volume (K Unit) Forecast, by Application 2019 & 2032
- Table 57: Singapore Cyber Security in Insurance Industry Revenue (Million) Forecast, by Application 2019 & 2032
- Table 58: Singapore Cyber Security in Insurance Industry Volume (K Unit) Forecast, by Application 2019 & 2032
- Table 59: Thailandc Cyber Security in Insurance Industry Revenue (Million) Forecast, by Application 2019 & 2032
- Table 60: Thailandc Cyber Security in Insurance Industry Volume (K Unit) Forecast, by Application 2019 & 2032
- Table 61: Rest of Asia Pacific Cyber Security in Insurance Industry Revenue (Million) Forecast, by Application 2019 & 2032
- Table 62: Rest of Asia Pacific Cyber Security in Insurance Industry Volume (K Unit) Forecast, by Application 2019 & 2032
- Table 63: Global Cyber Security in Insurance Industry Revenue Million Forecast, by Country 2019 & 2032
- Table 64: Global Cyber Security in Insurance Industry Volume K Unit Forecast, by Country 2019 & 2032
- Table 65: Brazil Cyber Security in Insurance Industry Revenue (Million) Forecast, by Application 2019 & 2032
- Table 66: Brazil Cyber Security in Insurance Industry Volume (K Unit) Forecast, by Application 2019 & 2032
- Table 67: Argentina Cyber Security in Insurance Industry Revenue (Million) Forecast, by Application 2019 & 2032
- Table 68: Argentina Cyber Security in Insurance Industry Volume (K Unit) Forecast, by Application 2019 & 2032
- Table 69: Peru Cyber Security in Insurance Industry Revenue (Million) Forecast, by Application 2019 & 2032
- Table 70: Peru Cyber Security in Insurance Industry Volume (K Unit) Forecast, by Application 2019 & 2032
- Table 71: Chile Cyber Security in Insurance Industry Revenue (Million) Forecast, by Application 2019 & 2032
- Table 72: Chile Cyber Security in Insurance Industry Volume (K Unit) Forecast, by Application 2019 & 2032
- Table 73: Colombia Cyber Security in Insurance Industry Revenue (Million) Forecast, by Application 2019 & 2032
- Table 74: Colombia Cyber Security in Insurance Industry Volume (K Unit) Forecast, by Application 2019 & 2032
- Table 75: Ecuador Cyber Security in Insurance Industry Revenue (Million) Forecast, by Application 2019 & 2032
- Table 76: Ecuador Cyber Security in Insurance Industry Volume (K Unit) Forecast, by Application 2019 & 2032
- Table 77: Venezuela Cyber Security in Insurance Industry Revenue (Million) Forecast, by Application 2019 & 2032
- Table 78: Venezuela Cyber Security in Insurance Industry Volume (K Unit) Forecast, by Application 2019 & 2032
- Table 79: Rest of South America Cyber Security in Insurance Industry Revenue (Million) Forecast, by Application 2019 & 2032
- Table 80: Rest of South America Cyber Security in Insurance Industry Volume (K Unit) Forecast, by Application 2019 & 2032
- Table 81: Global Cyber Security in Insurance Industry Revenue Million Forecast, by Country 2019 & 2032
- Table 82: Global Cyber Security in Insurance Industry Volume K Unit Forecast, by Country 2019 & 2032
- Table 83: United States Cyber Security in Insurance Industry Revenue (Million) Forecast, by Application 2019 & 2032
- Table 84: United States Cyber Security in Insurance Industry Volume (K Unit) Forecast, by Application 2019 & 2032
- Table 85: Canada Cyber Security in Insurance Industry Revenue (Million) Forecast, by Application 2019 & 2032
- Table 86: Canada Cyber Security in Insurance Industry Volume (K Unit) Forecast, by Application 2019 & 2032
- Table 87: Mexico Cyber Security in Insurance Industry Revenue (Million) Forecast, by Application 2019 & 2032
- Table 88: Mexico Cyber Security in Insurance Industry Volume (K Unit) Forecast, by Application 2019 & 2032
- Table 89: Global Cyber Security in Insurance Industry Revenue Million Forecast, by Country 2019 & 2032
- Table 90: Global Cyber Security in Insurance Industry Volume K Unit Forecast, by Country 2019 & 2032
- Table 91: United Arab Emirates Cyber Security in Insurance Industry Revenue (Million) Forecast, by Application 2019 & 2032
- Table 92: United Arab Emirates Cyber Security in Insurance Industry Volume (K Unit) Forecast, by Application 2019 & 2032
- Table 93: Saudi Arabia Cyber Security in Insurance Industry Revenue (Million) Forecast, by Application 2019 & 2032
- Table 94: Saudi Arabia Cyber Security in Insurance Industry Volume (K Unit) Forecast, by Application 2019 & 2032
- Table 95: South Africa Cyber Security in Insurance Industry Revenue (Million) Forecast, by Application 2019 & 2032
- Table 96: South Africa Cyber Security in Insurance Industry Volume (K Unit) Forecast, by Application 2019 & 2032
- Table 97: Rest of Middle East and Africa Cyber Security in Insurance Industry Revenue (Million) Forecast, by Application 2019 & 2032
- Table 98: Rest of Middle East and Africa Cyber Security in Insurance Industry Volume (K Unit) Forecast, by Application 2019 & 2032
- Table 99: Global Cyber Security in Insurance Industry Revenue Million Forecast, by Organization Size 2019 & 2032
- Table 100: Global Cyber Security in Insurance Industry Volume K Unit Forecast, by Organization Size 2019 & 2032
- Table 101: Global Cyber Security in Insurance Industry Revenue Million Forecast, by End-user Industry 2019 & 2032
- Table 102: Global Cyber Security in Insurance Industry Volume K Unit Forecast, by End-user Industry 2019 & 2032
- Table 103: Global Cyber Security in Insurance Industry Revenue Million Forecast, by Country 2019 & 2032
- Table 104: Global Cyber Security in Insurance Industry Volume K Unit Forecast, by Country 2019 & 2032
- Table 105: United States Cyber Security in Insurance Industry Revenue (Million) Forecast, by Application 2019 & 2032
- Table 106: United States Cyber Security in Insurance Industry Volume (K Unit) Forecast, by Application 2019 & 2032
- Table 107: Canada Cyber Security in Insurance Industry Revenue (Million) Forecast, by Application 2019 & 2032
- Table 108: Canada Cyber Security in Insurance Industry Volume (K Unit) Forecast, by Application 2019 & 2032
- Table 109: Global Cyber Security in Insurance Industry Revenue Million Forecast, by Organization Size 2019 & 2032
- Table 110: Global Cyber Security in Insurance Industry Volume K Unit Forecast, by Organization Size 2019 & 2032
- Table 111: Global Cyber Security in Insurance Industry Revenue Million Forecast, by End-user Industry 2019 & 2032
- Table 112: Global Cyber Security in Insurance Industry Volume K Unit Forecast, by End-user Industry 2019 & 2032
- Table 113: Global Cyber Security in Insurance Industry Revenue Million Forecast, by Country 2019 & 2032
- Table 114: Global Cyber Security in Insurance Industry Volume K Unit Forecast, by Country 2019 & 2032
- Table 115: Germany Cyber Security in Insurance Industry Revenue (Million) Forecast, by Application 2019 & 2032
- Table 116: Germany Cyber Security in Insurance Industry Volume (K Unit) Forecast, by Application 2019 & 2032
- Table 117: United Kingdom Cyber Security in Insurance Industry Revenue (Million) Forecast, by Application 2019 & 2032
- Table 118: United Kingdom Cyber Security in Insurance Industry Volume (K Unit) Forecast, by Application 2019 & 2032
- Table 119: France Cyber Security in Insurance Industry Revenue (Million) Forecast, by Application 2019 & 2032
- Table 120: France Cyber Security in Insurance Industry Volume (K Unit) Forecast, by Application 2019 & 2032
- Table 121: Global Cyber Security in Insurance Industry Revenue Million Forecast, by Organization Size 2019 & 2032
- Table 122: Global Cyber Security in Insurance Industry Volume K Unit Forecast, by Organization Size 2019 & 2032
- Table 123: Global Cyber Security in Insurance Industry Revenue Million Forecast, by End-user Industry 2019 & 2032
- Table 124: Global Cyber Security in Insurance Industry Volume K Unit Forecast, by End-user Industry 2019 & 2032
- Table 125: Global Cyber Security in Insurance Industry Revenue Million Forecast, by Country 2019 & 2032
- Table 126: Global Cyber Security in Insurance Industry Volume K Unit Forecast, by Country 2019 & 2032
- Table 127: India Cyber Security in Insurance Industry Revenue (Million) Forecast, by Application 2019 & 2032
- Table 128: India Cyber Security in Insurance Industry Volume (K Unit) Forecast, by Application 2019 & 2032
- Table 129: China Cyber Security in Insurance Industry Revenue (Million) Forecast, by Application 2019 & 2032
- Table 130: China Cyber Security in Insurance Industry Volume (K Unit) Forecast, by Application 2019 & 2032
- Table 131: Japan Cyber Security in Insurance Industry Revenue (Million) Forecast, by Application 2019 & 2032
- Table 132: Japan Cyber Security in Insurance Industry Volume (K Unit) Forecast, by Application 2019 & 2032
- Table 133: Singapore Cyber Security in Insurance Industry Revenue (Million) Forecast, by Application 2019 & 2032
- Table 134: Singapore Cyber Security in Insurance Industry Volume (K Unit) Forecast, by Application 2019 & 2032
- Table 135: Australia and New Zealand Cyber Security in Insurance Industry Revenue (Million) Forecast, by Application 2019 & 2032
- Table 136: Australia and New Zealand Cyber Security in Insurance Industry Volume (K Unit) Forecast, by Application 2019 & 2032
- Table 137: Global Cyber Security in Insurance Industry Revenue Million Forecast, by Organization Size 2019 & 2032
- Table 138: Global Cyber Security in Insurance Industry Volume K Unit Forecast, by Organization Size 2019 & 2032
- Table 139: Global Cyber Security in Insurance Industry Revenue Million Forecast, by End-user Industry 2019 & 2032
- Table 140: Global Cyber Security in Insurance Industry Volume K Unit Forecast, by End-user Industry 2019 & 2032
- Table 141: Global Cyber Security in Insurance Industry Revenue Million Forecast, by Country 2019 & 2032
- Table 142: Global Cyber Security in Insurance Industry Volume K Unit Forecast, by Country 2019 & 2032
- Table 143: Brazil Cyber Security in Insurance Industry Revenue (Million) Forecast, by Application 2019 & 2032
- Table 144: Brazil Cyber Security in Insurance Industry Volume (K Unit) Forecast, by Application 2019 & 2032
- Table 145: Argentina Cyber Security in Insurance Industry Revenue (Million) Forecast, by Application 2019 & 2032
- Table 146: Argentina Cyber Security in Insurance Industry Volume (K Unit) Forecast, by Application 2019 & 2032
- Table 147: Rest of South America Cyber Security in Insurance Industry Revenue (Million) Forecast, by Application 2019 & 2032
- Table 148: Rest of South America Cyber Security in Insurance Industry Volume (K Unit) Forecast, by Application 2019 & 2032
- Table 149: Global Cyber Security in Insurance Industry Revenue Million Forecast, by Organization Size 2019 & 2032
- Table 150: Global Cyber Security in Insurance Industry Volume K Unit Forecast, by Organization Size 2019 & 2032
- Table 151: Global Cyber Security in Insurance Industry Revenue Million Forecast, by End-user Industry 2019 & 2032
- Table 152: Global Cyber Security in Insurance Industry Volume K Unit Forecast, by End-user Industry 2019 & 2032
- Table 153: Global Cyber Security in Insurance Industry Revenue Million Forecast, by Country 2019 & 2032
- Table 154: Global Cyber Security in Insurance Industry Volume K Unit Forecast, by Country 2019 & 2032
- Table 155: UAE Cyber Security in Insurance Industry Revenue (Million) Forecast, by Application 2019 & 2032
- Table 156: UAE Cyber Security in Insurance Industry Volume (K Unit) Forecast, by Application 2019 & 2032
- Table 157: South Africa Cyber Security in Insurance Industry Revenue (Million) Forecast, by Application 2019 & 2032
- Table 158: South Africa Cyber Security in Insurance Industry Volume (K Unit) Forecast, by Application 2019 & 2032
- Table 159: Saudi Arabia Cyber Security in Insurance Industry Revenue (Million) Forecast, by Application 2019 & 2032
- Table 160: Saudi Arabia Cyber Security in Insurance Industry Volume (K Unit) Forecast, by Application 2019 & 2032
- Table 161: Rest Of MEA Cyber Security in Insurance Industry Revenue (Million) Forecast, by Application 2019 & 2032
- Table 162: Rest Of MEA Cyber Security in Insurance Industry Volume (K Unit) Forecast, by Application 2019 & 2032
Frequently Asked Questions
1. What is the projected Compound Annual Growth Rate (CAGR) of the Cyber Security in Insurance Industry?
The projected CAGR is approximately 19.72%.
2. Which companies are prominent players in the Cyber Security in Insurance Industry?
Key companies in the market include Munich Re Group, Insureon, Lockton Companies Inc, Allianz Global Corporate & Specialty (AGCS), Aon PLC, Security Scorecard Inc, American International Group Inc, Zurich Insurance Co Ltd, The Chubb Corporation, Berkshire Hathaway Inc, AXA XL.
3. What are the main segments of the Cyber Security in Insurance Industry?
The market segments include Organization Size, End-user Industry.
4. Can you provide details about the market size?
The market size is estimated to be USD 16.09 Million as of 2022.
5. What are some drivers contributing to market growth?
Increasing Adoption of Cloud-based Services; Rising Data Security Breaches.
6. What are the notable trends driving market growth?
The BFSI Segment is Estimated to Hold a Significant Share.
7. Are there any restraints impacting market growth?
Difficulties in Implementing Cyber Insurance and High Costs.
8. Can you provide examples of recent developments in the market?
September 2022 - The coalition, a cyber insurer with its headquarters in San Francisco, has been offering small and medium businesses solutions to manage cyber risk by integrating cybersecurity technologies, monitoring, access to digital forensics, incident response, and extensive insurance coverage in the USA. The company has increased its clientele and entered the UK market.
9. What pricing options are available for accessing the report?
Pricing options include single-user, multi-user, and enterprise licenses priced at USD 4750, USD 5250, and USD 8750 respectively.
10. Is the market size provided in terms of value or volume?
The market size is provided in terms of value, measured in Million and volume, measured in K Unit.
11. Are there any specific market keywords associated with the report?
Yes, the market keyword associated with the report is "Cyber Security in Insurance Industry," which aids in identifying and referencing the specific market segment covered.
12. How do I determine which pricing option suits my needs best?
The pricing options vary based on user requirements and access needs. Individual users may opt for single-user licenses, while businesses requiring broader access may choose multi-user or enterprise licenses for cost-effective access to the report.
13. Are there any additional resources or data provided in the Cyber Security in Insurance Industry report?
While the report offers comprehensive insights, it's advisable to review the specific contents or supplementary materials provided to ascertain if additional resources or data are available.
14. How can I stay updated on further developments or reports in the Cyber Security in Insurance Industry?
To stay informed about further developments, trends, and reports in the Cyber Security in Insurance Industry, consider subscribing to industry newsletters, following relevant companies and organizations, or regularly checking reputable industry news sources and publications.
Methodology
Step 1 - Identification of Relevant Samples Size from Population Database


Step 2 - Approaches for Defining Global Market Size (Value, Volume* & Price*)

Note*: In applicable scenarios
Step 3 - Data Sources
Primary Research
- Web Analytics
- Survey Reports
- Research Institute
- Latest Research Reports
- Opinion Leaders
Secondary Research
- Annual Reports
- White Paper
- Latest Press Release
- Industry Association
- Paid Database
- Investor Presentations

Step 4 - Data Triangulation
Involves using different sources of information in order to increase the validity of a study
These sources are likely to be stakeholders in a program - participants, other researchers, program staff, other community members, and so on.
Then we put all data in single framework & apply various statistical tools to find out the dynamic on the market.
During the analysis stage, feedback from the stakeholder groups would be compared to determine areas of agreement as well as areas of divergence


