
Key Insights
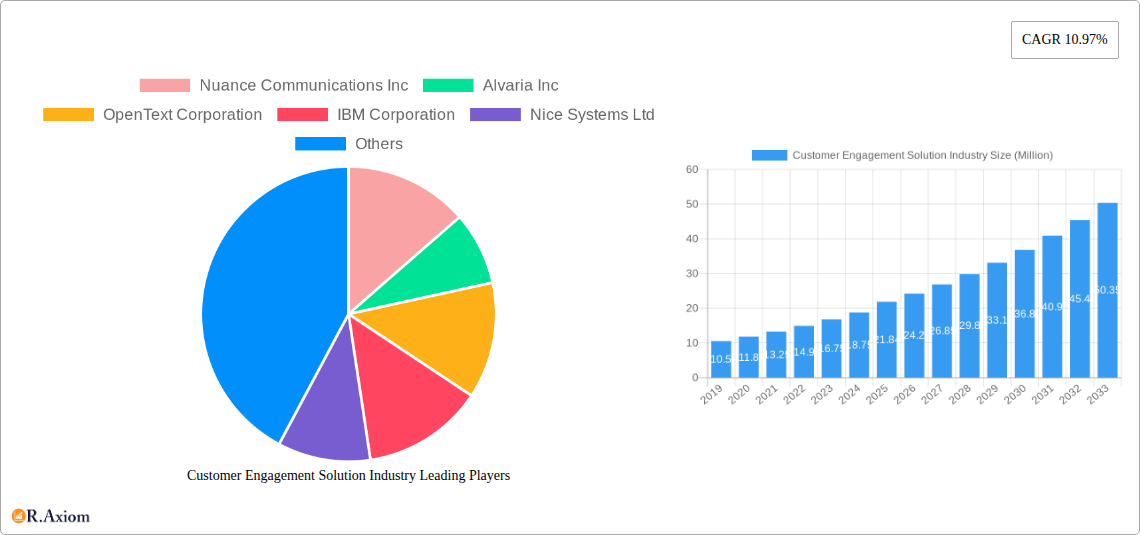
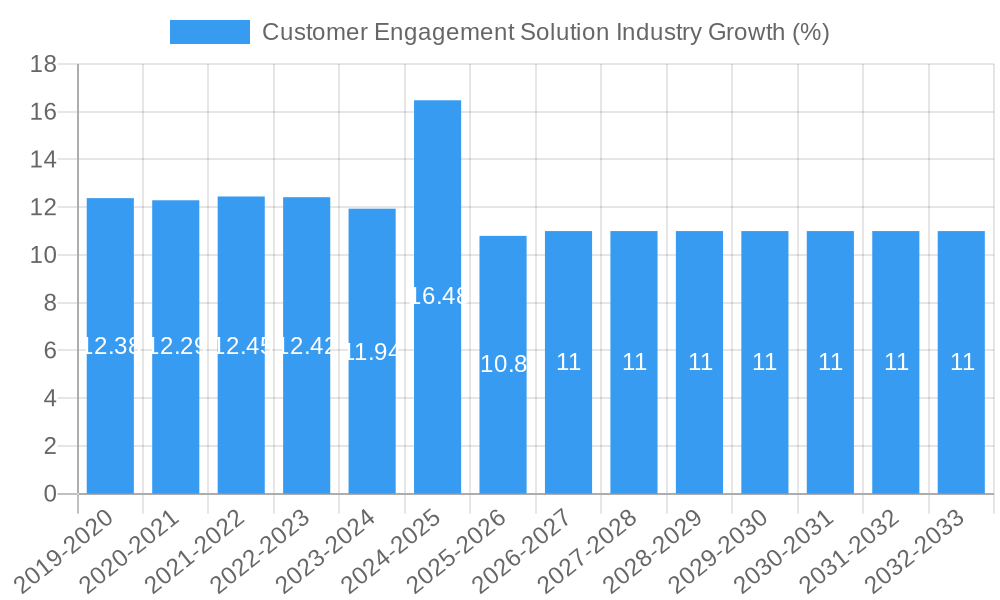
The Customer Engagement Solution Industry is poised for robust expansion, projected to reach a market size of $21.84 million with a compelling Compound Annual Growth Rate (CAGR) of 10.97% during the forecast period of 2025-2033. This significant growth is propelled by a confluence of dynamic drivers, most notably the increasing imperative for businesses to deliver seamless, personalized customer experiences across all touchpoints, often referred to as "omnichannel" engagement. The escalating demand for intelligent workforce optimization tools, enabling efficient management of customer service operations and agent productivity, also significantly contributes to this upward trajectory. Furthermore, the growing adoption of cloud-based solutions, offering scalability, flexibility, and cost-effectiveness, is a key enabler for businesses of all sizes to leverage advanced customer engagement capabilities.
The industry is witnessing a substantial shift towards integrated solutions that empower organizations to understand their customers deeply, anticipate their needs, and provide proactive support. This trend is particularly evident in sectors like BFSI, Telecom and IT, and Retail and Consumer Goods, where customer loyalty and retention are paramount. While on-premise solutions still hold a share, the migration to cloud deployments is accelerating, driven by the agility and accessibility it offers. Small and medium-sized enterprises (SMEs) are increasingly recognizing the value of these solutions to compete effectively with larger players. The market is characterized by intense competition among established players and emerging innovators, all vying to offer comprehensive suites encompassing communication platforms, analytics, AI-powered automation, and robust professional and managed services to cater to diverse enterprise needs.
Customer Engagement Solution Industry Market Concentration & Innovation
The global Customer Engagement Solution Industry is characterized by a dynamic and evolving market structure, with significant innovation driving growth. Key players like Nuance Communications Inc, Alvaria Inc, OpenText Corporation, IBM Corporation, Nice Systems Ltd, SAP SE, Salesforce com Inc, Avaya Inc, Pegasystems Inc, Verint Systems Inc, Genesys, Oracle Corporation, and Calabrio Inc are actively shaping the landscape. While the market exhibits moderate concentration, with these large enterprises holding substantial market share, the rise of specialized vendors and the continuous pursuit of advanced functionalities by established players foster a competitive environment ripe for innovation. Major innovation drivers include the increasing demand for personalized customer experiences, the integration of Artificial Intelligence (AI) and Machine Learning (ML) for predictive analytics and automation, and the growing adoption of cloud-based solutions for scalability and flexibility. Regulatory frameworks, particularly concerning data privacy (e.g., GDPR, CCPA), are also playing a crucial role in shaping product development and deployment strategies, encouraging transparency and robust security measures. Product substitutes are emerging in the form of standalone communication tools and in-house developed solutions, but the comprehensive nature and integrated capabilities of dedicated customer engagement platforms continue to provide a competitive edge. End-user trends are heavily influenced by the desire for seamless, omnichannel interactions, driving the adoption of solutions that can unify customer journeys across all touchpoints. Mergers and acquisitions (M&A) activity is a significant factor in market consolidation and strategic expansion. For instance, recent M&A deals in the broader CX technology space have seen valuations ranging from tens of millions to billions of dollars, indicating strong investor confidence and a drive for market leadership. These strategic moves aim to broaden product portfolios, acquire new technologies, and expand geographical reach, further intensifying the competitive landscape.
Customer Engagement Solution Industry Industry Trends & Insights
The Customer Engagement Solution Industry is poised for significant growth, projected to expand at a Compound Annual Growth Rate (CAGR) of approximately xx% from 2025 to 2033. This robust expansion is fueled by several key market growth drivers. Foremost among these is the escalating imperative for businesses across all sectors to deliver superior customer experiences (CX) as a primary differentiator in increasingly competitive markets. The shift in consumer expectations, demanding personalized, seamless, and proactive interactions, is compelling organizations to invest heavily in advanced customer engagement solutions. Technological disruptions are profoundly influencing the industry. The pervasive integration of Artificial Intelligence (AI) and Machine Learning (ML) is revolutionizing customer service through intelligent chatbots, predictive analytics for customer churn prevention, sentiment analysis for real-time feedback, and personalized recommendation engines. The adoption of omnichannel strategies is no longer a niche trend but a mainstream expectation, requiring platforms that can unify customer interactions across digital and traditional channels, including social media, web chat, email, voice, and mobile apps. The rise of the digital-first economy further accelerates this trend, as consumers increasingly prefer self-service options and digital communication channels. Moreover, the growing emphasis on data-driven decision-making empowers businesses to leverage customer insights for targeted marketing campaigns, improved product development, and enhanced service delivery, leading to increased customer loyalty and lifetime value. The competitive dynamics within the Customer Engagement Solution Industry are intense, with a mix of large, established players and agile, innovative startups vying for market share. Strategic partnerships, mergers, and acquisitions are common as companies seek to expand their offerings, acquire new technologies, and gain a competitive advantage. The market penetration of cloud-based solutions continues to rise, offering scalability, cost-effectiveness, and easier integration for businesses of all sizes. The increasing demand for personalized customer journeys, coupled with the continuous evolution of digital technologies, is creating a fertile ground for sustained growth and innovation within the Customer Engagement Solution Industry. The market is also witnessing a growing focus on employee experience (EX) as a critical component of EX, with solutions that empower customer service agents with the tools and information they need to deliver exceptional service.
Dominant Markets & Segments in Customer Engagement Solution Industry
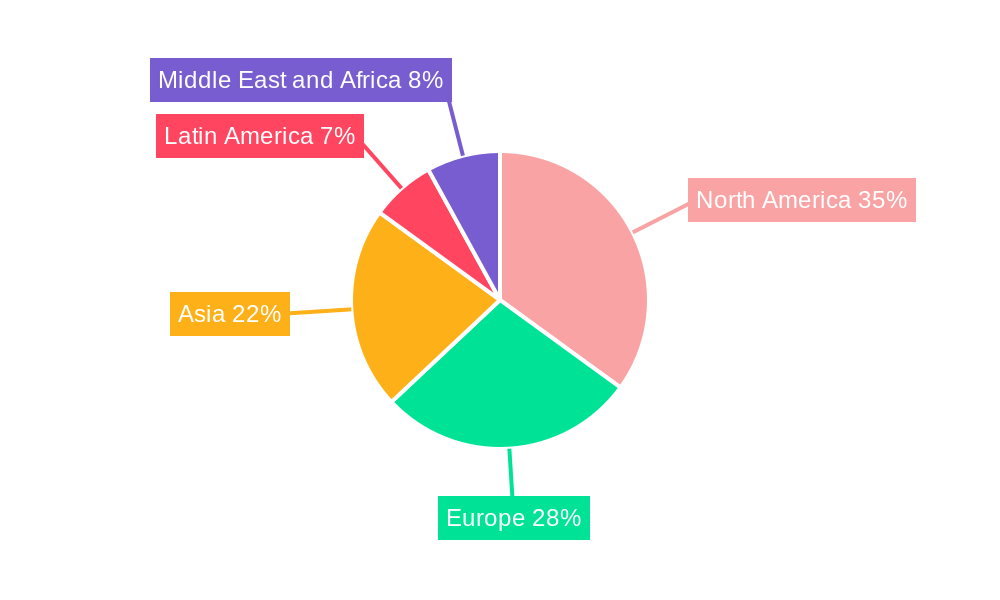
The Customer Engagement Solution Industry is experiencing dominance across various regions and segments, driven by specific economic policies, robust infrastructure, and evolving end-user demands.
Component Dominance:
Omni Channel: The Omni Channel component is a leading segment, with its market share projected to reach approximately xx million USD by 2033. This dominance is attributed to the increasing consumer demand for unified and seamless experiences across all touchpoints. Businesses are investing in omnichannel solutions to provide a consistent brand voice and personalized interactions, irrespective of the channel used. Key drivers include:
- Consumer Preference for Unified Journeys: Customers expect to interact with brands consistently across web, mobile, social media, and in-person.
- Data Integration and Insights: Omnichannel platforms enable comprehensive data collection, leading to a 360-degree view of the customer.
- Increased Customer Satisfaction and Loyalty: Seamless interactions contribute significantly to positive customer experiences and repeat business.
Workforce Optimization (WFO): This segment, valued at around xx million USD in 2025, is also a significant contributor to market growth. WFO solutions are crucial for managing and enhancing the productivity of customer service agents. The demand for efficient resource allocation, performance management, and agent training is driving its expansion. Key drivers include:
- Cost Reduction and Efficiency Gains: Optimizing workforce scheduling and performance directly impacts operational costs.
- Improved Agent Performance and Engagement: Tools for quality monitoring, coaching, and gamification enhance agent skills and motivation.
- Compliance and Regulatory Adherence: WFO solutions assist in meeting industry-specific compliance requirements.
Deployment Type Dominance:
- Cloud: The Cloud deployment type is overwhelmingly dominant, accounting for an estimated xx% of the market share in 2025 and projected to grow to over xx% by 2033. The flexibility, scalability, cost-effectiveness, and ease of implementation offered by cloud-based solutions make them the preferred choice for businesses of all sizes. Key drivers include:
- Scalability and Flexibility: Cloud solutions allow businesses to easily scale resources up or down based on demand.
- Reduced IT Infrastructure Costs: Eliminates the need for significant upfront investment in hardware and maintenance.
- Faster Deployment and Innovation: Cloud providers continuously update and offer new features, enabling quicker adoption of advanced technologies.
Organization Size Dominance:
- Large Enterprises: Large enterprises represent a significant portion of the customer engagement solution market, with their spending estimated at xx million USD in 2025. These organizations often have complex customer service operations and a greater need for sophisticated, integrated solutions to manage high volumes of interactions. Key drivers include:
- Complex Customer Service Needs: Large customer bases necessitate robust and scalable solutions.
- Budgetary Capacity for Advanced Solutions: Enterprises have the financial resources to invest in comprehensive CX platforms.
- Strategic Importance of Customer Experience: For large brands, CX is a critical competitive differentiator.
End-User Industry Dominance:
BFSI (Banking, Financial Services, and Insurance): This sector is a leading adopter of customer engagement solutions, with an estimated market spend of xx million USD in 2025. The high volume of customer interactions, stringent regulatory requirements, and the critical need for trust and security drive the adoption of advanced engagement tools. Key drivers include:
- High Volume of Sensitive Transactions: Secure and efficient communication is paramount.
- Regulatory Compliance: Strict adherence to financial regulations necessitates robust audit trails and security features.
- Demand for Personalized Financial Advice and Support: Customers expect tailored guidance and proactive assistance.
Telecom and IT: This sector also represents a substantial market, driven by the constant need to manage customer inquiries, support issues, and new service activations. The highly competitive nature of the industry necessitates superior customer service to retain subscribers. Key drivers include:
- High Customer Churn Rates: Excellent customer service is vital for subscriber retention.
- Complex Technical Support Needs: Handling queries related to services and devices requires sophisticated support tools.
- New Service Launches and Promotions: Effective engagement is crucial for communicating and driving adoption of new offerings.
Services Dominance:
- Managed Services: Managed services are gaining traction, with projected revenues of xx million USD by 2033. Businesses are increasingly opting for managed services to offload the complexities of managing and optimizing their customer engagement solutions, allowing them to focus on core business activities. Key drivers include:
- Reduced Operational Burden: Outsourcing management frees up internal IT resources.
- Access to Expertise: Managed service providers offer specialized knowledge and best practices.
- Cost Predictability: Fixed service fees provide better budget control.
Customer Engagement Solution Industry Product Developments
Omni Channel: The Omni Channel component is a leading segment, with its market share projected to reach approximately xx million USD by 2033. This dominance is attributed to the increasing consumer demand for unified and seamless experiences across all touchpoints. Businesses are investing in omnichannel solutions to provide a consistent brand voice and personalized interactions, irrespective of the channel used. Key drivers include:
- Consumer Preference for Unified Journeys: Customers expect to interact with brands consistently across web, mobile, social media, and in-person.
- Data Integration and Insights: Omnichannel platforms enable comprehensive data collection, leading to a 360-degree view of the customer.
- Increased Customer Satisfaction and Loyalty: Seamless interactions contribute significantly to positive customer experiences and repeat business.
Workforce Optimization (WFO): This segment, valued at around xx million USD in 2025, is also a significant contributor to market growth. WFO solutions are crucial for managing and enhancing the productivity of customer service agents. The demand for efficient resource allocation, performance management, and agent training is driving its expansion. Key drivers include:
- Cost Reduction and Efficiency Gains: Optimizing workforce scheduling and performance directly impacts operational costs.
- Improved Agent Performance and Engagement: Tools for quality monitoring, coaching, and gamification enhance agent skills and motivation.
- Compliance and Regulatory Adherence: WFO solutions assist in meeting industry-specific compliance requirements.
- Cloud: The Cloud deployment type is overwhelmingly dominant, accounting for an estimated xx% of the market share in 2025 and projected to grow to over xx% by 2033. The flexibility, scalability, cost-effectiveness, and ease of implementation offered by cloud-based solutions make them the preferred choice for businesses of all sizes. Key drivers include:
- Scalability and Flexibility: Cloud solutions allow businesses to easily scale resources up or down based on demand.
- Reduced IT Infrastructure Costs: Eliminates the need for significant upfront investment in hardware and maintenance.
- Faster Deployment and Innovation: Cloud providers continuously update and offer new features, enabling quicker adoption of advanced technologies.
Organization Size Dominance:
- Large Enterprises: Large enterprises represent a significant portion of the customer engagement solution market, with their spending estimated at xx million USD in 2025. These organizations often have complex customer service operations and a greater need for sophisticated, integrated solutions to manage high volumes of interactions. Key drivers include:
- Complex Customer Service Needs: Large customer bases necessitate robust and scalable solutions.
- Budgetary Capacity for Advanced Solutions: Enterprises have the financial resources to invest in comprehensive CX platforms.
- Strategic Importance of Customer Experience: For large brands, CX is a critical competitive differentiator.
End-User Industry Dominance:
BFSI (Banking, Financial Services, and Insurance): This sector is a leading adopter of customer engagement solutions, with an estimated market spend of xx million USD in 2025. The high volume of customer interactions, stringent regulatory requirements, and the critical need for trust and security drive the adoption of advanced engagement tools. Key drivers include:
- High Volume of Sensitive Transactions: Secure and efficient communication is paramount.
- Regulatory Compliance: Strict adherence to financial regulations necessitates robust audit trails and security features.
- Demand for Personalized Financial Advice and Support: Customers expect tailored guidance and proactive assistance.
Telecom and IT: This sector also represents a substantial market, driven by the constant need to manage customer inquiries, support issues, and new service activations. The highly competitive nature of the industry necessitates superior customer service to retain subscribers. Key drivers include:
- High Customer Churn Rates: Excellent customer service is vital for subscriber retention.
- Complex Technical Support Needs: Handling queries related to services and devices requires sophisticated support tools.
- New Service Launches and Promotions: Effective engagement is crucial for communicating and driving adoption of new offerings.
Services Dominance:
- Managed Services: Managed services are gaining traction, with projected revenues of xx million USD by 2033. Businesses are increasingly opting for managed services to offload the complexities of managing and optimizing their customer engagement solutions, allowing them to focus on core business activities. Key drivers include:
- Reduced Operational Burden: Outsourcing management frees up internal IT resources.
- Access to Expertise: Managed service providers offer specialized knowledge and best practices.
- Cost Predictability: Fixed service fees provide better budget control.
Customer Engagement Solution Industry Product Developments
- Complex Customer Service Needs: Large customer bases necessitate robust and scalable solutions.
- Budgetary Capacity for Advanced Solutions: Enterprises have the financial resources to invest in comprehensive CX platforms.
- Strategic Importance of Customer Experience: For large brands, CX is a critical competitive differentiator.
BFSI (Banking, Financial Services, and Insurance): This sector is a leading adopter of customer engagement solutions, with an estimated market spend of xx million USD in 2025. The high volume of customer interactions, stringent regulatory requirements, and the critical need for trust and security drive the adoption of advanced engagement tools. Key drivers include:
- High Volume of Sensitive Transactions: Secure and efficient communication is paramount.
- Regulatory Compliance: Strict adherence to financial regulations necessitates robust audit trails and security features.
- Demand for Personalized Financial Advice and Support: Customers expect tailored guidance and proactive assistance.
Telecom and IT: This sector also represents a substantial market, driven by the constant need to manage customer inquiries, support issues, and new service activations. The highly competitive nature of the industry necessitates superior customer service to retain subscribers. Key drivers include:
- High Customer Churn Rates: Excellent customer service is vital for subscriber retention.
- Complex Technical Support Needs: Handling queries related to services and devices requires sophisticated support tools.
- New Service Launches and Promotions: Effective engagement is crucial for communicating and driving adoption of new offerings.
Services Dominance:
- Managed Services: Managed services are gaining traction, with projected revenues of xx million USD by 2033. Businesses are increasingly opting for managed services to offload the complexities of managing and optimizing their customer engagement solutions, allowing them to focus on core business activities. Key drivers include:
- Reduced Operational Burden: Outsourcing management frees up internal IT resources.
- Access to Expertise: Managed service providers offer specialized knowledge and best practices.
- Cost Predictability: Fixed service fees provide better budget control.
Customer Engagement Solution Industry Product Developments
- Reduced Operational Burden: Outsourcing management frees up internal IT resources.
- Access to Expertise: Managed service providers offer specialized knowledge and best practices.
- Cost Predictability: Fixed service fees provide better budget control.
Product development in the Customer Engagement Solution Industry is characterized by a relentless focus on leveraging emerging technologies to enhance customer interactions. Innovations are centered around AI-driven capabilities for hyper-personalization, predictive analytics to anticipate customer needs, and intelligent automation to streamline workflows. Solutions are increasingly designed to offer a truly omnichannel experience, seamlessly integrating communication channels and providing a unified customer view across all touchpoints. The development of intuitive user interfaces for both customers and agents, along with robust analytics dashboards, empowers businesses to gain deeper insights into customer behavior and service performance. Competitive advantages are being forged through advanced features like sentiment analysis, proactive outreach capabilities, and self-service portals that empower customers and reduce agent workload.
Report Scope & Segmentation Analysis
This report comprehensively analyzes the Customer Engagement Solution Industry across key segments, providing in-depth insights into market dynamics.
- Component Segmentation: The market is analyzed based on Component, including Omni Channel, Workforce Optimization, and Other. Omni Channel solutions are projected to dominate, driven by the need for unified customer journeys. Workforce Optimization remains critical for agent efficiency.
- Deployment Type Segmentation: Analysis covers On-premise and Cloud deployment types. The Cloud segment is anticipated to continue its rapid growth due to its scalability and cost-effectiveness.
- Organization Size Segmentation: The report examines market penetration and growth for Small and Medium Enterprises (SMEs) and Large Enterprises. Large enterprises currently represent a larger share, but SMEs are showing significant adoption potential.
- End-user Industry Segmentation: Key end-user industries such as BFSI, Telecom and IT, Retail and Consumer Goods, Media and Entertainment, and Other End-user Industries are analyzed. BFSI and Telecom & IT are leading adopters due to specific industry needs.
- Services Segmentation: The report includes analysis of Managed services and Professional services. Managed services are expected to witness robust growth as businesses seek to outsource management complexities.
Key Drivers of Customer Engagement Solution Industry Growth
The Customer Engagement Solution Industry's growth is primarily propelled by several interconnected factors. The escalating demand for exceptional customer experiences (CX) is paramount, compelling businesses to invest in solutions that foster loyalty and satisfaction. Technological advancements, particularly the integration of Artificial Intelligence (AI) and Machine Learning (ML), are revolutionizing personalization, automation, and predictive analytics. The pervasive adoption of digital channels and the expectation of seamless omnichannel interactions by consumers further fuel this growth. Furthermore, increasing competition across industries compels organizations to leverage superior customer engagement as a key differentiator, leading to substantial investment in relevant technologies. Economic factors, such as increased disposable income and a focus on value-added services, also contribute positively.
Challenges in the Customer Engagement Solution Industry Sector
Despite its robust growth, the Customer Engagement Solution Industry faces several challenges. Implementing and integrating complex omnichannel solutions can be technically challenging and require significant IT expertise, leading to potential integration hurdles for some organizations. Data security and privacy concerns are paramount, given the sensitive nature of customer data handled by these platforms, necessitating stringent compliance with regulations like GDPR and CCPA. The high cost of advanced solutions can be a barrier for smaller businesses, limiting their access to cutting-edge capabilities. Moreover, the rapid pace of technological change requires continuous adaptation and investment, posing a challenge for companies to keep their solutions updated and competitive. The availability of skilled talent to manage and leverage these sophisticated platforms is another constraint.
Emerging Opportunities in Customer Engagement Solution Industry
The Customer Engagement Solution Industry is brimming with emerging opportunities. The expanding integration of Generative AI promises to further enhance personalized content creation, intelligent virtual assistants, and automated customer support at an unprecedented scale. The growing demand for proactive customer engagement, where businesses anticipate needs and offer solutions before issues arise, presents a significant opportunity. Furthermore, the increasing adoption of IoT devices will generate vast amounts of data, creating opportunities for solutions that can leverage this data for personalized customer interactions and predictive maintenance. The expansion into emerging markets, coupled with the increasing digital literacy and smartphone penetration in these regions, opens new avenues for growth. The convergence of customer experience (CX) and employee experience (EX) solutions also presents an opportunity to offer holistic platforms that enhance both internal operations and external customer interactions.
Leading Players in the Customer Engagement Solution Industry Market
- Nuance Communications Inc
- Alvaria Inc
- OpenText Corporation
- IBM Corporation
- Nice Systems Ltd
- SAP SE
- Salesforce com Inc
- Avaya Inc
- Pegasystems Inc
- Verint Systems Inc
- Genesys
- Oracle Corporation
- Calabrio Inc
Key Developments in Customer Engagement Solution Industry Industry
- February 2023: GoTo, a firm that makes business communication, IT administration, and support simple with its core products GoTo Resolve, GoTo Connect, and Rescue, announced the launch of GoTo Customer Engagement. In a single, shared inbox, this innovative multi-channel solution combines GoTo Connect's premium phone system, customer communication tools, analytics, and the digital channels customers need to reach a wider audience and expand their businesses.
- May 2022: HCL Technologies announced X by HCL Technologies (X), a digital engagement platform that helps brands increase consumer loyalty and conversions through tailored omnichannel marketing. HCL Technologies' X addresses these obstacles by bringing together numerous digital touchpoints, including websites, mobile apps, and social media feeds, to provide a unified customer perspective. This enables marketers to gain access to data-driven insights that will enable them to improve the consumer experience and maximize their brand's potential.
Strategic Outlook for Customer Engagement Solution Industry Market
The strategic outlook for the Customer Engagement Solution Industry remains exceptionally positive, driven by the persistent and intensifying demand for superior customer experiences. The continued evolution of AI and ML technologies will unlock new levels of personalization, automation, and predictive capabilities, enabling businesses to forge deeper, more meaningful connections with their customers. The ongoing shift towards cloud-native solutions will further democratize access to advanced engagement tools, empowering businesses of all sizes. Strategic partnerships and M&A activities are expected to continue, consolidating the market and fostering innovation by integrating specialized technologies and expanding global reach. The increasing focus on the entire customer lifecycle, from acquisition to retention and advocacy, will necessitate comprehensive and integrated engagement platforms. Businesses that can effectively leverage data analytics, deliver seamless omnichannel experiences, and provide proactive, personalized support will be best positioned for success in this dynamic and rapidly growing market.
Customer Engagement Solution Industry Segmentation
-
1. Component
- 1.1. Omni Channel
- 1.2. Workforce Optimization
- 1.3. Other
-
2. Deployment Type
- 2.1. On-premise
- 2.2. Cloud
-
3. Organization Size
- 3.1. Small and Medium Enterprises
- 3.2. Large Enterprises
-
4. End-user Industry
- 4.1. BFSI
- 4.2. Telecom and IT
- 4.3. Retail and Consumer Goods
- 4.4. Media and Entertainment
- 4.5. Other End-user Industries
-
5. Services
- 5.1. Managed services
- 5.2. Professional services
Customer Engagement Solution Industry Segmentation By Geography
-
1. North America
- 1.1. United States
- 1.2. Canada
-
2. Europe
- 2.1. United Kingdom
- 2.2. Germany
- 2.3. France
-
3. Asia
- 3.1. China
- 3.2. India
- 3.3. Japan
-
4. Latin America
- 4.1. Brazil
- 4.2. Argentina
- 4.3. Rest of South America
-
5. Middle East and Africa
- 5.1. UAE
- 5.2. South Africa
- 5.3. Saudi Arabia
- 5.4. Rest Of MEA
Customer Engagement Solution Industry REPORT HIGHLIGHTS
| Aspects | Details |
|---|---|
| Study Period | 2019-2033 |
| Base Year | 2024 |
| Estimated Year | 2025 |
| Forecast Period | 2025-2033 |
| Historical Period | 2019-2024 |
| Growth Rate | CAGR of 10.97% from 2019-2033 |
| Segmentation |
|
Table of Contents
- 1. Introduction
- 1.1. Research Scope
- 1.2. Market Segmentation
- 1.3. Research Methodology
- 1.4. Definitions and Assumptions
- 2. Executive Summary
- 2.1. Introduction
- 3. Market Dynamics
- 3.1. Introduction
- 3.2. Market Drivers
- 3.2.1. Rapidly Increasing Cybersecurity Incidents and Regulations Requiring Their Reporting; Growing M2M/IoT Connections Demanding Strengthened Cybersecurity in Enterprises
- 3.3. Market Restrains
- 3.3.1. Lack of Cybersecurity Professionals; High Reliance on Traditional Authentication Methods and Low Preparedness
- 3.4. Market Trends
- 3.4.1. BFSI Industry Have the Significant Market Share
- 4. Market Factor Analysis
- 4.1. Porters Five Forces
- 4.2. Supply/Value Chain
- 4.3. PESTEL analysis
- 4.4. Market Entropy
- 4.5. Patent/Trademark Analysis
- 5. Global Customer Engagement Solution Industry Analysis, Insights and Forecast, 2019-2031
- 5.1. Market Analysis, Insights and Forecast - by Component
- 5.1.1. Omni Channel
- 5.1.2. Workforce Optimization
- 5.1.3. Other
- 5.2. Market Analysis, Insights and Forecast - by Deployment Type
- 5.2.1. On-premise
- 5.2.2. Cloud
- 5.3. Market Analysis, Insights and Forecast - by Organization Size
- 5.3.1. Small and Medium Enterprises
- 5.3.2. Large Enterprises
- 5.4. Market Analysis, Insights and Forecast - by End-user Industry
- 5.4.1. BFSI
- 5.4.2. Telecom and IT
- 5.4.3. Retail and Consumer Goods
- 5.4.4. Media and Entertainment
- 5.4.5. Other End-user Industries
- 5.5. Market Analysis, Insights and Forecast - by Services
- 5.5.1. Managed services
- 5.5.2. Professional services
- 5.6. Market Analysis, Insights and Forecast - by Region
- 5.6.1. North America
- 5.6.2. Europe
- 5.6.3. Asia
- 5.6.4. Latin America
- 5.6.5. Middle East and Africa
- 5.1. Market Analysis, Insights and Forecast - by Component
- 6. North America Customer Engagement Solution Industry Analysis, Insights and Forecast, 2019-2031
- 6.1. Market Analysis, Insights and Forecast - by Component
- 6.1.1. Omni Channel
- 6.1.2. Workforce Optimization
- 6.1.3. Other
- 6.2. Market Analysis, Insights and Forecast - by Deployment Type
- 6.2.1. On-premise
- 6.2.2. Cloud
- 6.3. Market Analysis, Insights and Forecast - by Organization Size
- 6.3.1. Small and Medium Enterprises
- 6.3.2. Large Enterprises
- 6.4. Market Analysis, Insights and Forecast - by End-user Industry
- 6.4.1. BFSI
- 6.4.2. Telecom and IT
- 6.4.3. Retail and Consumer Goods
- 6.4.4. Media and Entertainment
- 6.4.5. Other End-user Industries
- 6.5. Market Analysis, Insights and Forecast - by Services
- 6.5.1. Managed services
- 6.5.2. Professional services
- 6.1. Market Analysis, Insights and Forecast - by Component
- 7. Europe Customer Engagement Solution Industry Analysis, Insights and Forecast, 2019-2031
- 7.1. Market Analysis, Insights and Forecast - by Component
- 7.1.1. Omni Channel
- 7.1.2. Workforce Optimization
- 7.1.3. Other
- 7.2. Market Analysis, Insights and Forecast - by Deployment Type
- 7.2.1. On-premise
- 7.2.2. Cloud
- 7.3. Market Analysis, Insights and Forecast - by Organization Size
- 7.3.1. Small and Medium Enterprises
- 7.3.2. Large Enterprises
- 7.4. Market Analysis, Insights and Forecast - by End-user Industry
- 7.4.1. BFSI
- 7.4.2. Telecom and IT
- 7.4.3. Retail and Consumer Goods
- 7.4.4. Media and Entertainment
- 7.4.5. Other End-user Industries
- 7.5. Market Analysis, Insights and Forecast - by Services
- 7.5.1. Managed services
- 7.5.2. Professional services
- 7.1. Market Analysis, Insights and Forecast - by Component
- 8. Asia Customer Engagement Solution Industry Analysis, Insights and Forecast, 2019-2031
- 8.1. Market Analysis, Insights and Forecast - by Component
- 8.1.1. Omni Channel
- 8.1.2. Workforce Optimization
- 8.1.3. Other
- 8.2. Market Analysis, Insights and Forecast - by Deployment Type
- 8.2.1. On-premise
- 8.2.2. Cloud
- 8.3. Market Analysis, Insights and Forecast - by Organization Size
- 8.3.1. Small and Medium Enterprises
- 8.3.2. Large Enterprises
- 8.4. Market Analysis, Insights and Forecast - by End-user Industry
- 8.4.1. BFSI
- 8.4.2. Telecom and IT
- 8.4.3. Retail and Consumer Goods
- 8.4.4. Media and Entertainment
- 8.4.5. Other End-user Industries
- 8.5. Market Analysis, Insights and Forecast - by Services
- 8.5.1. Managed services
- 8.5.2. Professional services
- 8.1. Market Analysis, Insights and Forecast - by Component
- 9. Latin America Customer Engagement Solution Industry Analysis, Insights and Forecast, 2019-2031
- 9.1. Market Analysis, Insights and Forecast - by Component
- 9.1.1. Omni Channel
- 9.1.2. Workforce Optimization
- 9.1.3. Other
- 9.2. Market Analysis, Insights and Forecast - by Deployment Type
- 9.2.1. On-premise
- 9.2.2. Cloud
- 9.3. Market Analysis, Insights and Forecast - by Organization Size
- 9.3.1. Small and Medium Enterprises
- 9.3.2. Large Enterprises
- 9.4. Market Analysis, Insights and Forecast - by End-user Industry
- 9.4.1. BFSI
- 9.4.2. Telecom and IT
- 9.4.3. Retail and Consumer Goods
- 9.4.4. Media and Entertainment
- 9.4.5. Other End-user Industries
- 9.5. Market Analysis, Insights and Forecast - by Services
- 9.5.1. Managed services
- 9.5.2. Professional services
- 9.1. Market Analysis, Insights and Forecast - by Component
- 10. Middle East and Africa Customer Engagement Solution Industry Analysis, Insights and Forecast, 2019-2031
- 10.1. Market Analysis, Insights and Forecast - by Component
- 10.1.1. Omni Channel
- 10.1.2. Workforce Optimization
- 10.1.3. Other
- 10.2. Market Analysis, Insights and Forecast - by Deployment Type
- 10.2.1. On-premise
- 10.2.2. Cloud
- 10.3. Market Analysis, Insights and Forecast - by Organization Size
- 10.3.1. Small and Medium Enterprises
- 10.3.2. Large Enterprises
- 10.4. Market Analysis, Insights and Forecast - by End-user Industry
- 10.4.1. BFSI
- 10.4.2. Telecom and IT
- 10.4.3. Retail and Consumer Goods
- 10.4.4. Media and Entertainment
- 10.4.5. Other End-user Industries
- 10.5. Market Analysis, Insights and Forecast - by Services
- 10.5.1. Managed services
- 10.5.2. Professional services
- 10.1. Market Analysis, Insights and Forecast - by Component
- 11. North America Customer Engagement Solution Industry Analysis, Insights and Forecast, 2019-2031
- 11.1. Market Analysis, Insights and Forecast - By Country/Sub-region
- 11.1.1 United States
- 11.1.2 Canada
- 11.1.3 Mexico
- 12. Europe Customer Engagement Solution Industry Analysis, Insights and Forecast, 2019-2031
- 12.1. Market Analysis, Insights and Forecast - By Country/Sub-region
- 12.1.1 Germany
- 12.1.2 United Kingdom
- 12.1.3 France
- 12.1.4 Spain
- 12.1.5 Italy
- 12.1.6 Spain
- 12.1.7 Belgium
- 12.1.8 Netherland
- 12.1.9 Nordics
- 12.1.10 Rest of Europe
- 13. Asia Pacific Customer Engagement Solution Industry Analysis, Insights and Forecast, 2019-2031
- 13.1. Market Analysis, Insights and Forecast - By Country/Sub-region
- 13.1.1 China
- 13.1.2 Japan
- 13.1.3 India
- 13.1.4 South Korea
- 13.1.5 Southeast Asia
- 13.1.6 Australia
- 13.1.7 Indonesia
- 13.1.8 Phillipes
- 13.1.9 Singapore
- 13.1.10 Thailandc
- 13.1.11 Rest of Asia Pacific
- 14. South America Customer Engagement Solution Industry Analysis, Insights and Forecast, 2019-2031
- 14.1. Market Analysis, Insights and Forecast - By Country/Sub-region
- 14.1.1 Brazil
- 14.1.2 Argentina
- 14.1.3 Peru
- 14.1.4 Chile
- 14.1.5 Colombia
- 14.1.6 Ecuador
- 14.1.7 Venezuela
- 14.1.8 Rest of South America
- 15. North America Customer Engagement Solution Industry Analysis, Insights and Forecast, 2019-2031
- 15.1. Market Analysis, Insights and Forecast - By Country/Sub-region
- 15.1.1 United States
- 15.1.2 Canada
- 15.1.3 Mexico
- 16. MEA Customer Engagement Solution Industry Analysis, Insights and Forecast, 2019-2031
- 16.1. Market Analysis, Insights and Forecast - By Country/Sub-region
- 16.1.1 United Arab Emirates
- 16.1.2 Saudi Arabia
- 16.1.3 South Africa
- 16.1.4 Rest of Middle East and Africa
- 17. Competitive Analysis
- 17.1. Global Market Share Analysis 2024
- 17.2. Company Profiles
- 17.2.1 Nuance Communications Inc
- 17.2.1.1. Overview
- 17.2.1.2. Products
- 17.2.1.3. SWOT Analysis
- 17.2.1.4. Recent Developments
- 17.2.1.5. Financials (Based on Availability)
- 17.2.2 Alvaria Inc
- 17.2.2.1. Overview
- 17.2.2.2. Products
- 17.2.2.3. SWOT Analysis
- 17.2.2.4. Recent Developments
- 17.2.2.5. Financials (Based on Availability)
- 17.2.3 OpenText Corporation
- 17.2.3.1. Overview
- 17.2.3.2. Products
- 17.2.3.3. SWOT Analysis
- 17.2.3.4. Recent Developments
- 17.2.3.5. Financials (Based on Availability)
- 17.2.4 IBM Corporation
- 17.2.4.1. Overview
- 17.2.4.2. Products
- 17.2.4.3. SWOT Analysis
- 17.2.4.4. Recent Developments
- 17.2.4.5. Financials (Based on Availability)
- 17.2.5 Nice Systems Ltd
- 17.2.5.1. Overview
- 17.2.5.2. Products
- 17.2.5.3. SWOT Analysis
- 17.2.5.4. Recent Developments
- 17.2.5.5. Financials (Based on Availability)
- 17.2.6 SAP SE
- 17.2.6.1. Overview
- 17.2.6.2. Products
- 17.2.6.3. SWOT Analysis
- 17.2.6.4. Recent Developments
- 17.2.6.5. Financials (Based on Availability)
- 17.2.7 Salesforce com Inc
- 17.2.7.1. Overview
- 17.2.7.2. Products
- 17.2.7.3. SWOT Analysis
- 17.2.7.4. Recent Developments
- 17.2.7.5. Financials (Based on Availability)
- 17.2.8 Avaya Inc
- 17.2.8.1. Overview
- 17.2.8.2. Products
- 17.2.8.3. SWOT Analysis
- 17.2.8.4. Recent Developments
- 17.2.8.5. Financials (Based on Availability)
- 17.2.9 Pegasystems Inc
- 17.2.9.1. Overview
- 17.2.9.2. Products
- 17.2.9.3. SWOT Analysis
- 17.2.9.4. Recent Developments
- 17.2.9.5. Financials (Based on Availability)
- 17.2.10 Verint Systems Inc
- 17.2.10.1. Overview
- 17.2.10.2. Products
- 17.2.10.3. SWOT Analysis
- 17.2.10.4. Recent Developments
- 17.2.10.5. Financials (Based on Availability)
- 17.2.11 Genesys
- 17.2.11.1. Overview
- 17.2.11.2. Products
- 17.2.11.3. SWOT Analysis
- 17.2.11.4. Recent Developments
- 17.2.11.5. Financials (Based on Availability)
- 17.2.12 Oracle Corporation
- 17.2.12.1. Overview
- 17.2.12.2. Products
- 17.2.12.3. SWOT Analysis
- 17.2.12.4. Recent Developments
- 17.2.12.5. Financials (Based on Availability)
- 17.2.13 Calabrio Inc
- 17.2.13.1. Overview
- 17.2.13.2. Products
- 17.2.13.3. SWOT Analysis
- 17.2.13.4. Recent Developments
- 17.2.13.5. Financials (Based on Availability)
- 17.2.1 Nuance Communications Inc
List of Figures
- Figure 1: Global Customer Engagement Solution Industry Revenue Breakdown (Million, %) by Region 2024 & 2032
- Figure 2: Global Customer Engagement Solution Industry Volume Breakdown (K Unit, %) by Region 2024 & 2032
- Figure 3: North America Customer Engagement Solution Industry Revenue (Million), by Country 2024 & 2032
- Figure 4: North America Customer Engagement Solution Industry Volume (K Unit), by Country 2024 & 2032
- Figure 5: North America Customer Engagement Solution Industry Revenue Share (%), by Country 2024 & 2032
- Figure 6: North America Customer Engagement Solution Industry Volume Share (%), by Country 2024 & 2032
- Figure 7: Europe Customer Engagement Solution Industry Revenue (Million), by Country 2024 & 2032
- Figure 8: Europe Customer Engagement Solution Industry Volume (K Unit), by Country 2024 & 2032
- Figure 9: Europe Customer Engagement Solution Industry Revenue Share (%), by Country 2024 & 2032
- Figure 10: Europe Customer Engagement Solution Industry Volume Share (%), by Country 2024 & 2032
- Figure 11: Asia Pacific Customer Engagement Solution Industry Revenue (Million), by Country 2024 & 2032
- Figure 12: Asia Pacific Customer Engagement Solution Industry Volume (K Unit), by Country 2024 & 2032
- Figure 13: Asia Pacific Customer Engagement Solution Industry Revenue Share (%), by Country 2024 & 2032
- Figure 14: Asia Pacific Customer Engagement Solution Industry Volume Share (%), by Country 2024 & 2032
- Figure 15: South America Customer Engagement Solution Industry Revenue (Million), by Country 2024 & 2032
- Figure 16: South America Customer Engagement Solution Industry Volume (K Unit), by Country 2024 & 2032
- Figure 17: South America Customer Engagement Solution Industry Revenue Share (%), by Country 2024 & 2032
- Figure 18: South America Customer Engagement Solution Industry Volume Share (%), by Country 2024 & 2032
- Figure 19: North America Customer Engagement Solution Industry Revenue (Million), by Country 2024 & 2032
- Figure 20: North America Customer Engagement Solution Industry Volume (K Unit), by Country 2024 & 2032
- Figure 21: North America Customer Engagement Solution Industry Revenue Share (%), by Country 2024 & 2032
- Figure 22: North America Customer Engagement Solution Industry Volume Share (%), by Country 2024 & 2032
- Figure 23: MEA Customer Engagement Solution Industry Revenue (Million), by Country 2024 & 2032
- Figure 24: MEA Customer Engagement Solution Industry Volume (K Unit), by Country 2024 & 2032
- Figure 25: MEA Customer Engagement Solution Industry Revenue Share (%), by Country 2024 & 2032
- Figure 26: MEA Customer Engagement Solution Industry Volume Share (%), by Country 2024 & 2032
- Figure 27: North America Customer Engagement Solution Industry Revenue (Million), by Component 2024 & 2032
- Figure 28: North America Customer Engagement Solution Industry Volume (K Unit), by Component 2024 & 2032
- Figure 29: North America Customer Engagement Solution Industry Revenue Share (%), by Component 2024 & 2032
- Figure 30: North America Customer Engagement Solution Industry Volume Share (%), by Component 2024 & 2032
- Figure 31: North America Customer Engagement Solution Industry Revenue (Million), by Deployment Type 2024 & 2032
- Figure 32: North America Customer Engagement Solution Industry Volume (K Unit), by Deployment Type 2024 & 2032
- Figure 33: North America Customer Engagement Solution Industry Revenue Share (%), by Deployment Type 2024 & 2032
- Figure 34: North America Customer Engagement Solution Industry Volume Share (%), by Deployment Type 2024 & 2032
- Figure 35: North America Customer Engagement Solution Industry Revenue (Million), by Organization Size 2024 & 2032
- Figure 36: North America Customer Engagement Solution Industry Volume (K Unit), by Organization Size 2024 & 2032
- Figure 37: North America Customer Engagement Solution Industry Revenue Share (%), by Organization Size 2024 & 2032
- Figure 38: North America Customer Engagement Solution Industry Volume Share (%), by Organization Size 2024 & 2032
- Figure 39: North America Customer Engagement Solution Industry Revenue (Million), by End-user Industry 2024 & 2032
- Figure 40: North America Customer Engagement Solution Industry Volume (K Unit), by End-user Industry 2024 & 2032
- Figure 41: North America Customer Engagement Solution Industry Revenue Share (%), by End-user Industry 2024 & 2032
- Figure 42: North America Customer Engagement Solution Industry Volume Share (%), by End-user Industry 2024 & 2032
- Figure 43: North America Customer Engagement Solution Industry Revenue (Million), by Services 2024 & 2032
- Figure 44: North America Customer Engagement Solution Industry Volume (K Unit), by Services 2024 & 2032
- Figure 45: North America Customer Engagement Solution Industry Revenue Share (%), by Services 2024 & 2032
- Figure 46: North America Customer Engagement Solution Industry Volume Share (%), by Services 2024 & 2032
- Figure 47: North America Customer Engagement Solution Industry Revenue (Million), by Country 2024 & 2032
- Figure 48: North America Customer Engagement Solution Industry Volume (K Unit), by Country 2024 & 2032
- Figure 49: North America Customer Engagement Solution Industry Revenue Share (%), by Country 2024 & 2032
- Figure 50: North America Customer Engagement Solution Industry Volume Share (%), by Country 2024 & 2032
- Figure 51: Europe Customer Engagement Solution Industry Revenue (Million), by Component 2024 & 2032
- Figure 52: Europe Customer Engagement Solution Industry Volume (K Unit), by Component 2024 & 2032
- Figure 53: Europe Customer Engagement Solution Industry Revenue Share (%), by Component 2024 & 2032
- Figure 54: Europe Customer Engagement Solution Industry Volume Share (%), by Component 2024 & 2032
- Figure 55: Europe Customer Engagement Solution Industry Revenue (Million), by Deployment Type 2024 & 2032
- Figure 56: Europe Customer Engagement Solution Industry Volume (K Unit), by Deployment Type 2024 & 2032
- Figure 57: Europe Customer Engagement Solution Industry Revenue Share (%), by Deployment Type 2024 & 2032
- Figure 58: Europe Customer Engagement Solution Industry Volume Share (%), by Deployment Type 2024 & 2032
- Figure 59: Europe Customer Engagement Solution Industry Revenue (Million), by Organization Size 2024 & 2032
- Figure 60: Europe Customer Engagement Solution Industry Volume (K Unit), by Organization Size 2024 & 2032
- Figure 61: Europe Customer Engagement Solution Industry Revenue Share (%), by Organization Size 2024 & 2032
- Figure 62: Europe Customer Engagement Solution Industry Volume Share (%), by Organization Size 2024 & 2032
- Figure 63: Europe Customer Engagement Solution Industry Revenue (Million), by End-user Industry 2024 & 2032
- Figure 64: Europe Customer Engagement Solution Industry Volume (K Unit), by End-user Industry 2024 & 2032
- Figure 65: Europe Customer Engagement Solution Industry Revenue Share (%), by End-user Industry 2024 & 2032
- Figure 66: Europe Customer Engagement Solution Industry Volume Share (%), by End-user Industry 2024 & 2032
- Figure 67: Europe Customer Engagement Solution Industry Revenue (Million), by Services 2024 & 2032
- Figure 68: Europe Customer Engagement Solution Industry Volume (K Unit), by Services 2024 & 2032
- Figure 69: Europe Customer Engagement Solution Industry Revenue Share (%), by Services 2024 & 2032
- Figure 70: Europe Customer Engagement Solution Industry Volume Share (%), by Services 2024 & 2032
- Figure 71: Europe Customer Engagement Solution Industry Revenue (Million), by Country 2024 & 2032
- Figure 72: Europe Customer Engagement Solution Industry Volume (K Unit), by Country 2024 & 2032
- Figure 73: Europe Customer Engagement Solution Industry Revenue Share (%), by Country 2024 & 2032
- Figure 74: Europe Customer Engagement Solution Industry Volume Share (%), by Country 2024 & 2032
- Figure 75: Asia Customer Engagement Solution Industry Revenue (Million), by Component 2024 & 2032
- Figure 76: Asia Customer Engagement Solution Industry Volume (K Unit), by Component 2024 & 2032
- Figure 77: Asia Customer Engagement Solution Industry Revenue Share (%), by Component 2024 & 2032
- Figure 78: Asia Customer Engagement Solution Industry Volume Share (%), by Component 2024 & 2032
- Figure 79: Asia Customer Engagement Solution Industry Revenue (Million), by Deployment Type 2024 & 2032
- Figure 80: Asia Customer Engagement Solution Industry Volume (K Unit), by Deployment Type 2024 & 2032
- Figure 81: Asia Customer Engagement Solution Industry Revenue Share (%), by Deployment Type 2024 & 2032
- Figure 82: Asia Customer Engagement Solution Industry Volume Share (%), by Deployment Type 2024 & 2032
- Figure 83: Asia Customer Engagement Solution Industry Revenue (Million), by Organization Size 2024 & 2032
- Figure 84: Asia Customer Engagement Solution Industry Volume (K Unit), by Organization Size 2024 & 2032
- Figure 85: Asia Customer Engagement Solution Industry Revenue Share (%), by Organization Size 2024 & 2032
- Figure 86: Asia Customer Engagement Solution Industry Volume Share (%), by Organization Size 2024 & 2032
- Figure 87: Asia Customer Engagement Solution Industry Revenue (Million), by End-user Industry 2024 & 2032
- Figure 88: Asia Customer Engagement Solution Industry Volume (K Unit), by End-user Industry 2024 & 2032
- Figure 89: Asia Customer Engagement Solution Industry Revenue Share (%), by End-user Industry 2024 & 2032
- Figure 90: Asia Customer Engagement Solution Industry Volume Share (%), by End-user Industry 2024 & 2032
- Figure 91: Asia Customer Engagement Solution Industry Revenue (Million), by Services 2024 & 2032
- Figure 92: Asia Customer Engagement Solution Industry Volume (K Unit), by Services 2024 & 2032
- Figure 93: Asia Customer Engagement Solution Industry Revenue Share (%), by Services 2024 & 2032
- Figure 94: Asia Customer Engagement Solution Industry Volume Share (%), by Services 2024 & 2032
- Figure 95: Asia Customer Engagement Solution Industry Revenue (Million), by Country 2024 & 2032
- Figure 96: Asia Customer Engagement Solution Industry Volume (K Unit), by Country 2024 & 2032
- Figure 97: Asia Customer Engagement Solution Industry Revenue Share (%), by Country 2024 & 2032
- Figure 98: Asia Customer Engagement Solution Industry Volume Share (%), by Country 2024 & 2032
- Figure 99: Latin America Customer Engagement Solution Industry Revenue (Million), by Component 2024 & 2032
- Figure 100: Latin America Customer Engagement Solution Industry Volume (K Unit), by Component 2024 & 2032
- Figure 101: Latin America Customer Engagement Solution Industry Revenue Share (%), by Component 2024 & 2032
- Figure 102: Latin America Customer Engagement Solution Industry Volume Share (%), by Component 2024 & 2032
- Figure 103: Latin America Customer Engagement Solution Industry Revenue (Million), by Deployment Type 2024 & 2032
- Figure 104: Latin America Customer Engagement Solution Industry Volume (K Unit), by Deployment Type 2024 & 2032
- Figure 105: Latin America Customer Engagement Solution Industry Revenue Share (%), by Deployment Type 2024 & 2032
- Figure 106: Latin America Customer Engagement Solution Industry Volume Share (%), by Deployment Type 2024 & 2032
- Figure 107: Latin America Customer Engagement Solution Industry Revenue (Million), by Organization Size 2024 & 2032
- Figure 108: Latin America Customer Engagement Solution Industry Volume (K Unit), by Organization Size 2024 & 2032
- Figure 109: Latin America Customer Engagement Solution Industry Revenue Share (%), by Organization Size 2024 & 2032
- Figure 110: Latin America Customer Engagement Solution Industry Volume Share (%), by Organization Size 2024 & 2032
- Figure 111: Latin America Customer Engagement Solution Industry Revenue (Million), by End-user Industry 2024 & 2032
- Figure 112: Latin America Customer Engagement Solution Industry Volume (K Unit), by End-user Industry 2024 & 2032
- Figure 113: Latin America Customer Engagement Solution Industry Revenue Share (%), by End-user Industry 2024 & 2032
- Figure 114: Latin America Customer Engagement Solution Industry Volume Share (%), by End-user Industry 2024 & 2032
- Figure 115: Latin America Customer Engagement Solution Industry Revenue (Million), by Services 2024 & 2032
- Figure 116: Latin America Customer Engagement Solution Industry Volume (K Unit), by Services 2024 & 2032
- Figure 117: Latin America Customer Engagement Solution Industry Revenue Share (%), by Services 2024 & 2032
- Figure 118: Latin America Customer Engagement Solution Industry Volume Share (%), by Services 2024 & 2032
- Figure 119: Latin America Customer Engagement Solution Industry Revenue (Million), by Country 2024 & 2032
- Figure 120: Latin America Customer Engagement Solution Industry Volume (K Unit), by Country 2024 & 2032
- Figure 121: Latin America Customer Engagement Solution Industry Revenue Share (%), by Country 2024 & 2032
- Figure 122: Latin America Customer Engagement Solution Industry Volume Share (%), by Country 2024 & 2032
- Figure 123: Middle East and Africa Customer Engagement Solution Industry Revenue (Million), by Component 2024 & 2032
- Figure 124: Middle East and Africa Customer Engagement Solution Industry Volume (K Unit), by Component 2024 & 2032
- Figure 125: Middle East and Africa Customer Engagement Solution Industry Revenue Share (%), by Component 2024 & 2032
- Figure 126: Middle East and Africa Customer Engagement Solution Industry Volume Share (%), by Component 2024 & 2032
- Figure 127: Middle East and Africa Customer Engagement Solution Industry Revenue (Million), by Deployment Type 2024 & 2032
- Figure 128: Middle East and Africa Customer Engagement Solution Industry Volume (K Unit), by Deployment Type 2024 & 2032
- Figure 129: Middle East and Africa Customer Engagement Solution Industry Revenue Share (%), by Deployment Type 2024 & 2032
- Figure 130: Middle East and Africa Customer Engagement Solution Industry Volume Share (%), by Deployment Type 2024 & 2032
- Figure 131: Middle East and Africa Customer Engagement Solution Industry Revenue (Million), by Organization Size 2024 & 2032
- Figure 132: Middle East and Africa Customer Engagement Solution Industry Volume (K Unit), by Organization Size 2024 & 2032
- Figure 133: Middle East and Africa Customer Engagement Solution Industry Revenue Share (%), by Organization Size 2024 & 2032
- Figure 134: Middle East and Africa Customer Engagement Solution Industry Volume Share (%), by Organization Size 2024 & 2032
- Figure 135: Middle East and Africa Customer Engagement Solution Industry Revenue (Million), by End-user Industry 2024 & 2032
- Figure 136: Middle East and Africa Customer Engagement Solution Industry Volume (K Unit), by End-user Industry 2024 & 2032
- Figure 137: Middle East and Africa Customer Engagement Solution Industry Revenue Share (%), by End-user Industry 2024 & 2032
- Figure 138: Middle East and Africa Customer Engagement Solution Industry Volume Share (%), by End-user Industry 2024 & 2032
- Figure 139: Middle East and Africa Customer Engagement Solution Industry Revenue (Million), by Services 2024 & 2032
- Figure 140: Middle East and Africa Customer Engagement Solution Industry Volume (K Unit), by Services 2024 & 2032
- Figure 141: Middle East and Africa Customer Engagement Solution Industry Revenue Share (%), by Services 2024 & 2032
- Figure 142: Middle East and Africa Customer Engagement Solution Industry Volume Share (%), by Services 2024 & 2032
- Figure 143: Middle East and Africa Customer Engagement Solution Industry Revenue (Million), by Country 2024 & 2032
- Figure 144: Middle East and Africa Customer Engagement Solution Industry Volume (K Unit), by Country 2024 & 2032
- Figure 145: Middle East and Africa Customer Engagement Solution Industry Revenue Share (%), by Country 2024 & 2032
- Figure 146: Middle East and Africa Customer Engagement Solution Industry Volume Share (%), by Country 2024 & 2032
List of Tables
- Table 1: Global Customer Engagement Solution Industry Revenue Million Forecast, by Region 2019 & 2032
- Table 2: Global Customer Engagement Solution Industry Volume K Unit Forecast, by Region 2019 & 2032
- Table 3: Global Customer Engagement Solution Industry Revenue Million Forecast, by Component 2019 & 2032
- Table 4: Global Customer Engagement Solution Industry Volume K Unit Forecast, by Component 2019 & 2032
- Table 5: Global Customer Engagement Solution Industry Revenue Million Forecast, by Deployment Type 2019 & 2032
- Table 6: Global Customer Engagement Solution Industry Volume K Unit Forecast, by Deployment Type 2019 & 2032
- Table 7: Global Customer Engagement Solution Industry Revenue Million Forecast, by Organization Size 2019 & 2032
- Table 8: Global Customer Engagement Solution Industry Volume K Unit Forecast, by Organization Size 2019 & 2032
- Table 9: Global Customer Engagement Solution Industry Revenue Million Forecast, by End-user Industry 2019 & 2032
- Table 10: Global Customer Engagement Solution Industry Volume K Unit Forecast, by End-user Industry 2019 & 2032
- Table 11: Global Customer Engagement Solution Industry Revenue Million Forecast, by Services 2019 & 2032
- Table 12: Global Customer Engagement Solution Industry Volume K Unit Forecast, by Services 2019 & 2032
- Table 13: Global Customer Engagement Solution Industry Revenue Million Forecast, by Region 2019 & 2032
- Table 14: Global Customer Engagement Solution Industry Volume K Unit Forecast, by Region 2019 & 2032
- Table 15: Global Customer Engagement Solution Industry Revenue Million Forecast, by Country 2019 & 2032
- Table 16: Global Customer Engagement Solution Industry Volume K Unit Forecast, by Country 2019 & 2032
- Table 17: United States Customer Engagement Solution Industry Revenue (Million) Forecast, by Application 2019 & 2032
- Table 18: United States Customer Engagement Solution Industry Volume (K Unit) Forecast, by Application 2019 & 2032
- Table 19: Canada Customer Engagement Solution Industry Revenue (Million) Forecast, by Application 2019 & 2032
- Table 20: Canada Customer Engagement Solution Industry Volume (K Unit) Forecast, by Application 2019 & 2032
- Table 21: Mexico Customer Engagement Solution Industry Revenue (Million) Forecast, by Application 2019 & 2032
- Table 22: Mexico Customer Engagement Solution Industry Volume (K Unit) Forecast, by Application 2019 & 2032
- Table 23: Global Customer Engagement Solution Industry Revenue Million Forecast, by Country 2019 & 2032
- Table 24: Global Customer Engagement Solution Industry Volume K Unit Forecast, by Country 2019 & 2032
- Table 25: Germany Customer Engagement Solution Industry Revenue (Million) Forecast, by Application 2019 & 2032
- Table 26: Germany Customer Engagement Solution Industry Volume (K Unit) Forecast, by Application 2019 & 2032
- Table 27: United Kingdom Customer Engagement Solution Industry Revenue (Million) Forecast, by Application 2019 & 2032
- Table 28: United Kingdom Customer Engagement Solution Industry Volume (K Unit) Forecast, by Application 2019 & 2032
- Table 29: France Customer Engagement Solution Industry Revenue (Million) Forecast, by Application 2019 & 2032
- Table 30: France Customer Engagement Solution Industry Volume (K Unit) Forecast, by Application 2019 & 2032
- Table 31: Spain Customer Engagement Solution Industry Revenue (Million) Forecast, by Application 2019 & 2032
- Table 32: Spain Customer Engagement Solution Industry Volume (K Unit) Forecast, by Application 2019 & 2032
- Table 33: Italy Customer Engagement Solution Industry Revenue (Million) Forecast, by Application 2019 & 2032
- Table 34: Italy Customer Engagement Solution Industry Volume (K Unit) Forecast, by Application 2019 & 2032
- Table 35: Spain Customer Engagement Solution Industry Revenue (Million) Forecast, by Application 2019 & 2032
- Table 36: Spain Customer Engagement Solution Industry Volume (K Unit) Forecast, by Application 2019 & 2032
- Table 37: Belgium Customer Engagement Solution Industry Revenue (Million) Forecast, by Application 2019 & 2032
- Table 38: Belgium Customer Engagement Solution Industry Volume (K Unit) Forecast, by Application 2019 & 2032
- Table 39: Netherland Customer Engagement Solution Industry Revenue (Million) Forecast, by Application 2019 & 2032
- Table 40: Netherland Customer Engagement Solution Industry Volume (K Unit) Forecast, by Application 2019 & 2032
- Table 41: Nordics Customer Engagement Solution Industry Revenue (Million) Forecast, by Application 2019 & 2032
- Table 42: Nordics Customer Engagement Solution Industry Volume (K Unit) Forecast, by Application 2019 & 2032
- Table 43: Rest of Europe Customer Engagement Solution Industry Revenue (Million) Forecast, by Application 2019 & 2032
- Table 44: Rest of Europe Customer Engagement Solution Industry Volume (K Unit) Forecast, by Application 2019 & 2032
- Table 45: Global Customer Engagement Solution Industry Revenue Million Forecast, by Country 2019 & 2032
- Table 46: Global Customer Engagement Solution Industry Volume K Unit Forecast, by Country 2019 & 2032
- Table 47: China Customer Engagement Solution Industry Revenue (Million) Forecast, by Application 2019 & 2032
- Table 48: China Customer Engagement Solution Industry Volume (K Unit) Forecast, by Application 2019 & 2032
- Table 49: Japan Customer Engagement Solution Industry Revenue (Million) Forecast, by Application 2019 & 2032
- Table 50: Japan Customer Engagement Solution Industry Volume (K Unit) Forecast, by Application 2019 & 2032
- Table 51: India Customer Engagement Solution Industry Revenue (Million) Forecast, by Application 2019 & 2032
- Table 52: India Customer Engagement Solution Industry Volume (K Unit) Forecast, by Application 2019 & 2032
- Table 53: South Korea Customer Engagement Solution Industry Revenue (Million) Forecast, by Application 2019 & 2032
- Table 54: South Korea Customer Engagement Solution Industry Volume (K Unit) Forecast, by Application 2019 & 2032
- Table 55: Southeast Asia Customer Engagement Solution Industry Revenue (Million) Forecast, by Application 2019 & 2032
- Table 56: Southeast Asia Customer Engagement Solution Industry Volume (K Unit) Forecast, by Application 2019 & 2032
- Table 57: Australia Customer Engagement Solution Industry Revenue (Million) Forecast, by Application 2019 & 2032
- Table 58: Australia Customer Engagement Solution Industry Volume (K Unit) Forecast, by Application 2019 & 2032
- Table 59: Indonesia Customer Engagement Solution Industry Revenue (Million) Forecast, by Application 2019 & 2032
- Table 60: Indonesia Customer Engagement Solution Industry Volume (K Unit) Forecast, by Application 2019 & 2032
- Table 61: Phillipes Customer Engagement Solution Industry Revenue (Million) Forecast, by Application 2019 & 2032
- Table 62: Phillipes Customer Engagement Solution Industry Volume (K Unit) Forecast, by Application 2019 & 2032
- Table 63: Singapore Customer Engagement Solution Industry Revenue (Million) Forecast, by Application 2019 & 2032
- Table 64: Singapore Customer Engagement Solution Industry Volume (K Unit) Forecast, by Application 2019 & 2032
- Table 65: Thailandc Customer Engagement Solution Industry Revenue (Million) Forecast, by Application 2019 & 2032
- Table 66: Thailandc Customer Engagement Solution Industry Volume (K Unit) Forecast, by Application 2019 & 2032
- Table 67: Rest of Asia Pacific Customer Engagement Solution Industry Revenue (Million) Forecast, by Application 2019 & 2032
- Table 68: Rest of Asia Pacific Customer Engagement Solution Industry Volume (K Unit) Forecast, by Application 2019 & 2032
- Table 69: Global Customer Engagement Solution Industry Revenue Million Forecast, by Country 2019 & 2032
- Table 70: Global Customer Engagement Solution Industry Volume K Unit Forecast, by Country 2019 & 2032
- Table 71: Brazil Customer Engagement Solution Industry Revenue (Million) Forecast, by Application 2019 & 2032
- Table 72: Brazil Customer Engagement Solution Industry Volume (K Unit) Forecast, by Application 2019 & 2032
- Table 73: Argentina Customer Engagement Solution Industry Revenue (Million) Forecast, by Application 2019 & 2032
- Table 74: Argentina Customer Engagement Solution Industry Volume (K Unit) Forecast, by Application 2019 & 2032
- Table 75: Peru Customer Engagement Solution Industry Revenue (Million) Forecast, by Application 2019 & 2032
- Table 76: Peru Customer Engagement Solution Industry Volume (K Unit) Forecast, by Application 2019 & 2032
- Table 77: Chile Customer Engagement Solution Industry Revenue (Million) Forecast, by Application 2019 & 2032
- Table 78: Chile Customer Engagement Solution Industry Volume (K Unit) Forecast, by Application 2019 & 2032
- Table 79: Colombia Customer Engagement Solution Industry Revenue (Million) Forecast, by Application 2019 & 2032
- Table 80: Colombia Customer Engagement Solution Industry Volume (K Unit) Forecast, by Application 2019 & 2032
- Table 81: Ecuador Customer Engagement Solution Industry Revenue (Million) Forecast, by Application 2019 & 2032
- Table 82: Ecuador Customer Engagement Solution Industry Volume (K Unit) Forecast, by Application 2019 & 2032
- Table 83: Venezuela Customer Engagement Solution Industry Revenue (Million) Forecast, by Application 2019 & 2032
- Table 84: Venezuela Customer Engagement Solution Industry Volume (K Unit) Forecast, by Application 2019 & 2032
- Table 85: Rest of South America Customer Engagement Solution Industry Revenue (Million) Forecast, by Application 2019 & 2032
- Table 86: Rest of South America Customer Engagement Solution Industry Volume (K Unit) Forecast, by Application 2019 & 2032
- Table 87: Global Customer Engagement Solution Industry Revenue Million Forecast, by Country 2019 & 2032
- Table 88: Global Customer Engagement Solution Industry Volume K Unit Forecast, by Country 2019 & 2032
- Table 89: United States Customer Engagement Solution Industry Revenue (Million) Forecast, by Application 2019 & 2032
- Table 90: United States Customer Engagement Solution Industry Volume (K Unit) Forecast, by Application 2019 & 2032
- Table 91: Canada Customer Engagement Solution Industry Revenue (Million) Forecast, by Application 2019 & 2032
- Table 92: Canada Customer Engagement Solution Industry Volume (K Unit) Forecast, by Application 2019 & 2032
- Table 93: Mexico Customer Engagement Solution Industry Revenue (Million) Forecast, by Application 2019 & 2032
- Table 94: Mexico Customer Engagement Solution Industry Volume (K Unit) Forecast, by Application 2019 & 2032
- Table 95: Global Customer Engagement Solution Industry Revenue Million Forecast, by Country 2019 & 2032
- Table 96: Global Customer Engagement Solution Industry Volume K Unit Forecast, by Country 2019 & 2032
- Table 97: United Arab Emirates Customer Engagement Solution Industry Revenue (Million) Forecast, by Application 2019 & 2032
- Table 98: United Arab Emirates Customer Engagement Solution Industry Volume (K Unit) Forecast, by Application 2019 & 2032
- Table 99: Saudi Arabia Customer Engagement Solution Industry Revenue (Million) Forecast, by Application 2019 & 2032
- Table 100: Saudi Arabia Customer Engagement Solution Industry Volume (K Unit) Forecast, by Application 2019 & 2032
- Table 101: South Africa Customer Engagement Solution Industry Revenue (Million) Forecast, by Application 2019 & 2032
- Table 102: South Africa Customer Engagement Solution Industry Volume (K Unit) Forecast, by Application 2019 & 2032
- Table 103: Rest of Middle East and Africa Customer Engagement Solution Industry Revenue (Million) Forecast, by Application 2019 & 2032
- Table 104: Rest of Middle East and Africa Customer Engagement Solution Industry Volume (K Unit) Forecast, by Application 2019 & 2032
- Table 105: Global Customer Engagement Solution Industry Revenue Million Forecast, by Component 2019 & 2032
- Table 106: Global Customer Engagement Solution Industry Volume K Unit Forecast, by Component 2019 & 2032
- Table 107: Global Customer Engagement Solution Industry Revenue Million Forecast, by Deployment Type 2019 & 2032
- Table 108: Global Customer Engagement Solution Industry Volume K Unit Forecast, by Deployment Type 2019 & 2032
- Table 109: Global Customer Engagement Solution Industry Revenue Million Forecast, by Organization Size 2019 & 2032
- Table 110: Global Customer Engagement Solution Industry Volume K Unit Forecast, by Organization Size 2019 & 2032
- Table 111: Global Customer Engagement Solution Industry Revenue Million Forecast, by End-user Industry 2019 & 2032
- Table 112: Global Customer Engagement Solution Industry Volume K Unit Forecast, by End-user Industry 2019 & 2032
- Table 113: Global Customer Engagement Solution Industry Revenue Million Forecast, by Services 2019 & 2032
- Table 114: Global Customer Engagement Solution Industry Volume K Unit Forecast, by Services 2019 & 2032
- Table 115: Global Customer Engagement Solution Industry Revenue Million Forecast, by Country 2019 & 2032
- Table 116: Global Customer Engagement Solution Industry Volume K Unit Forecast, by Country 2019 & 2032
- Table 117: United States Customer Engagement Solution Industry Revenue (Million) Forecast, by Application 2019 & 2032
- Table 118: United States Customer Engagement Solution Industry Volume (K Unit) Forecast, by Application 2019 & 2032
- Table 119: Canada Customer Engagement Solution Industry Revenue (Million) Forecast, by Application 2019 & 2032
- Table 120: Canada Customer Engagement Solution Industry Volume (K Unit) Forecast, by Application 2019 & 2032
- Table 121: Global Customer Engagement Solution Industry Revenue Million Forecast, by Component 2019 & 2032
- Table 122: Global Customer Engagement Solution Industry Volume K Unit Forecast, by Component 2019 & 2032
- Table 123: Global Customer Engagement Solution Industry Revenue Million Forecast, by Deployment Type 2019 & 2032
- Table 124: Global Customer Engagement Solution Industry Volume K Unit Forecast, by Deployment Type 2019 & 2032
- Table 125: Global Customer Engagement Solution Industry Revenue Million Forecast, by Organization Size 2019 & 2032
- Table 126: Global Customer Engagement Solution Industry Volume K Unit Forecast, by Organization Size 2019 & 2032
- Table 127: Global Customer Engagement Solution Industry Revenue Million Forecast, by End-user Industry 2019 & 2032
- Table 128: Global Customer Engagement Solution Industry Volume K Unit Forecast, by End-user Industry 2019 & 2032
- Table 129: Global Customer Engagement Solution Industry Revenue Million Forecast, by Services 2019 & 2032
- Table 130: Global Customer Engagement Solution Industry Volume K Unit Forecast, by Services 2019 & 2032
- Table 131: Global Customer Engagement Solution Industry Revenue Million Forecast, by Country 2019 & 2032
- Table 132: Global Customer Engagement Solution Industry Volume K Unit Forecast, by Country 2019 & 2032
- Table 133: United Kingdom Customer Engagement Solution Industry Revenue (Million) Forecast, by Application 2019 & 2032
- Table 134: United Kingdom Customer Engagement Solution Industry Volume (K Unit) Forecast, by Application 2019 & 2032
- Table 135: Germany Customer Engagement Solution Industry Revenue (Million) Forecast, by Application 2019 & 2032
- Table 136: Germany Customer Engagement Solution Industry Volume (K Unit) Forecast, by Application 2019 & 2032
- Table 137: France Customer Engagement Solution Industry Revenue (Million) Forecast, by Application 2019 & 2032
- Table 138: France Customer Engagement Solution Industry Volume (K Unit) Forecast, by Application 2019 & 2032
- Table 139: Global Customer Engagement Solution Industry Revenue Million Forecast, by Component 2019 & 2032
- Table 140: Global Customer Engagement Solution Industry Volume K Unit Forecast, by Component 2019 & 2032
- Table 141: Global Customer Engagement Solution Industry Revenue Million Forecast, by Deployment Type 2019 & 2032
- Table 142: Global Customer Engagement Solution Industry Volume K Unit Forecast, by Deployment Type 2019 & 2032
- Table 143: Global Customer Engagement Solution Industry Revenue Million Forecast, by Organization Size 2019 & 2032
- Table 144: Global Customer Engagement Solution Industry Volume K Unit Forecast, by Organization Size 2019 & 2032
- Table 145: Global Customer Engagement Solution Industry Revenue Million Forecast, by End-user Industry 2019 & 2032
- Table 146: Global Customer Engagement Solution Industry Volume K Unit Forecast, by End-user Industry 2019 & 2032
- Table 147: Global Customer Engagement Solution Industry Revenue Million Forecast, by Services 2019 & 2032
- Table 148: Global Customer Engagement Solution Industry Volume K Unit Forecast, by Services 2019 & 2032
- Table 149: Global Customer Engagement Solution Industry Revenue Million Forecast, by Country 2019 & 2032
- Table 150: Global Customer Engagement Solution Industry Volume K Unit Forecast, by Country 2019 & 2032
- Table 151: China Customer Engagement Solution Industry Revenue (Million) Forecast, by Application 2019 & 2032
- Table 152: China Customer Engagement Solution Industry Volume (K Unit) Forecast, by Application 2019 & 2032
- Table 153: India Customer Engagement Solution Industry Revenue (Million) Forecast, by Application 2019 & 2032
- Table 154: India Customer Engagement Solution Industry Volume (K Unit) Forecast, by Application 2019 & 2032
- Table 155: Japan Customer Engagement Solution Industry Revenue (Million) Forecast, by Application 2019 & 2032
- Table 156: Japan Customer Engagement Solution Industry Volume (K Unit) Forecast, by Application 2019 & 2032
- Table 157: Global Customer Engagement Solution Industry Revenue Million Forecast, by Component 2019 & 2032
- Table 158: Global Customer Engagement Solution Industry Volume K Unit Forecast, by Component 2019 & 2032
- Table 159: Global Customer Engagement Solution Industry Revenue Million Forecast, by Deployment Type 2019 & 2032
- Table 160: Global Customer Engagement Solution Industry Volume K Unit Forecast, by Deployment Type 2019 & 2032
- Table 161: Global Customer Engagement Solution Industry Revenue Million Forecast, by Organization Size 2019 & 2032
- Table 162: Global Customer Engagement Solution Industry Volume K Unit Forecast, by Organization Size 2019 & 2032
- Table 163: Global Customer Engagement Solution Industry Revenue Million Forecast, by End-user Industry 2019 & 2032
- Table 164: Global Customer Engagement Solution Industry Volume K Unit Forecast, by End-user Industry 2019 & 2032
- Table 165: Global Customer Engagement Solution Industry Revenue Million Forecast, by Services 2019 & 2032
- Table 166: Global Customer Engagement Solution Industry Volume K Unit Forecast, by Services 2019 & 2032
- Table 167: Global Customer Engagement Solution Industry Revenue Million Forecast, by Country 2019 & 2032
- Table 168: Global Customer Engagement Solution Industry Volume K Unit Forecast, by Country 2019 & 2032
- Table 169: Brazil Customer Engagement Solution Industry Revenue (Million) Forecast, by Application 2019 & 2032
- Table 170: Brazil Customer Engagement Solution Industry Volume (K Unit) Forecast, by Application 2019 & 2032
- Table 171: Argentina Customer Engagement Solution Industry Revenue (Million) Forecast, by Application 2019 & 2032
- Table 172: Argentina Customer Engagement Solution Industry Volume (K Unit) Forecast, by Application 2019 & 2032
- Table 173: Rest of South America Customer Engagement Solution Industry Revenue (Million) Forecast, by Application 2019 & 2032
- Table 174: Rest of South America Customer Engagement Solution Industry Volume (K Unit) Forecast, by Application 2019 & 2032
- Table 175: Global Customer Engagement Solution Industry Revenue Million Forecast, by Component 2019 & 2032
- Table 176: Global Customer Engagement Solution Industry Volume K Unit Forecast, by Component 2019 & 2032
- Table 177: Global Customer Engagement Solution Industry Revenue Million Forecast, by Deployment Type 2019 & 2032
- Table 178: Global Customer Engagement Solution Industry Volume K Unit Forecast, by Deployment Type 2019 & 2032
- Table 179: Global Customer Engagement Solution Industry Revenue Million Forecast, by Organization Size 2019 & 2032
- Table 180: Global Customer Engagement Solution Industry Volume K Unit Forecast, by Organization Size 2019 & 2032
- Table 181: Global Customer Engagement Solution Industry Revenue Million Forecast, by End-user Industry 2019 & 2032
- Table 182: Global Customer Engagement Solution Industry Volume K Unit Forecast, by End-user Industry 2019 & 2032
- Table 183: Global Customer Engagement Solution Industry Revenue Million Forecast, by Services 2019 & 2032
- Table 184: Global Customer Engagement Solution Industry Volume K Unit Forecast, by Services 2019 & 2032
- Table 185: Global Customer Engagement Solution Industry Revenue Million Forecast, by Country 2019 & 2032
- Table 186: Global Customer Engagement Solution Industry Volume K Unit Forecast, by Country 2019 & 2032
- Table 187: UAE Customer Engagement Solution Industry Revenue (Million) Forecast, by Application 2019 & 2032
- Table 188: UAE Customer Engagement Solution Industry Volume (K Unit) Forecast, by Application 2019 & 2032
- Table 189: South Africa Customer Engagement Solution Industry Revenue (Million) Forecast, by Application 2019 & 2032
- Table 190: South Africa Customer Engagement Solution Industry Volume (K Unit) Forecast, by Application 2019 & 2032
- Table 191: Saudi Arabia Customer Engagement Solution Industry Revenue (Million) Forecast, by Application 2019 & 2032
- Table 192: Saudi Arabia Customer Engagement Solution Industry Volume (K Unit) Forecast, by Application 2019 & 2032
- Table 193: Rest Of MEA Customer Engagement Solution Industry Revenue (Million) Forecast, by Application 2019 & 2032
- Table 194: Rest Of MEA Customer Engagement Solution Industry Volume (K Unit) Forecast, by Application 2019 & 2032
Frequently Asked Questions
1. What is the projected Compound Annual Growth Rate (CAGR) of the Customer Engagement Solution Industry?
The projected CAGR is approximately 10.97%.
2. Which companies are prominent players in the Customer Engagement Solution Industry?
Key companies in the market include Nuance Communications Inc, Alvaria Inc, OpenText Corporation, IBM Corporation, Nice Systems Ltd, SAP SE, Salesforce com Inc, Avaya Inc, Pegasystems Inc, Verint Systems Inc, Genesys, Oracle Corporation, Calabrio Inc.
3. What are the main segments of the Customer Engagement Solution Industry?
The market segments include Component, Deployment Type, Organization Size, End-user Industry, Services.
4. Can you provide details about the market size?
The market size is estimated to be USD 21.84 Million as of 2022.
5. What are some drivers contributing to market growth?
Rapidly Increasing Cybersecurity Incidents and Regulations Requiring Their Reporting; Growing M2M/IoT Connections Demanding Strengthened Cybersecurity in Enterprises.
6. What are the notable trends driving market growth?
BFSI Industry Have the Significant Market Share.
7. Are there any restraints impacting market growth?
Lack of Cybersecurity Professionals; High Reliance on Traditional Authentication Methods and Low Preparedness.
8. Can you provide examples of recent developments in the market?
February 2023: GoTo, a firm that makes business communication, IT administration, and support simple with its core products GoTo Resolve, GoTo Connect, and Rescue, announced the launch of GoTo Customer Engagement. In a single, shared inbox, this innovative multi-channel solution combines GoTo Connect's premium phone system, customer communication tools, analytics, and the digital channels customers need to reach a wider audience and expand their businesses.
9. What pricing options are available for accessing the report?
Pricing options include single-user, multi-user, and enterprise licenses priced at USD 4750, USD 5250, and USD 8750 respectively.
10. Is the market size provided in terms of value or volume?
The market size is provided in terms of value, measured in Million and volume, measured in K Unit.
11. Are there any specific market keywords associated with the report?
Yes, the market keyword associated with the report is "Customer Engagement Solution Industry," which aids in identifying and referencing the specific market segment covered.
12. How do I determine which pricing option suits my needs best?
The pricing options vary based on user requirements and access needs. Individual users may opt for single-user licenses, while businesses requiring broader access may choose multi-user or enterprise licenses for cost-effective access to the report.
13. Are there any additional resources or data provided in the Customer Engagement Solution Industry report?
While the report offers comprehensive insights, it's advisable to review the specific contents or supplementary materials provided to ascertain if additional resources or data are available.
14. How can I stay updated on further developments or reports in the Customer Engagement Solution Industry?
To stay informed about further developments, trends, and reports in the Customer Engagement Solution Industry, consider subscribing to industry newsletters, following relevant companies and organizations, or regularly checking reputable industry news sources and publications.
Methodology
Step 1 - Identification of Relevant Samples Size from Population Database


Step 2 - Approaches for Defining Global Market Size (Value, Volume* & Price*)

Note*: In applicable scenarios
Step 3 - Data Sources
Primary Research
- Web Analytics
- Survey Reports
- Research Institute
- Latest Research Reports
- Opinion Leaders
Secondary Research
- Annual Reports
- White Paper
- Latest Press Release
- Industry Association
- Paid Database
- Investor Presentations

Step 4 - Data Triangulation
Involves using different sources of information in order to increase the validity of a study
These sources are likely to be stakeholders in a program - participants, other researchers, program staff, other community members, and so on.
Then we put all data in single framework & apply various statistical tools to find out the dynamic on the market.
During the analysis stage, feedback from the stakeholder groups would be compared to determine areas of agreement as well as areas of divergence


