
Key Insights
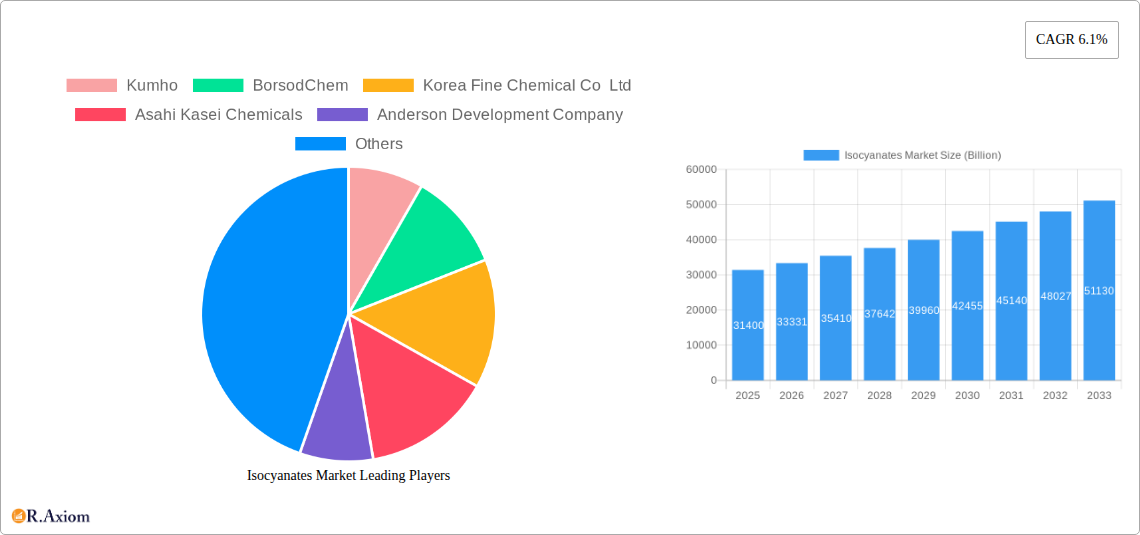
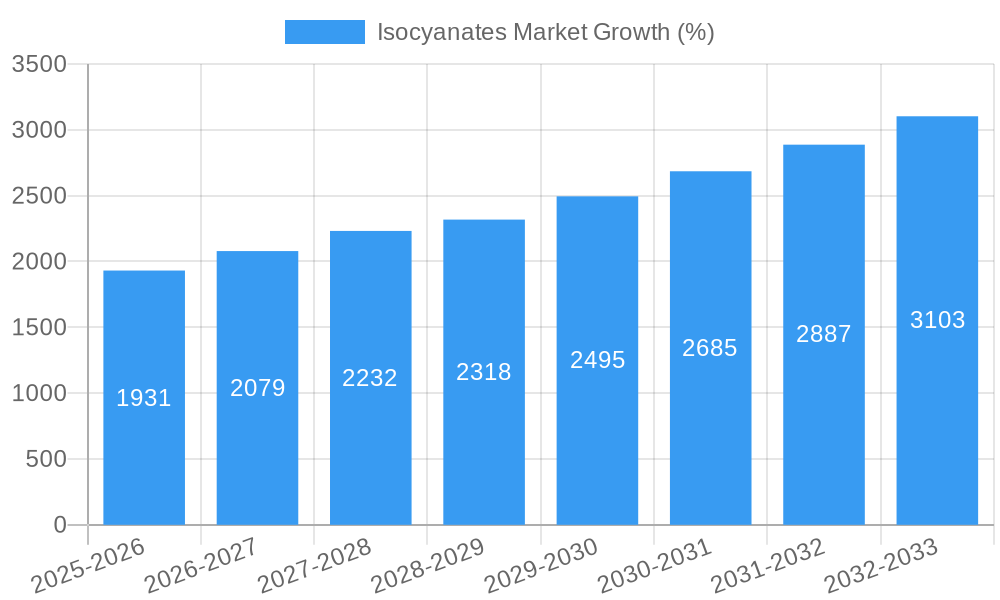
The global isocyanates market, valued at $31.4 billion in 2025, is projected to experience robust growth, driven by a compound annual growth rate (CAGR) of 6.1% from 2025 to 2033. This expansion is fueled by several key factors. The burgeoning construction industry, particularly in developing economies, significantly boosts demand for isocyanates in rigid and flexible foams used for insulation and other applications. The automotive sector's continued growth, coupled with increasing demand for lightweight and high-performance materials, further propels market expansion. Furthermore, the rising adoption of isocyanates in paints and coatings, adhesives and sealants, and other specialized applications across diverse end-use industries like healthcare and furniture, contributes to overall market growth. Competitive pricing strategies employed by major players, alongside ongoing research and development focused on improving product performance and sustainability, also stimulate market dynamics.
However, the market faces certain challenges. Stringent environmental regulations concerning volatile organic compounds (VOCs) and the increasing focus on sustainable alternatives pose potential restraints. Fluctuations in raw material prices, particularly crude oil, can impact production costs and profitability. Nevertheless, the overall market outlook remains positive, driven by the continuous expansion of key end-use sectors and ongoing innovations in isocyanate technology, making it a lucrative investment opportunity. The market segmentation, encompassing various types (MDI, TDI, Aliphatic, Others), applications (Rigid Foam, Flexible Foam, Paints & Coatings, Adhesives & Sealants, Elastomers, Binders, Other Applications), and end-user industries (Building & Construction, Automotive, Healthcare, Furniture, Other End-use Industries), offers significant opportunities for targeted market penetration and strategic growth.
This in-depth report provides a comprehensive analysis of the global Isocyanates market, covering the period from 2019 to 2033. It offers valuable insights into market dynamics, competitive landscapes, and future growth prospects, making it an indispensable resource for industry stakeholders, investors, and strategic decision-makers. The report is based on extensive research, encompassing historical data (2019-2024), current market estimations (2025), and future projections (2025-2033). The total market value is projected to reach xx Billion by 2033.
Isocyanates Market Concentration & Innovation
The Isocyanates market exhibits a moderately concentrated structure, with key players holding significant market share. However, the presence of several smaller, specialized companies ensures a dynamic competitive landscape. Innovation is a crucial driver, particularly in developing sustainable and high-performance products. Stringent environmental regulations are pushing the industry towards greener manufacturing processes and the development of bio-based isocyanates. The market is witnessing significant M&A activity, with deal values reaching xx Billion in recent years. Key factors shaping the market include:
- Market Concentration: The top five players hold approximately xx% of the global market share.
- Innovation Drivers: Focus on sustainability (bio-based isocyanates), improved performance characteristics (e.g., higher thermal stability), and reduced environmental impact.
- Regulatory Frameworks: Stringent environmental regulations are driving innovation in sustainable isocyanate production. REACH regulations in Europe and similar regulations globally significantly influence market developments.
- Product Substitutes: While limited, alternative chemistries are emerging as potential substitutes in specific niche applications.
- End-User Trends: Growing demand from the construction, automotive, and furniture industries is a major driver.
- M&A Activities: Recent mergers and acquisitions have involved significant investments, reflecting the attractive growth potential of the Isocyanates market. Examples include [mention specific examples if data is available].
Isocyanates Market Industry Trends & Insights
The Isocyanates market is experiencing robust growth, driven by increasing demand from various end-use sectors. The CAGR during the forecast period (2025-2033) is projected to be xx%. Key trends shaping market growth include:
- Technological Disruptions: Advancements in production technologies are leading to improved efficiency and reduced costs. The development of bio-based isocyanates is creating new market opportunities.
- Consumer Preferences: Growing preference for energy-efficient and sustainable building materials is boosting demand for isocyanates in the construction industry. Demand for high-performance materials in automotive and other applications is also a significant factor.
- Competitive Dynamics: Intense competition among major players is driving innovation and price reductions. Strategic partnerships and collaborations are becoming increasingly common.
- Market Penetration: The market penetration rate of isocyanates in various applications is high in developed regions but exhibits significant growth potential in emerging economies.
Dominant Markets & Segments in Isocyanates Market
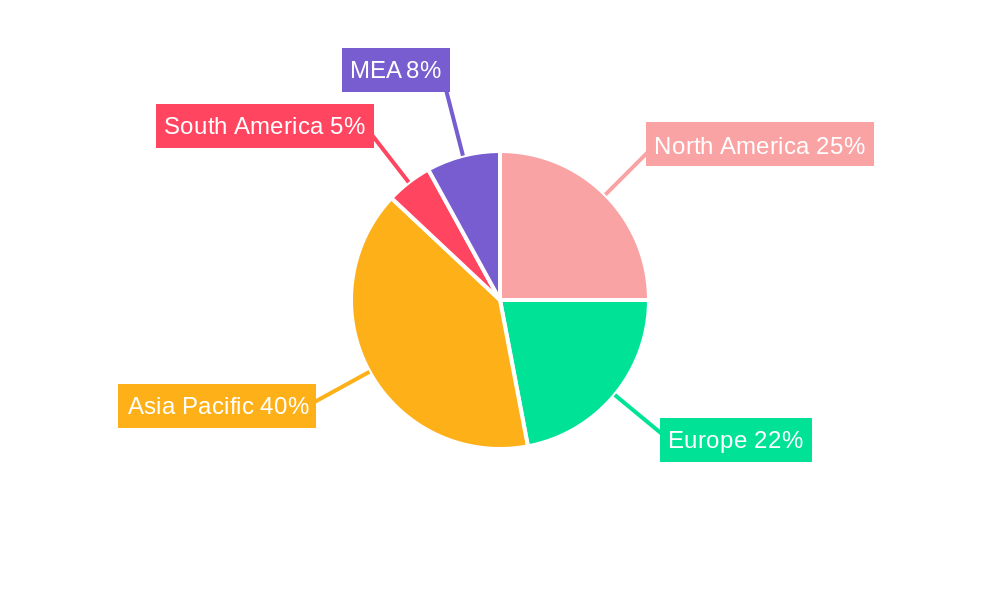
The Isocyanates market is geographically diverse, with significant contributions from various regions. Specific segment dominance is as follows:
- Type: MDI holds the largest market share, followed by TDI and aliphatic isocyanates. The “Others” category shows moderate growth driven by specialized applications. MDI's dominance is fueled by its extensive use in rigid polyurethane foams, a key application in the construction industry.
- Application: Rigid foam dominates the application segment due to its wide use in insulation and construction. Flexible foam is another major segment, driven by applications in furniture and bedding. Paints and coatings represent a significant and steadily growing application segment.
- End-user Industry: The building & construction sector is the largest end-user industry, followed by the automotive sector. Healthcare and furniture industries also show considerable demand. The “Other End-use Industries” segment is growing at a faster rate than other segments.
Key Drivers: Each dominant segment is driven by distinct factors. For instance, the construction industry's growth is boosted by infrastructure development and urbanization, while automotive demand is fueled by the increasing production of vehicles.
- Regional Dominance: [Insert region with the highest market share and its specific drivers, e.g., Asia-Pacific due to rapid industrialization and economic growth].
Isocyanates Market Product Developments
Recent product developments focus on sustainability and improved performance. BASF's introduction of Lupranat ZERO, a greenhouse gas-neutral aromatic isocyanate, exemplifies this trend. Other companies are also investing in the development of bio-based isocyanates and other high-performance variations to meet growing market demand for environmentally friendly and superior-performing materials. These innovations cater to the growing demand for high-performance and environmentally friendly materials.
Report Scope & Segmentation Analysis
This report segments the Isocyanates market by Type (MDI, TDI, Aliphatic, Others), Application (Rigid Foam, Flexible Foam, Paints & Coatings, Adhesives & Sealants, Elastomers, Binders, Other Applications), and End-user Industry (Building & Construction, Automotive, Healthcare, Furniture, Other End-use Industries). Each segment's market size, growth projections, and competitive dynamics are analyzed in detail. Growth rates vary across segments, with some showing higher potential than others. For example, the bio-based isocyanate segment is expected to exhibit rapid growth due to increasing environmental concerns.
Key Drivers of Isocyanates Market Growth
Key growth drivers include:
- Expanding Construction Sector: Rapid urbanization and infrastructure development are boosting demand.
- Automotive Industry Growth: Increasing vehicle production fuels demand for isocyanates in automotive parts.
- Technological Advancements: Innovations in isocyanate chemistry improve performance and create new applications.
- Growing Demand for Energy-Efficient Materials: Focus on sustainable and energy-efficient building materials is a significant driver.
Challenges in the Isocyanates Market Sector
Significant challenges include:
- Stringent Environmental Regulations: Compliance costs and limitations on production can affect profitability.
- Fluctuating Raw Material Prices: Dependence on raw materials impacts production costs and profitability.
- Health and Safety Concerns: Isocyanates are hazardous chemicals, requiring strict safety protocols and impacting operational costs.
- Intense Competition: A competitive market environment puts pressure on margins.
Emerging Opportunities in Isocyanates Market
Emerging opportunities include:
- Bio-based Isocyanates: Growing demand for sustainable alternatives opens up new market avenues.
- High-Performance Isocyanates: Development of specialized isocyanates for niche applications offers significant potential.
- Expansion into Emerging Markets: Untapped potential exists in developing economies.
- Strategic Partnerships & Collaborations: Joint ventures can facilitate innovation and market penetration.
Leading Players in the Isocyanates Market Market
- Kumho
- BorsodChem
- Korea Fine Chemical Co Ltd
- Asahi Kasei Chemicals
- Anderson Development Company
- China National Bluestar (Group) Co Ltd
- Kemipex
- Chemtura Corp
- BASF SE
- Yantai Sanjiang Chemical Industry Material Co Ltd
- Tosoh Corporation
- DowDuPont Inc
- Vencorex
- Covestro
- MITSUI CHEMICALS AMERICA INC
- Hebei Cangzhou Dahua Group
- Evonik Industries
- Perstorp
Key Developments in Isocyanates Market Industry
- July 2022: BASF announces USD 780 million investment to expand its MDI plant in Geismar, Louisiana, indicating significant capacity expansion plans.
- February 2022: BASF launches Lupranat ZERO, a greenhouse gas-neutral aromatic isocyanate, highlighting the industry's move towards sustainability.
Strategic Outlook for Isocyanates Market Market
The Isocyanates market is poised for continued growth, driven by robust demand from key end-use industries and ongoing innovations in product development. The focus on sustainability and the development of bio-based alternatives present significant opportunities. Strategic partnerships and investments in capacity expansion will be critical to capturing market share and meeting future demand. The market is expected to witness a sustained period of growth, fueled by both developed and emerging economies.
Isocyanates Market Segmentation
-
1. Type
- 1.1. MDI
- 1.2. TDI
- 1.3. Aliphatic
- 1.4. Other Types
-
2. Application
- 2.1. Rigid Foam
- 2.2. Flexible Foam
- 2.3. Paints & Coatings
- 2.4. Adhesives & Sealants
- 2.5. Elastomers
- 2.6. Binders
- 2.7. Other Applications
-
3. End-user Industry
- 3.1. Building and Construction
- 3.2. Automotive
- 3.3. Healthcare
- 3.4. Furniture
- 3.5. Other En
Isocyanates Market Segmentation By Geography
-
1. Asia Pacific
- 1.1. China
- 1.2. India
- 1.3. Japan
- 1.4. South Korea
- 1.5. Malaysia
- 1.6. Thailand
- 1.7. Indonesia
- 1.8. Vietnam
- 1.9. Rest of Asia Pacific
-
2. North America
- 2.1. United States
- 2.2. Canada
- 2.3. Mexico
-
3. Europe
- 3.1. Germany
- 3.2. United Kingdom
- 3.3. Italy
- 3.4. France
- 3.5. Russia
- 3.6. Spain
- 3.7. Turkey
- 3.8. Nordic Countries
- 3.9. Rest of Europe
-
4. South America
- 4.1. Brazil
- 4.2. Argentina
- 4.3. Colombia
- 4.4. Rest of South America
-
5. Middle East and Africa
- 5.1. Saudi Arabia
- 5.2. United Arab Emirates
- 5.3. Qatar
- 5.4. Egypt
- 5.5. Nigeria
- 5.6. South Africa
- 5.7. Rest of Middle East and Africa
Isocyanates Market REPORT HIGHLIGHTS
| Aspects | Details |
|---|---|
| Study Period | 2019-2033 |
| Base Year | 2024 |
| Estimated Year | 2025 |
| Forecast Period | 2025-2033 |
| Historical Period | 2019-2024 |
| Growth Rate | CAGR of 6.1% from 2019-2033 |
| Segmentation |
|
Table of Contents
- 1. Introduction
- 1.1. Research Scope
- 1.2. Market Segmentation
- 1.3. Research Methodology
- 1.4. Definitions and Assumptions
- 2. Executive Summary
- 2.1. Introduction
- 3. Market Dynamics
- 3.1. Introduction
- 3.2. Market Drivers
- 3.2.1. Huge Growth in the Polyurethane Foam Application; Increase in Industrialization Activities in Asia-Pacific; Increasing Demand from the Construction Industry
- 3.3. Market Restrains
- 3.3.1. Shortage and Increased Price of Raw Material; Hazardous in Nature
- 3.4. Market Trends
- 3.4.1. Building and Construction to Dominate the Market
- 4. Market Factor Analysis
- 4.1. Porters Five Forces
- 4.2. Supply/Value Chain
- 4.3. PESTEL analysis
- 4.4. Market Entropy
- 4.5. Patent/Trademark Analysis
- 5. Global Isocyanates Market Analysis, Insights and Forecast, 2019-2031
- 5.1. Market Analysis, Insights and Forecast - by Type
- 5.1.1. MDI
- 5.1.2. TDI
- 5.1.3. Aliphatic
- 5.1.4. Other Types
- 5.2. Market Analysis, Insights and Forecast - by Application
- 5.2.1. Rigid Foam
- 5.2.2. Flexible Foam
- 5.2.3. Paints & Coatings
- 5.2.4. Adhesives & Sealants
- 5.2.5. Elastomers
- 5.2.6. Binders
- 5.2.7. Other Applications
- 5.3. Market Analysis, Insights and Forecast - by End-user Industry
- 5.3.1. Building and Construction
- 5.3.2. Automotive
- 5.3.3. Healthcare
- 5.3.4. Furniture
- 5.3.5. Other En
- 5.4. Market Analysis, Insights and Forecast - by Region
- 5.4.1. Asia Pacific
- 5.4.2. North America
- 5.4.3. Europe
- 5.4.4. South America
- 5.4.5. Middle East and Africa
- 5.1. Market Analysis, Insights and Forecast - by Type
- 6. Asia Pacific Isocyanates Market Analysis, Insights and Forecast, 2019-2031
- 6.1. Market Analysis, Insights and Forecast - by Type
- 6.1.1. MDI
- 6.1.2. TDI
- 6.1.3. Aliphatic
- 6.1.4. Other Types
- 6.2. Market Analysis, Insights and Forecast - by Application
- 6.2.1. Rigid Foam
- 6.2.2. Flexible Foam
- 6.2.3. Paints & Coatings
- 6.2.4. Adhesives & Sealants
- 6.2.5. Elastomers
- 6.2.6. Binders
- 6.2.7. Other Applications
- 6.3. Market Analysis, Insights and Forecast - by End-user Industry
- 6.3.1. Building and Construction
- 6.3.2. Automotive
- 6.3.3. Healthcare
- 6.3.4. Furniture
- 6.3.5. Other En
- 6.1. Market Analysis, Insights and Forecast - by Type
- 7. North America Isocyanates Market Analysis, Insights and Forecast, 2019-2031
- 7.1. Market Analysis, Insights and Forecast - by Type
- 7.1.1. MDI
- 7.1.2. TDI
- 7.1.3. Aliphatic
- 7.1.4. Other Types
- 7.2. Market Analysis, Insights and Forecast - by Application
- 7.2.1. Rigid Foam
- 7.2.2. Flexible Foam
- 7.2.3. Paints & Coatings
- 7.2.4. Adhesives & Sealants
- 7.2.5. Elastomers
- 7.2.6. Binders
- 7.2.7. Other Applications
- 7.3. Market Analysis, Insights and Forecast - by End-user Industry
- 7.3.1. Building and Construction
- 7.3.2. Automotive
- 7.3.3. Healthcare
- 7.3.4. Furniture
- 7.3.5. Other En
- 7.1. Market Analysis, Insights and Forecast - by Type
- 8. Europe Isocyanates Market Analysis, Insights and Forecast, 2019-2031
- 8.1. Market Analysis, Insights and Forecast - by Type
- 8.1.1. MDI
- 8.1.2. TDI
- 8.1.3. Aliphatic
- 8.1.4. Other Types
- 8.2. Market Analysis, Insights and Forecast - by Application
- 8.2.1. Rigid Foam
- 8.2.2. Flexible Foam
- 8.2.3. Paints & Coatings
- 8.2.4. Adhesives & Sealants
- 8.2.5. Elastomers
- 8.2.6. Binders
- 8.2.7. Other Applications
- 8.3. Market Analysis, Insights and Forecast - by End-user Industry
- 8.3.1. Building and Construction
- 8.3.2. Automotive
- 8.3.3. Healthcare
- 8.3.4. Furniture
- 8.3.5. Other En
- 8.1. Market Analysis, Insights and Forecast - by Type
- 9. South America Isocyanates Market Analysis, Insights and Forecast, 2019-2031
- 9.1. Market Analysis, Insights and Forecast - by Type
- 9.1.1. MDI
- 9.1.2. TDI
- 9.1.3. Aliphatic
- 9.1.4. Other Types
- 9.2. Market Analysis, Insights and Forecast - by Application
- 9.2.1. Rigid Foam
- 9.2.2. Flexible Foam
- 9.2.3. Paints & Coatings
- 9.2.4. Adhesives & Sealants
- 9.2.5. Elastomers
- 9.2.6. Binders
- 9.2.7. Other Applications
- 9.3. Market Analysis, Insights and Forecast - by End-user Industry
- 9.3.1. Building and Construction
- 9.3.2. Automotive
- 9.3.3. Healthcare
- 9.3.4. Furniture
- 9.3.5. Other En
- 9.1. Market Analysis, Insights and Forecast - by Type
- 10. Middle East and Africa Isocyanates Market Analysis, Insights and Forecast, 2019-2031
- 10.1. Market Analysis, Insights and Forecast - by Type
- 10.1.1. MDI
- 10.1.2. TDI
- 10.1.3. Aliphatic
- 10.1.4. Other Types
- 10.2. Market Analysis, Insights and Forecast - by Application
- 10.2.1. Rigid Foam
- 10.2.2. Flexible Foam
- 10.2.3. Paints & Coatings
- 10.2.4. Adhesives & Sealants
- 10.2.5. Elastomers
- 10.2.6. Binders
- 10.2.7. Other Applications
- 10.3. Market Analysis, Insights and Forecast - by End-user Industry
- 10.3.1. Building and Construction
- 10.3.2. Automotive
- 10.3.3. Healthcare
- 10.3.4. Furniture
- 10.3.5. Other En
- 10.1. Market Analysis, Insights and Forecast - by Type
- 11. North America Isocyanates Market Analysis, Insights and Forecast, 2019-2031
- 11.1. Market Analysis, Insights and Forecast - By Country/Sub-region
- 11.1.1 United States
- 11.1.2 Canada
- 11.1.3 Mexico
- 12. Europe Isocyanates Market Analysis, Insights and Forecast, 2019-2031
- 12.1. Market Analysis, Insights and Forecast - By Country/Sub-region
- 12.1.1 Germany
- 12.1.2 France
- 12.1.3 Italy
- 12.1.4 United Kingdom
- 12.1.5 Netherlands
- 12.1.6 Rest of Europe
- 13. Asia Pacific Isocyanates Market Analysis, Insights and Forecast, 2019-2031
- 13.1. Market Analysis, Insights and Forecast - By Country/Sub-region
- 13.1.1 China
- 13.1.2 Japan
- 13.1.3 India
- 13.1.4 South Korea
- 13.1.5 Taiwan
- 13.1.6 Australia
- 13.1.7 Rest of Asia-Pacific
- 14. South America Isocyanates Market Analysis, Insights and Forecast, 2019-2031
- 14.1. Market Analysis, Insights and Forecast - By Country/Sub-region
- 14.1.1 Brazil
- 14.1.2 Argentina
- 14.1.3 Rest of South America
- 15. MEA Isocyanates Market Analysis, Insights and Forecast, 2019-2031
- 15.1. Market Analysis, Insights and Forecast - By Country/Sub-region
- 15.1.1 Middle East
- 15.1.2 Africa
- 16. Competitive Analysis
- 16.1. Global Market Share Analysis 2024
- 16.2. Company Profiles
- 16.2.1 Kumho
- 16.2.1.1. Overview
- 16.2.1.2. Products
- 16.2.1.3. SWOT Analysis
- 16.2.1.4. Recent Developments
- 16.2.1.5. Financials (Based on Availability)
- 16.2.2 BorsodChem
- 16.2.2.1. Overview
- 16.2.2.2. Products
- 16.2.2.3. SWOT Analysis
- 16.2.2.4. Recent Developments
- 16.2.2.5. Financials (Based on Availability)
- 16.2.3 Korea Fine Chemical Co Ltd
- 16.2.3.1. Overview
- 16.2.3.2. Products
- 16.2.3.3. SWOT Analysis
- 16.2.3.4. Recent Developments
- 16.2.3.5. Financials (Based on Availability)
- 16.2.4 Asahi Kasei Chemicals
- 16.2.4.1. Overview
- 16.2.4.2. Products
- 16.2.4.3. SWOT Analysis
- 16.2.4.4. Recent Developments
- 16.2.4.5. Financials (Based on Availability)
- 16.2.5 Anderson Development Company
- 16.2.5.1. Overview
- 16.2.5.2. Products
- 16.2.5.3. SWOT Analysis
- 16.2.5.4. Recent Developments
- 16.2.5.5. Financials (Based on Availability)
- 16.2.6 China National Bluestar (Group) Co Ltd
- 16.2.6.1. Overview
- 16.2.6.2. Products
- 16.2.6.3. SWOT Analysis
- 16.2.6.4. Recent Developments
- 16.2.6.5. Financials (Based on Availability)
- 16.2.7 Kemipex
- 16.2.7.1. Overview
- 16.2.7.2. Products
- 16.2.7.3. SWOT Analysis
- 16.2.7.4. Recent Developments
- 16.2.7.5. Financials (Based on Availability)
- 16.2.8 Chemtura Corp
- 16.2.8.1. Overview
- 16.2.8.2. Products
- 16.2.8.3. SWOT Analysis
- 16.2.8.4. Recent Developments
- 16.2.8.5. Financials (Based on Availability)
- 16.2.9 BASF SE
- 16.2.9.1. Overview
- 16.2.9.2. Products
- 16.2.9.3. SWOT Analysis
- 16.2.9.4. Recent Developments
- 16.2.9.5. Financials (Based on Availability)
- 16.2.10 Yantai Sanjiang Chemical Industry Material Co Ltd
- 16.2.10.1. Overview
- 16.2.10.2. Products
- 16.2.10.3. SWOT Analysis
- 16.2.10.4. Recent Developments
- 16.2.10.5. Financials (Based on Availability)
- 16.2.11 Tosoh Corporation
- 16.2.11.1. Overview
- 16.2.11.2. Products
- 16.2.11.3. SWOT Analysis
- 16.2.11.4. Recent Developments
- 16.2.11.5. Financials (Based on Availability)
- 16.2.12 DowDuPont Inc
- 16.2.12.1. Overview
- 16.2.12.2. Products
- 16.2.12.3. SWOT Analysis
- 16.2.12.4. Recent Developments
- 16.2.12.5. Financials (Based on Availability)
- 16.2.13 Vencorex
- 16.2.13.1. Overview
- 16.2.13.2. Products
- 16.2.13.3. SWOT Analysis
- 16.2.13.4. Recent Developments
- 16.2.13.5. Financials (Based on Availability)
- 16.2.14 Covestro
- 16.2.14.1. Overview
- 16.2.14.2. Products
- 16.2.14.3. SWOT Analysis
- 16.2.14.4. Recent Developments
- 16.2.14.5. Financials (Based on Availability)
- 16.2.15 MITSUI CHEMICALS AMERICA INC
- 16.2.15.1. Overview
- 16.2.15.2. Products
- 16.2.15.3. SWOT Analysis
- 16.2.15.4. Recent Developments
- 16.2.15.5. Financials (Based on Availability)
- 16.2.16 Hebei Cangzhou Dahua Group
- 16.2.16.1. Overview
- 16.2.16.2. Products
- 16.2.16.3. SWOT Analysis
- 16.2.16.4. Recent Developments
- 16.2.16.5. Financials (Based on Availability)
- 16.2.17 Evonik Industries
- 16.2.17.1. Overview
- 16.2.17.2. Products
- 16.2.17.3. SWOT Analysis
- 16.2.17.4. Recent Developments
- 16.2.17.5. Financials (Based on Availability)
- 16.2.18 Perstorp
- 16.2.18.1. Overview
- 16.2.18.2. Products
- 16.2.18.3. SWOT Analysis
- 16.2.18.4. Recent Developments
- 16.2.18.5. Financials (Based on Availability)
- 16.2.1 Kumho
List of Figures
- Figure 1: Global Isocyanates Market Revenue Breakdown (Billion, %) by Region 2024 & 2032
- Figure 2: Global Isocyanates Market Volume Breakdown (K Tons, %) by Region 2024 & 2032
- Figure 3: North America Isocyanates Market Revenue (Billion), by Country 2024 & 2032
- Figure 4: North America Isocyanates Market Volume (K Tons), by Country 2024 & 2032
- Figure 5: North America Isocyanates Market Revenue Share (%), by Country 2024 & 2032
- Figure 6: North America Isocyanates Market Volume Share (%), by Country 2024 & 2032
- Figure 7: Europe Isocyanates Market Revenue (Billion), by Country 2024 & 2032
- Figure 8: Europe Isocyanates Market Volume (K Tons), by Country 2024 & 2032
- Figure 9: Europe Isocyanates Market Revenue Share (%), by Country 2024 & 2032
- Figure 10: Europe Isocyanates Market Volume Share (%), by Country 2024 & 2032
- Figure 11: Asia Pacific Isocyanates Market Revenue (Billion), by Country 2024 & 2032
- Figure 12: Asia Pacific Isocyanates Market Volume (K Tons), by Country 2024 & 2032
- Figure 13: Asia Pacific Isocyanates Market Revenue Share (%), by Country 2024 & 2032
- Figure 14: Asia Pacific Isocyanates Market Volume Share (%), by Country 2024 & 2032
- Figure 15: South America Isocyanates Market Revenue (Billion), by Country 2024 & 2032
- Figure 16: South America Isocyanates Market Volume (K Tons), by Country 2024 & 2032
- Figure 17: South America Isocyanates Market Revenue Share (%), by Country 2024 & 2032
- Figure 18: South America Isocyanates Market Volume Share (%), by Country 2024 & 2032
- Figure 19: MEA Isocyanates Market Revenue (Billion), by Country 2024 & 2032
- Figure 20: MEA Isocyanates Market Volume (K Tons), by Country 2024 & 2032
- Figure 21: MEA Isocyanates Market Revenue Share (%), by Country 2024 & 2032
- Figure 22: MEA Isocyanates Market Volume Share (%), by Country 2024 & 2032
- Figure 23: Asia Pacific Isocyanates Market Revenue (Billion), by Type 2024 & 2032
- Figure 24: Asia Pacific Isocyanates Market Volume (K Tons), by Type 2024 & 2032
- Figure 25: Asia Pacific Isocyanates Market Revenue Share (%), by Type 2024 & 2032
- Figure 26: Asia Pacific Isocyanates Market Volume Share (%), by Type 2024 & 2032
- Figure 27: Asia Pacific Isocyanates Market Revenue (Billion), by Application 2024 & 2032
- Figure 28: Asia Pacific Isocyanates Market Volume (K Tons), by Application 2024 & 2032
- Figure 29: Asia Pacific Isocyanates Market Revenue Share (%), by Application 2024 & 2032
- Figure 30: Asia Pacific Isocyanates Market Volume Share (%), by Application 2024 & 2032
- Figure 31: Asia Pacific Isocyanates Market Revenue (Billion), by End-user Industry 2024 & 2032
- Figure 32: Asia Pacific Isocyanates Market Volume (K Tons), by End-user Industry 2024 & 2032
- Figure 33: Asia Pacific Isocyanates Market Revenue Share (%), by End-user Industry 2024 & 2032
- Figure 34: Asia Pacific Isocyanates Market Volume Share (%), by End-user Industry 2024 & 2032
- Figure 35: Asia Pacific Isocyanates Market Revenue (Billion), by Country 2024 & 2032
- Figure 36: Asia Pacific Isocyanates Market Volume (K Tons), by Country 2024 & 2032
- Figure 37: Asia Pacific Isocyanates Market Revenue Share (%), by Country 2024 & 2032
- Figure 38: Asia Pacific Isocyanates Market Volume Share (%), by Country 2024 & 2032
- Figure 39: North America Isocyanates Market Revenue (Billion), by Type 2024 & 2032
- Figure 40: North America Isocyanates Market Volume (K Tons), by Type 2024 & 2032
- Figure 41: North America Isocyanates Market Revenue Share (%), by Type 2024 & 2032
- Figure 42: North America Isocyanates Market Volume Share (%), by Type 2024 & 2032
- Figure 43: North America Isocyanates Market Revenue (Billion), by Application 2024 & 2032
- Figure 44: North America Isocyanates Market Volume (K Tons), by Application 2024 & 2032
- Figure 45: North America Isocyanates Market Revenue Share (%), by Application 2024 & 2032
- Figure 46: North America Isocyanates Market Volume Share (%), by Application 2024 & 2032
- Figure 47: North America Isocyanates Market Revenue (Billion), by End-user Industry 2024 & 2032
- Figure 48: North America Isocyanates Market Volume (K Tons), by End-user Industry 2024 & 2032
- Figure 49: North America Isocyanates Market Revenue Share (%), by End-user Industry 2024 & 2032
- Figure 50: North America Isocyanates Market Volume Share (%), by End-user Industry 2024 & 2032
- Figure 51: North America Isocyanates Market Revenue (Billion), by Country 2024 & 2032
- Figure 52: North America Isocyanates Market Volume (K Tons), by Country 2024 & 2032
- Figure 53: North America Isocyanates Market Revenue Share (%), by Country 2024 & 2032
- Figure 54: North America Isocyanates Market Volume Share (%), by Country 2024 & 2032
- Figure 55: Europe Isocyanates Market Revenue (Billion), by Type 2024 & 2032
- Figure 56: Europe Isocyanates Market Volume (K Tons), by Type 2024 & 2032
- Figure 57: Europe Isocyanates Market Revenue Share (%), by Type 2024 & 2032
- Figure 58: Europe Isocyanates Market Volume Share (%), by Type 2024 & 2032
- Figure 59: Europe Isocyanates Market Revenue (Billion), by Application 2024 & 2032
- Figure 60: Europe Isocyanates Market Volume (K Tons), by Application 2024 & 2032
- Figure 61: Europe Isocyanates Market Revenue Share (%), by Application 2024 & 2032
- Figure 62: Europe Isocyanates Market Volume Share (%), by Application 2024 & 2032
- Figure 63: Europe Isocyanates Market Revenue (Billion), by End-user Industry 2024 & 2032
- Figure 64: Europe Isocyanates Market Volume (K Tons), by End-user Industry 2024 & 2032
- Figure 65: Europe Isocyanates Market Revenue Share (%), by End-user Industry 2024 & 2032
- Figure 66: Europe Isocyanates Market Volume Share (%), by End-user Industry 2024 & 2032
- Figure 67: Europe Isocyanates Market Revenue (Billion), by Country 2024 & 2032
- Figure 68: Europe Isocyanates Market Volume (K Tons), by Country 2024 & 2032
- Figure 69: Europe Isocyanates Market Revenue Share (%), by Country 2024 & 2032
- Figure 70: Europe Isocyanates Market Volume Share (%), by Country 2024 & 2032
- Figure 71: South America Isocyanates Market Revenue (Billion), by Type 2024 & 2032
- Figure 72: South America Isocyanates Market Volume (K Tons), by Type 2024 & 2032
- Figure 73: South America Isocyanates Market Revenue Share (%), by Type 2024 & 2032
- Figure 74: South America Isocyanates Market Volume Share (%), by Type 2024 & 2032
- Figure 75: South America Isocyanates Market Revenue (Billion), by Application 2024 & 2032
- Figure 76: South America Isocyanates Market Volume (K Tons), by Application 2024 & 2032
- Figure 77: South America Isocyanates Market Revenue Share (%), by Application 2024 & 2032
- Figure 78: South America Isocyanates Market Volume Share (%), by Application 2024 & 2032
- Figure 79: South America Isocyanates Market Revenue (Billion), by End-user Industry 2024 & 2032
- Figure 80: South America Isocyanates Market Volume (K Tons), by End-user Industry 2024 & 2032
- Figure 81: South America Isocyanates Market Revenue Share (%), by End-user Industry 2024 & 2032
- Figure 82: South America Isocyanates Market Volume Share (%), by End-user Industry 2024 & 2032
- Figure 83: South America Isocyanates Market Revenue (Billion), by Country 2024 & 2032
- Figure 84: South America Isocyanates Market Volume (K Tons), by Country 2024 & 2032
- Figure 85: South America Isocyanates Market Revenue Share (%), by Country 2024 & 2032
- Figure 86: South America Isocyanates Market Volume Share (%), by Country 2024 & 2032
- Figure 87: Middle East and Africa Isocyanates Market Revenue (Billion), by Type 2024 & 2032
- Figure 88: Middle East and Africa Isocyanates Market Volume (K Tons), by Type 2024 & 2032
- Figure 89: Middle East and Africa Isocyanates Market Revenue Share (%), by Type 2024 & 2032
- Figure 90: Middle East and Africa Isocyanates Market Volume Share (%), by Type 2024 & 2032
- Figure 91: Middle East and Africa Isocyanates Market Revenue (Billion), by Application 2024 & 2032
- Figure 92: Middle East and Africa Isocyanates Market Volume (K Tons), by Application 2024 & 2032
- Figure 93: Middle East and Africa Isocyanates Market Revenue Share (%), by Application 2024 & 2032
- Figure 94: Middle East and Africa Isocyanates Market Volume Share (%), by Application 2024 & 2032
- Figure 95: Middle East and Africa Isocyanates Market Revenue (Billion), by End-user Industry 2024 & 2032
- Figure 96: Middle East and Africa Isocyanates Market Volume (K Tons), by End-user Industry 2024 & 2032
- Figure 97: Middle East and Africa Isocyanates Market Revenue Share (%), by End-user Industry 2024 & 2032
- Figure 98: Middle East and Africa Isocyanates Market Volume Share (%), by End-user Industry 2024 & 2032
- Figure 99: Middle East and Africa Isocyanates Market Revenue (Billion), by Country 2024 & 2032
- Figure 100: Middle East and Africa Isocyanates Market Volume (K Tons), by Country 2024 & 2032
- Figure 101: Middle East and Africa Isocyanates Market Revenue Share (%), by Country 2024 & 2032
- Figure 102: Middle East and Africa Isocyanates Market Volume Share (%), by Country 2024 & 2032
List of Tables
- Table 1: Global Isocyanates Market Revenue Billion Forecast, by Region 2019 & 2032
- Table 2: Global Isocyanates Market Volume K Tons Forecast, by Region 2019 & 2032
- Table 3: Global Isocyanates Market Revenue Billion Forecast, by Type 2019 & 2032
- Table 4: Global Isocyanates Market Volume K Tons Forecast, by Type 2019 & 2032
- Table 5: Global Isocyanates Market Revenue Billion Forecast, by Application 2019 & 2032
- Table 6: Global Isocyanates Market Volume K Tons Forecast, by Application 2019 & 2032
- Table 7: Global Isocyanates Market Revenue Billion Forecast, by End-user Industry 2019 & 2032
- Table 8: Global Isocyanates Market Volume K Tons Forecast, by End-user Industry 2019 & 2032
- Table 9: Global Isocyanates Market Revenue Billion Forecast, by Region 2019 & 2032
- Table 10: Global Isocyanates Market Volume K Tons Forecast, by Region 2019 & 2032
- Table 11: Global Isocyanates Market Revenue Billion Forecast, by Country 2019 & 2032
- Table 12: Global Isocyanates Market Volume K Tons Forecast, by Country 2019 & 2032
- Table 13: United States Isocyanates Market Revenue (Billion) Forecast, by Application 2019 & 2032
- Table 14: United States Isocyanates Market Volume (K Tons) Forecast, by Application 2019 & 2032
- Table 15: Canada Isocyanates Market Revenue (Billion) Forecast, by Application 2019 & 2032
- Table 16: Canada Isocyanates Market Volume (K Tons) Forecast, by Application 2019 & 2032
- Table 17: Mexico Isocyanates Market Revenue (Billion) Forecast, by Application 2019 & 2032
- Table 18: Mexico Isocyanates Market Volume (K Tons) Forecast, by Application 2019 & 2032
- Table 19: Global Isocyanates Market Revenue Billion Forecast, by Country 2019 & 2032
- Table 20: Global Isocyanates Market Volume K Tons Forecast, by Country 2019 & 2032
- Table 21: Germany Isocyanates Market Revenue (Billion) Forecast, by Application 2019 & 2032
- Table 22: Germany Isocyanates Market Volume (K Tons) Forecast, by Application 2019 & 2032
- Table 23: France Isocyanates Market Revenue (Billion) Forecast, by Application 2019 & 2032
- Table 24: France Isocyanates Market Volume (K Tons) Forecast, by Application 2019 & 2032
- Table 25: Italy Isocyanates Market Revenue (Billion) Forecast, by Application 2019 & 2032
- Table 26: Italy Isocyanates Market Volume (K Tons) Forecast, by Application 2019 & 2032
- Table 27: United Kingdom Isocyanates Market Revenue (Billion) Forecast, by Application 2019 & 2032
- Table 28: United Kingdom Isocyanates Market Volume (K Tons) Forecast, by Application 2019 & 2032
- Table 29: Netherlands Isocyanates Market Revenue (Billion) Forecast, by Application 2019 & 2032
- Table 30: Netherlands Isocyanates Market Volume (K Tons) Forecast, by Application 2019 & 2032
- Table 31: Rest of Europe Isocyanates Market Revenue (Billion) Forecast, by Application 2019 & 2032
- Table 32: Rest of Europe Isocyanates Market Volume (K Tons) Forecast, by Application 2019 & 2032
- Table 33: Global Isocyanates Market Revenue Billion Forecast, by Country 2019 & 2032
- Table 34: Global Isocyanates Market Volume K Tons Forecast, by Country 2019 & 2032
- Table 35: China Isocyanates Market Revenue (Billion) Forecast, by Application 2019 & 2032
- Table 36: China Isocyanates Market Volume (K Tons) Forecast, by Application 2019 & 2032
- Table 37: Japan Isocyanates Market Revenue (Billion) Forecast, by Application 2019 & 2032
- Table 38: Japan Isocyanates Market Volume (K Tons) Forecast, by Application 2019 & 2032
- Table 39: India Isocyanates Market Revenue (Billion) Forecast, by Application 2019 & 2032
- Table 40: India Isocyanates Market Volume (K Tons) Forecast, by Application 2019 & 2032
- Table 41: South Korea Isocyanates Market Revenue (Billion) Forecast, by Application 2019 & 2032
- Table 42: South Korea Isocyanates Market Volume (K Tons) Forecast, by Application 2019 & 2032
- Table 43: Taiwan Isocyanates Market Revenue (Billion) Forecast, by Application 2019 & 2032
- Table 44: Taiwan Isocyanates Market Volume (K Tons) Forecast, by Application 2019 & 2032
- Table 45: Australia Isocyanates Market Revenue (Billion) Forecast, by Application 2019 & 2032
- Table 46: Australia Isocyanates Market Volume (K Tons) Forecast, by Application 2019 & 2032
- Table 47: Rest of Asia-Pacific Isocyanates Market Revenue (Billion) Forecast, by Application 2019 & 2032
- Table 48: Rest of Asia-Pacific Isocyanates Market Volume (K Tons) Forecast, by Application 2019 & 2032
- Table 49: Global Isocyanates Market Revenue Billion Forecast, by Country 2019 & 2032
- Table 50: Global Isocyanates Market Volume K Tons Forecast, by Country 2019 & 2032
- Table 51: Brazil Isocyanates Market Revenue (Billion) Forecast, by Application 2019 & 2032
- Table 52: Brazil Isocyanates Market Volume (K Tons) Forecast, by Application 2019 & 2032
- Table 53: Argentina Isocyanates Market Revenue (Billion) Forecast, by Application 2019 & 2032
- Table 54: Argentina Isocyanates Market Volume (K Tons) Forecast, by Application 2019 & 2032
- Table 55: Rest of South America Isocyanates Market Revenue (Billion) Forecast, by Application 2019 & 2032
- Table 56: Rest of South America Isocyanates Market Volume (K Tons) Forecast, by Application 2019 & 2032
- Table 57: Global Isocyanates Market Revenue Billion Forecast, by Country 2019 & 2032
- Table 58: Global Isocyanates Market Volume K Tons Forecast, by Country 2019 & 2032
- Table 59: Middle East Isocyanates Market Revenue (Billion) Forecast, by Application 2019 & 2032
- Table 60: Middle East Isocyanates Market Volume (K Tons) Forecast, by Application 2019 & 2032
- Table 61: Africa Isocyanates Market Revenue (Billion) Forecast, by Application 2019 & 2032
- Table 62: Africa Isocyanates Market Volume (K Tons) Forecast, by Application 2019 & 2032
- Table 63: Global Isocyanates Market Revenue Billion Forecast, by Type 2019 & 2032
- Table 64: Global Isocyanates Market Volume K Tons Forecast, by Type 2019 & 2032
- Table 65: Global Isocyanates Market Revenue Billion Forecast, by Application 2019 & 2032
- Table 66: Global Isocyanates Market Volume K Tons Forecast, by Application 2019 & 2032
- Table 67: Global Isocyanates Market Revenue Billion Forecast, by End-user Industry 2019 & 2032
- Table 68: Global Isocyanates Market Volume K Tons Forecast, by End-user Industry 2019 & 2032
- Table 69: Global Isocyanates Market Revenue Billion Forecast, by Country 2019 & 2032
- Table 70: Global Isocyanates Market Volume K Tons Forecast, by Country 2019 & 2032
- Table 71: China Isocyanates Market Revenue (Billion) Forecast, by Application 2019 & 2032
- Table 72: China Isocyanates Market Volume (K Tons) Forecast, by Application 2019 & 2032
- Table 73: India Isocyanates Market Revenue (Billion) Forecast, by Application 2019 & 2032
- Table 74: India Isocyanates Market Volume (K Tons) Forecast, by Application 2019 & 2032
- Table 75: Japan Isocyanates Market Revenue (Billion) Forecast, by Application 2019 & 2032
- Table 76: Japan Isocyanates Market Volume (K Tons) Forecast, by Application 2019 & 2032
- Table 77: South Korea Isocyanates Market Revenue (Billion) Forecast, by Application 2019 & 2032
- Table 78: South Korea Isocyanates Market Volume (K Tons) Forecast, by Application 2019 & 2032
- Table 79: Malaysia Isocyanates Market Revenue (Billion) Forecast, by Application 2019 & 2032
- Table 80: Malaysia Isocyanates Market Volume (K Tons) Forecast, by Application 2019 & 2032
- Table 81: Thailand Isocyanates Market Revenue (Billion) Forecast, by Application 2019 & 2032
- Table 82: Thailand Isocyanates Market Volume (K Tons) Forecast, by Application 2019 & 2032
- Table 83: Indonesia Isocyanates Market Revenue (Billion) Forecast, by Application 2019 & 2032
- Table 84: Indonesia Isocyanates Market Volume (K Tons) Forecast, by Application 2019 & 2032
- Table 85: Vietnam Isocyanates Market Revenue (Billion) Forecast, by Application 2019 & 2032
- Table 86: Vietnam Isocyanates Market Volume (K Tons) Forecast, by Application 2019 & 2032
- Table 87: Rest of Asia Pacific Isocyanates Market Revenue (Billion) Forecast, by Application 2019 & 2032
- Table 88: Rest of Asia Pacific Isocyanates Market Volume (K Tons) Forecast, by Application 2019 & 2032
- Table 89: Global Isocyanates Market Revenue Billion Forecast, by Type 2019 & 2032
- Table 90: Global Isocyanates Market Volume K Tons Forecast, by Type 2019 & 2032
- Table 91: Global Isocyanates Market Revenue Billion Forecast, by Application 2019 & 2032
- Table 92: Global Isocyanates Market Volume K Tons Forecast, by Application 2019 & 2032
- Table 93: Global Isocyanates Market Revenue Billion Forecast, by End-user Industry 2019 & 2032
- Table 94: Global Isocyanates Market Volume K Tons Forecast, by End-user Industry 2019 & 2032
- Table 95: Global Isocyanates Market Revenue Billion Forecast, by Country 2019 & 2032
- Table 96: Global Isocyanates Market Volume K Tons Forecast, by Country 2019 & 2032
- Table 97: United States Isocyanates Market Revenue (Billion) Forecast, by Application 2019 & 2032
- Table 98: United States Isocyanates Market Volume (K Tons) Forecast, by Application 2019 & 2032
- Table 99: Canada Isocyanates Market Revenue (Billion) Forecast, by Application 2019 & 2032
- Table 100: Canada Isocyanates Market Volume (K Tons) Forecast, by Application 2019 & 2032
- Table 101: Mexico Isocyanates Market Revenue (Billion) Forecast, by Application 2019 & 2032
- Table 102: Mexico Isocyanates Market Volume (K Tons) Forecast, by Application 2019 & 2032
- Table 103: Global Isocyanates Market Revenue Billion Forecast, by Type 2019 & 2032
- Table 104: Global Isocyanates Market Volume K Tons Forecast, by Type 2019 & 2032
- Table 105: Global Isocyanates Market Revenue Billion Forecast, by Application 2019 & 2032
- Table 106: Global Isocyanates Market Volume K Tons Forecast, by Application 2019 & 2032
- Table 107: Global Isocyanates Market Revenue Billion Forecast, by End-user Industry 2019 & 2032
- Table 108: Global Isocyanates Market Volume K Tons Forecast, by End-user Industry 2019 & 2032
- Table 109: Global Isocyanates Market Revenue Billion Forecast, by Country 2019 & 2032
- Table 110: Global Isocyanates Market Volume K Tons Forecast, by Country 2019 & 2032
- Table 111: Germany Isocyanates Market Revenue (Billion) Forecast, by Application 2019 & 2032
- Table 112: Germany Isocyanates Market Volume (K Tons) Forecast, by Application 2019 & 2032
- Table 113: United Kingdom Isocyanates Market Revenue (Billion) Forecast, by Application 2019 & 2032
- Table 114: United Kingdom Isocyanates Market Volume (K Tons) Forecast, by Application 2019 & 2032
- Table 115: Italy Isocyanates Market Revenue (Billion) Forecast, by Application 2019 & 2032
- Table 116: Italy Isocyanates Market Volume (K Tons) Forecast, by Application 2019 & 2032
- Table 117: France Isocyanates Market Revenue (Billion) Forecast, by Application 2019 & 2032
- Table 118: France Isocyanates Market Volume (K Tons) Forecast, by Application 2019 & 2032
- Table 119: Russia Isocyanates Market Revenue (Billion) Forecast, by Application 2019 & 2032
- Table 120: Russia Isocyanates Market Volume (K Tons) Forecast, by Application 2019 & 2032
- Table 121: Spain Isocyanates Market Revenue (Billion) Forecast, by Application 2019 & 2032
- Table 122: Spain Isocyanates Market Volume (K Tons) Forecast, by Application 2019 & 2032
- Table 123: Turkey Isocyanates Market Revenue (Billion) Forecast, by Application 2019 & 2032
- Table 124: Turkey Isocyanates Market Volume (K Tons) Forecast, by Application 2019 & 2032
- Table 125: Nordic Countries Isocyanates Market Revenue (Billion) Forecast, by Application 2019 & 2032
- Table 126: Nordic Countries Isocyanates Market Volume (K Tons) Forecast, by Application 2019 & 2032
- Table 127: Rest of Europe Isocyanates Market Revenue (Billion) Forecast, by Application 2019 & 2032
- Table 128: Rest of Europe Isocyanates Market Volume (K Tons) Forecast, by Application 2019 & 2032
- Table 129: Global Isocyanates Market Revenue Billion Forecast, by Type 2019 & 2032
- Table 130: Global Isocyanates Market Volume K Tons Forecast, by Type 2019 & 2032
- Table 131: Global Isocyanates Market Revenue Billion Forecast, by Application 2019 & 2032
- Table 132: Global Isocyanates Market Volume K Tons Forecast, by Application 2019 & 2032
- Table 133: Global Isocyanates Market Revenue Billion Forecast, by End-user Industry 2019 & 2032
- Table 134: Global Isocyanates Market Volume K Tons Forecast, by End-user Industry 2019 & 2032
- Table 135: Global Isocyanates Market Revenue Billion Forecast, by Country 2019 & 2032
- Table 136: Global Isocyanates Market Volume K Tons Forecast, by Country 2019 & 2032
- Table 137: Brazil Isocyanates Market Revenue (Billion) Forecast, by Application 2019 & 2032
- Table 138: Brazil Isocyanates Market Volume (K Tons) Forecast, by Application 2019 & 2032
- Table 139: Argentina Isocyanates Market Revenue (Billion) Forecast, by Application 2019 & 2032
- Table 140: Argentina Isocyanates Market Volume (K Tons) Forecast, by Application 2019 & 2032
- Table 141: Colombia Isocyanates Market Revenue (Billion) Forecast, by Application 2019 & 2032
- Table 142: Colombia Isocyanates Market Volume (K Tons) Forecast, by Application 2019 & 2032
- Table 143: Rest of South America Isocyanates Market Revenue (Billion) Forecast, by Application 2019 & 2032
- Table 144: Rest of South America Isocyanates Market Volume (K Tons) Forecast, by Application 2019 & 2032
- Table 145: Global Isocyanates Market Revenue Billion Forecast, by Type 2019 & 2032
- Table 146: Global Isocyanates Market Volume K Tons Forecast, by Type 2019 & 2032
- Table 147: Global Isocyanates Market Revenue Billion Forecast, by Application 2019 & 2032
- Table 148: Global Isocyanates Market Volume K Tons Forecast, by Application 2019 & 2032
- Table 149: Global Isocyanates Market Revenue Billion Forecast, by End-user Industry 2019 & 2032
- Table 150: Global Isocyanates Market Volume K Tons Forecast, by End-user Industry 2019 & 2032
- Table 151: Global Isocyanates Market Revenue Billion Forecast, by Country 2019 & 2032
- Table 152: Global Isocyanates Market Volume K Tons Forecast, by Country 2019 & 2032
- Table 153: Saudi Arabia Isocyanates Market Revenue (Billion) Forecast, by Application 2019 & 2032
- Table 154: Saudi Arabia Isocyanates Market Volume (K Tons) Forecast, by Application 2019 & 2032
- Table 155: United Arab Emirates Isocyanates Market Revenue (Billion) Forecast, by Application 2019 & 2032
- Table 156: United Arab Emirates Isocyanates Market Volume (K Tons) Forecast, by Application 2019 & 2032
- Table 157: Qatar Isocyanates Market Revenue (Billion) Forecast, by Application 2019 & 2032
- Table 158: Qatar Isocyanates Market Volume (K Tons) Forecast, by Application 2019 & 2032
- Table 159: Egypt Isocyanates Market Revenue (Billion) Forecast, by Application 2019 & 2032
- Table 160: Egypt Isocyanates Market Volume (K Tons) Forecast, by Application 2019 & 2032
- Table 161: Nigeria Isocyanates Market Revenue (Billion) Forecast, by Application 2019 & 2032
- Table 162: Nigeria Isocyanates Market Volume (K Tons) Forecast, by Application 2019 & 2032
- Table 163: South Africa Isocyanates Market Revenue (Billion) Forecast, by Application 2019 & 2032
- Table 164: South Africa Isocyanates Market Volume (K Tons) Forecast, by Application 2019 & 2032
- Table 165: Rest of Middle East and Africa Isocyanates Market Revenue (Billion) Forecast, by Application 2019 & 2032
- Table 166: Rest of Middle East and Africa Isocyanates Market Volume (K Tons) Forecast, by Application 2019 & 2032
Frequently Asked Questions
1. What is the projected Compound Annual Growth Rate (CAGR) of the Isocyanates Market?
The projected CAGR is approximately 6.1%.
2. Which companies are prominent players in the Isocyanates Market?
Key companies in the market include Kumho, BorsodChem, Korea Fine Chemical Co Ltd, Asahi Kasei Chemicals, Anderson Development Company, China National Bluestar (Group) Co Ltd, Kemipex, Chemtura Corp, BASF SE, Yantai Sanjiang Chemical Industry Material Co Ltd, Tosoh Corporation, DowDuPont Inc, Vencorex, Covestro, MITSUI CHEMICALS AMERICA INC, Hebei Cangzhou Dahua Group, Evonik Industries, Perstorp.
3. What are the main segments of the Isocyanates Market?
The market segments include Type, Application, End-user Industry.
4. Can you provide details about the market size?
The market size is estimated to be USD 31.4 Billion as of 2022.
5. What are some drivers contributing to market growth?
Huge Growth in the Polyurethane Foam Application; Increase in Industrialization Activities in Asia-Pacific; Increasing Demand from the Construction Industry.
6. What are the notable trends driving market growth?
Building and Construction to Dominate the Market.
7. Are there any restraints impacting market growth?
Shortage and Increased Price of Raw Material; Hazardous in Nature.
8. Can you provide examples of recent developments in the market?
July 2022: BASF is moving forward with the final phase of the expansion project for the methylene diphenyl diisocyanate (MDI) plant at its Verbund site in Geismar, Louisiana. The company started the expansion project in 2018 with a staggered approach consisting of three investment phases. The investment in the final expansion phase from 2022 to 2025 amounts to USD 780 million.
9. What pricing options are available for accessing the report?
Pricing options include single-user, multi-user, and enterprise licenses priced at USD 4750, USD 5250, and USD 8750 respectively.
10. Is the market size provided in terms of value or volume?
The market size is provided in terms of value, measured in Billion and volume, measured in K Tons.
11. Are there any specific market keywords associated with the report?
Yes, the market keyword associated with the report is "Isocyanates Market," which aids in identifying and referencing the specific market segment covered.
12. How do I determine which pricing option suits my needs best?
The pricing options vary based on user requirements and access needs. Individual users may opt for single-user licenses, while businesses requiring broader access may choose multi-user or enterprise licenses for cost-effective access to the report.
13. Are there any additional resources or data provided in the Isocyanates Market report?
While the report offers comprehensive insights, it's advisable to review the specific contents or supplementary materials provided to ascertain if additional resources or data are available.
14. How can I stay updated on further developments or reports in the Isocyanates Market?
To stay informed about further developments, trends, and reports in the Isocyanates Market, consider subscribing to industry newsletters, following relevant companies and organizations, or regularly checking reputable industry news sources and publications.
Methodology
Step 1 - Identification of Relevant Samples Size from Population Database


Step 2 - Approaches for Defining Global Market Size (Value, Volume* & Price*)

Note*: In applicable scenarios
Step 3 - Data Sources
Primary Research
- Web Analytics
- Survey Reports
- Research Institute
- Latest Research Reports
- Opinion Leaders
Secondary Research
- Annual Reports
- White Paper
- Latest Press Release
- Industry Association
- Paid Database
- Investor Presentations

Step 4 - Data Triangulation
Involves using different sources of information in order to increase the validity of a study
These sources are likely to be stakeholders in a program - participants, other researchers, program staff, other community members, and so on.
Then we put all data in single framework & apply various statistical tools to find out the dynamic on the market.
During the analysis stage, feedback from the stakeholder groups would be compared to determine areas of agreement as well as areas of divergence


