
Key Insights
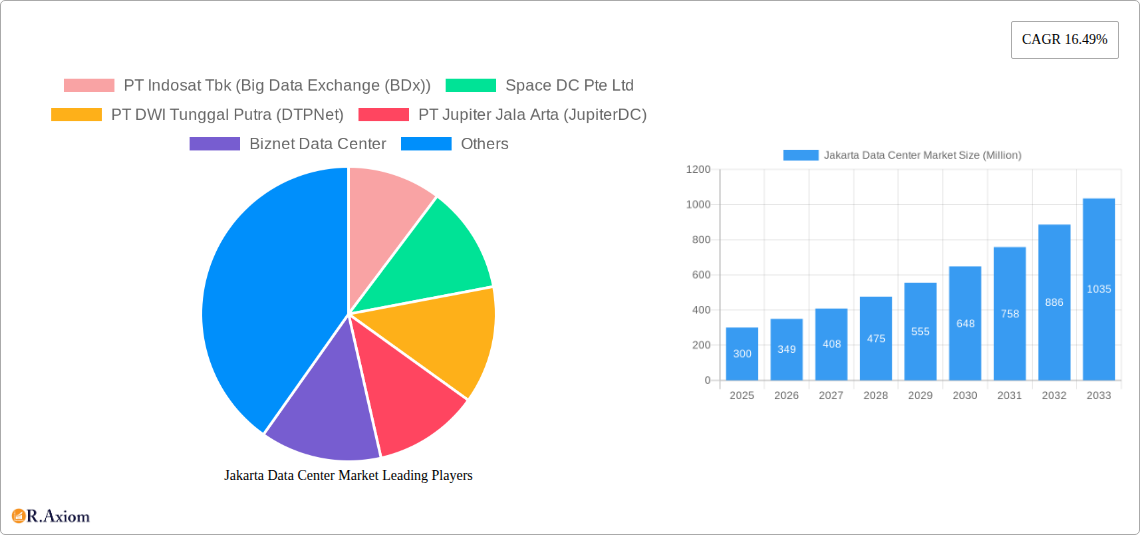
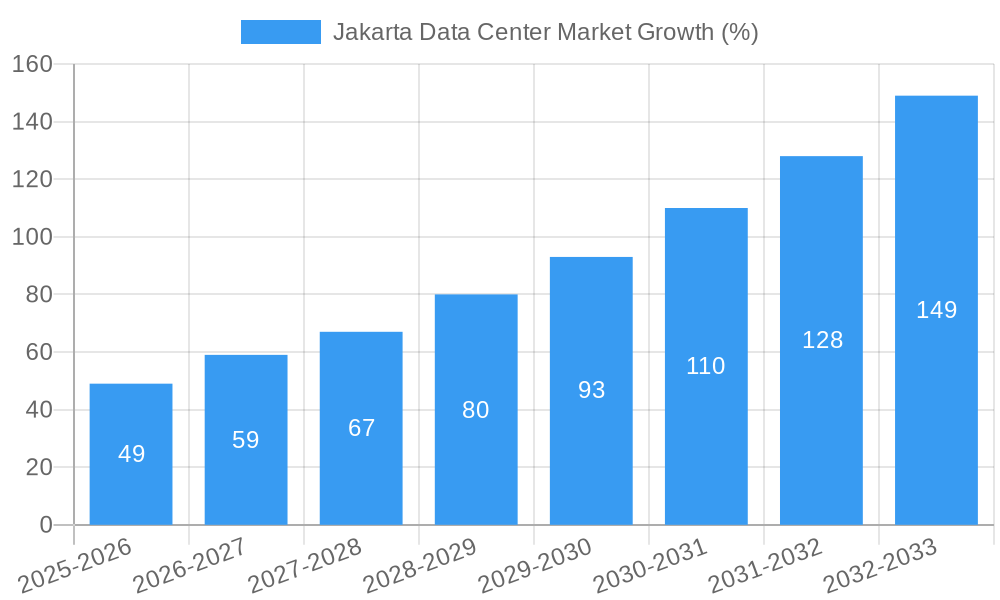
The Jakarta data center market is experiencing robust growth, fueled by Indonesia's burgeoning digital economy and increasing cloud adoption. With a CAGR of 16.49% from 2019 to 2024, the market exhibits significant potential for expansion through 2033. Key drivers include the rising demand for digital services across sectors like BFSI, e-commerce, and telecommunications, coupled with government initiatives promoting digital infrastructure development. The market is segmented by data center size (small to mega), tier type, absorption rate (utilized vs. non-utilized), colocation type (retail, wholesale, hyperscale), and end-user industry. While precise market sizing for 2025 is unavailable, extrapolating from the CAGR and considering the current market dynamics, we can estimate the Jakarta data center market value to be approximately $300 million in 2025, with a projected value exceeding $1 billion by 2033. This growth trajectory is further supported by increasing foreign investments in Indonesian digital infrastructure and the establishment of new hyperscale data centers.
However, market growth is not without its challenges. Land scarcity and high infrastructure costs in Jakarta could act as significant restraints. Further, ensuring sufficient power supply and network connectivity remain critical for sustained expansion. The competitive landscape is becoming increasingly crowded, with both local and international players vying for market share. Strategic partnerships, investments in advanced technologies (such as AI and edge computing), and a focus on sustainability will be crucial for companies seeking to thrive in this dynamic environment. The ongoing development of digital infrastructure across Indonesia also presents opportunities for expansion beyond Jakarta, leading to potential regional shifts in market concentration over the forecast period.
Jakarta Data Center Market: A Comprehensive Report (2019-2033)
This in-depth report provides a comprehensive analysis of the Jakarta data center market, covering market size, segmentation, key players, growth drivers, challenges, and future outlook. The study period spans from 2019 to 2033, with 2025 as the base and estimated year. The report offers actionable insights for industry stakeholders, including data center operators, investors, and technology providers. It leverages extensive data to forecast market trends and identify lucrative opportunities within this rapidly evolving landscape.
Jakarta Data Center Market Market Concentration & Innovation
The Jakarta data center market exhibits a moderately concentrated landscape, with several major players controlling a significant market share. While precise market share figures for individual companies remain proprietary, PT DCI Indonesia Tbk, PT Telkomsigma, and PT Indosat Tbk (BDx) are recognized as leading players, commanding a collective xx% market share in 2025. Smaller players such as Space DC Pte Ltd, Biznet Data Center, and others compete aggressively, particularly in the retail colocation segment.
Innovation in the Jakarta market is driven by several factors:
- Technological advancements: Increased adoption of cloud computing, edge computing, and AI/ML solutions necessitates higher data processing capabilities, boosting demand for advanced data center infrastructure.
- Sustainability initiatives: Growing environmental awareness fuels investment in energy-efficient data centers with lower PUE (Power Usage Effectiveness) ratings. The recent CGK3A data center project by BDxIndonesia exemplifies this trend.
- Government regulations: Supportive government policies aimed at digital transformation and infrastructure development are driving market growth.
- Product substitution: While physical data centers remain dominant, the rise of cloud services presents a degree of substitution, albeit one that often complements rather than replaces on-premise infrastructure.
Mergers and acquisitions (M&A) activities have played a significant role in shaping market concentration. Recent deals, valued at approximately xx Million USD in the past three years, have consolidated market power and enhanced operational efficiency. Further M&A activity is anticipated as larger players seek to expand their footprint and service offerings.
Jakarta Data Center Market Industry Trends & Insights
The Jakarta data center market is experiencing robust growth, driven by a confluence of factors. The Compound Annual Growth Rate (CAGR) from 2025 to 2033 is projected to be xx%, reaching a market size of xx Million USD by 2033. This growth is fueled by:
- Increased digitalization: Indonesia's burgeoning digital economy, characterized by rapid growth in e-commerce, fintech, and streaming services, is driving demand for data center capacity.
- Government initiatives: The Indonesian government's commitment to building a digital economy through investments in digital infrastructure is a key catalyst.
- Technological advancements: The adoption of 5G networks and the expansion of cloud services are generating substantial demand for data center services.
- Foreign investment: Increased foreign direct investment (FDI) in Indonesia's technology sector is contributing to the expansion of the data center market.
Market penetration of hyperscale data centers is growing rapidly, with major cloud providers establishing significant presence. Consumer preferences increasingly favor high-availability, secure, and environmentally friendly data center solutions. Competitive dynamics are characterized by intense rivalry, particularly among larger players seeking to differentiate their offerings through specialized services, competitive pricing, and strategic partnerships.
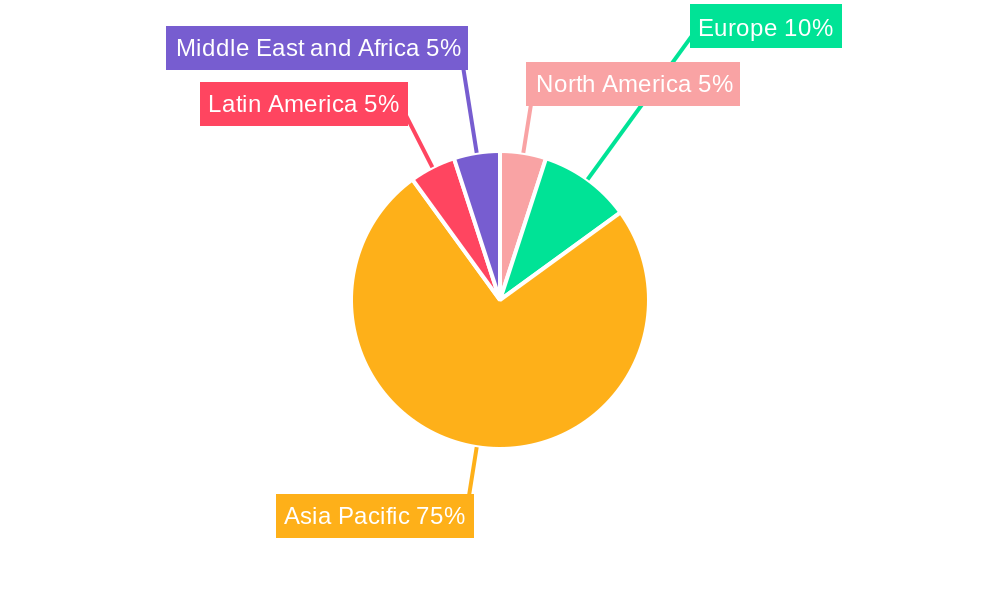
Dominant Markets & Segments in Jakarta Data Center Market
The Jakarta metropolitan area dominates the Indonesian data center market, benefiting from its robust connectivity, skilled workforce, and proximity to key business hubs.
- Key Drivers for Jakarta's Dominance:
- Established digital infrastructure.
- High concentration of businesses and consumers.
- Access to skilled IT professionals.
- Government support for technology investments.
Dominant Segments:
- DC Size: Large and Mega data centers are experiencing the fastest growth due to demand from hyperscale providers and large enterprises. Small and Medium data centers remain relevant for smaller businesses and specific niche applications.
- Tier Type: Tier III data centers dominate the market due to their high reliability and redundancy features, although Tier IV facilities are gradually emerging.
- Absorption: The Utilized segment is significantly larger than the Non-Utilized, indicating high demand and low vacancy rates.
- Colocation Type: Wholesale colocation is experiencing strong growth due to the increasing requirements of hyperscale operators. Retail colocation remains crucial for smaller and medium-sized enterprises.
- End User: Cloud & IT, Telecom, and E-commerce represent the largest end-user segments, reflecting the robust growth of these sectors.
Jakarta Data Center Market Product Developments
Recent product developments focus on enhanced security, scalability, and energy efficiency. This includes advanced automation technologies, AI-powered monitoring systems, and environmentally conscious designs. Data center providers are increasingly offering tailored solutions for specific industry verticals, catering to the unique needs of different customer segments. This trend ensures market fit and competitive advantage by allowing tailored solutions based on the latest technological trends.
Report Scope & Segmentation Analysis
This report comprehensively analyzes the Jakarta data center market across various segments:
- DC Size: Small, Medium, Large, Massive, Mega (Market size and growth projections are provided for each segment.)
- Tier Type: Tier 1, Tier 2, Tier 3, Tier 4 (Growth rates and competitive dynamics are analyzed for each tier.)
- Absorption: Utilized, Non-Utilized (Detailed breakdown of absorption rates and their implications.)
- Colocation Type: Retail, Wholesale, Hyperscale (Market shares and growth forecasts for each colocation type.)
- End User: Cloud & IT, Telecom, Media & Entertainment, Government, BFSI, Manufacturing, E-commerce, Other End User (Market size, growth projections, and competitive landscapes are presented for each end-user segment.)
Key Drivers of Jakarta Data Center Market Growth
Several factors contribute to the market's growth:
- The rapid expansion of Indonesia's digital economy.
- Government initiatives promoting digital infrastructure development.
- Rising demand for cloud services and big data analytics.
- Increased foreign investment in Indonesia's technology sector.
Challenges in the Jakarta Data Center Market Sector
The Jakarta data center market faces certain challenges:
- Land scarcity and high land prices in the metropolitan area.
- Potential power supply constraints.
- Competition from established and new market entrants. This leads to price pressure and decreased profitability.
Emerging Opportunities in Jakarta Data Center Market
Emerging opportunities include:
- Expansion into secondary markets to address land scarcity in Jakarta.
- Focus on green data center solutions to align with environmental sustainability goals.
- Providing specialized services catering to niche industry sectors.
Leading Players in the Jakarta Data Center Market Market
- PT Indosat Tbk (Big Data Exchange (BDx))
- Space DC Pte Ltd
- PT DWI Tunggal Putra (DTPNet)
- PT Jupiter Jala Arta (JupiterDC)
- Biznet Data Center
- PT Sigma Cipta Caraka (Telkomsigma)
- Digital Edge DC
- EdgeConneX Inc (GTN Data Centers)
- PT DCI Indonesia Tbk
- NEX Data Center Indonesia
- PT XL Axiata Tbk (Princeton Digital Group)
- NTT Ltd
- Nusantara Data Center
Key Developments in Jakarta Data Center Market Industry
- April 2023: BDxIndonesia commences construction of its CGK3A data center in South Jakarta, adding 15 MW of capacity.
- December 2022: ST Telemedia Global Data Centres (Indonesia) completes the structural build of STT Jakarta 1, a 19.5 MW facility, part of a larger 72 MW campus.
Strategic Outlook for Jakarta Data Center Market Market
The Jakarta data center market is poised for continued strong growth, driven by the expansion of the digital economy, government initiatives, and increasing demand for advanced data center solutions. Strategic investments in infrastructure, technology, and sustainability will be crucial for success in this competitive market. The focus on green data centers, and innovative solutions will attract further investment and propel the market forward.
Jakarta Data Center Market Segmentation
-
1. DC Size
- 1.1. Small
- 1.2. Medium
- 1.3. Large
- 1.4. Massive
- 1.5. Mega
-
2. Tier Type
- 2.1. Tier 1 & 2
- 2.2. Tier 3
- 2.3. Tier 4
-
3. Absorption
-
3.1. Utilized
-
3.1.1. Colocation Type
- 3.1.1.1. Retail
- 3.1.1.2. Wholesale
- 3.1.1.3. Hyperscale
-
3.1.2. End User
- 3.1.2.1. Cloud & IT
- 3.1.2.2. Telecom
- 3.1.2.3. Media & Entertainment
- 3.1.2.4. Government
- 3.1.2.5. BFSI
- 3.1.2.6. Manufacturing
- 3.1.2.7. E-Commerce
- 3.1.2.8. Other End User
-
3.1.1. Colocation Type
- 3.2. Non-Utilized
-
3.1. Utilized
Jakarta Data Center Market Segmentation By Geography
-
1. North America
- 1.1. United States
- 1.2. Canada
- 1.3. Mexico
-
2. South America
- 2.1. Brazil
- 2.2. Argentina
- 2.3. Rest of South America
-
3. Europe
- 3.1. United Kingdom
- 3.2. Germany
- 3.3. France
- 3.4. Italy
- 3.5. Spain
- 3.6. Russia
- 3.7. Benelux
- 3.8. Nordics
- 3.9. Rest of Europe
-
4. Middle East & Africa
- 4.1. Turkey
- 4.2. Israel
- 4.3. GCC
- 4.4. North Africa
- 4.5. South Africa
- 4.6. Rest of Middle East & Africa
-
5. Asia Pacific
- 5.1. China
- 5.2. India
- 5.3. Japan
- 5.4. South Korea
- 5.5. ASEAN
- 5.6. Oceania
- 5.7. Rest of Asia Pacific
Jakarta Data Center Market REPORT HIGHLIGHTS
| Aspects | Details |
|---|---|
| Study Period | 2019-2033 |
| Base Year | 2024 |
| Estimated Year | 2025 |
| Forecast Period | 2025-2033 |
| Historical Period | 2019-2024 |
| Growth Rate | CAGR of 16.49% from 2019-2033 |
| Segmentation |
|
Table of Contents
- 1. Introduction
- 1.1. Research Scope
- 1.2. Market Segmentation
- 1.3. Research Methodology
- 1.4. Definitions and Assumptions
- 2. Executive Summary
- 2.1. Introduction
- 3. Market Dynamics
- 3.1. Introduction
- 3.2. Market Drivers
- 3.2.1. Regulations Promoting Proper Lighting for Worker Safety in Hazardous Locations; Rising Demand for Cost-effective and Energy-efficient LED Lighting Solutions
- 3.3. Market Restrains
- 3.3.1. High Costs of Equipment
- 3.4. Market Trends
- 3.4.1. Tier 4 is Expected to Hold Significant Share of the Market
- 4. Market Factor Analysis
- 4.1. Porters Five Forces
- 4.2. Supply/Value Chain
- 4.3. PESTEL analysis
- 4.4. Market Entropy
- 4.5. Patent/Trademark Analysis
- 5. Global Jakarta Data Center Market Analysis, Insights and Forecast, 2019-2031
- 5.1. Market Analysis, Insights and Forecast - by DC Size
- 5.1.1. Small
- 5.1.2. Medium
- 5.1.3. Large
- 5.1.4. Massive
- 5.1.5. Mega
- 5.2. Market Analysis, Insights and Forecast - by Tier Type
- 5.2.1. Tier 1 & 2
- 5.2.2. Tier 3
- 5.2.3. Tier 4
- 5.3. Market Analysis, Insights and Forecast - by Absorption
- 5.3.1. Utilized
- 5.3.1.1. Colocation Type
- 5.3.1.1.1. Retail
- 5.3.1.1.2. Wholesale
- 5.3.1.1.3. Hyperscale
- 5.3.1.2. End User
- 5.3.1.2.1. Cloud & IT
- 5.3.1.2.2. Telecom
- 5.3.1.2.3. Media & Entertainment
- 5.3.1.2.4. Government
- 5.3.1.2.5. BFSI
- 5.3.1.2.6. Manufacturing
- 5.3.1.2.7. E-Commerce
- 5.3.1.2.8. Other End User
- 5.3.1.1. Colocation Type
- 5.3.2. Non-Utilized
- 5.3.1. Utilized
- 5.4. Market Analysis, Insights and Forecast - by Region
- 5.4.1. North America
- 5.4.2. South America
- 5.4.3. Europe
- 5.4.4. Middle East & Africa
- 5.4.5. Asia Pacific
- 5.1. Market Analysis, Insights and Forecast - by DC Size
- 6. North America Jakarta Data Center Market Analysis, Insights and Forecast, 2019-2031
- 6.1. Market Analysis, Insights and Forecast - by DC Size
- 6.1.1. Small
- 6.1.2. Medium
- 6.1.3. Large
- 6.1.4. Massive
- 6.1.5. Mega
- 6.2. Market Analysis, Insights and Forecast - by Tier Type
- 6.2.1. Tier 1 & 2
- 6.2.2. Tier 3
- 6.2.3. Tier 4
- 6.3. Market Analysis, Insights and Forecast - by Absorption
- 6.3.1. Utilized
- 6.3.1.1. Colocation Type
- 6.3.1.1.1. Retail
- 6.3.1.1.2. Wholesale
- 6.3.1.1.3. Hyperscale
- 6.3.1.2. End User
- 6.3.1.2.1. Cloud & IT
- 6.3.1.2.2. Telecom
- 6.3.1.2.3. Media & Entertainment
- 6.3.1.2.4. Government
- 6.3.1.2.5. BFSI
- 6.3.1.2.6. Manufacturing
- 6.3.1.2.7. E-Commerce
- 6.3.1.2.8. Other End User
- 6.3.1.1. Colocation Type
- 6.3.2. Non-Utilized
- 6.3.1. Utilized
- 6.1. Market Analysis, Insights and Forecast - by DC Size
- 7. South America Jakarta Data Center Market Analysis, Insights and Forecast, 2019-2031
- 7.1. Market Analysis, Insights and Forecast - by DC Size
- 7.1.1. Small
- 7.1.2. Medium
- 7.1.3. Large
- 7.1.4. Massive
- 7.1.5. Mega
- 7.2. Market Analysis, Insights and Forecast - by Tier Type
- 7.2.1. Tier 1 & 2
- 7.2.2. Tier 3
- 7.2.3. Tier 4
- 7.3. Market Analysis, Insights and Forecast - by Absorption
- 7.3.1. Utilized
- 7.3.1.1. Colocation Type
- 7.3.1.1.1. Retail
- 7.3.1.1.2. Wholesale
- 7.3.1.1.3. Hyperscale
- 7.3.1.2. End User
- 7.3.1.2.1. Cloud & IT
- 7.3.1.2.2. Telecom
- 7.3.1.2.3. Media & Entertainment
- 7.3.1.2.4. Government
- 7.3.1.2.5. BFSI
- 7.3.1.2.6. Manufacturing
- 7.3.1.2.7. E-Commerce
- 7.3.1.2.8. Other End User
- 7.3.1.1. Colocation Type
- 7.3.2. Non-Utilized
- 7.3.1. Utilized
- 7.1. Market Analysis, Insights and Forecast - by DC Size
- 8. Europe Jakarta Data Center Market Analysis, Insights and Forecast, 2019-2031
- 8.1. Market Analysis, Insights and Forecast - by DC Size
- 8.1.1. Small
- 8.1.2. Medium
- 8.1.3. Large
- 8.1.4. Massive
- 8.1.5. Mega
- 8.2. Market Analysis, Insights and Forecast - by Tier Type
- 8.2.1. Tier 1 & 2
- 8.2.2. Tier 3
- 8.2.3. Tier 4
- 8.3. Market Analysis, Insights and Forecast - by Absorption
- 8.3.1. Utilized
- 8.3.1.1. Colocation Type
- 8.3.1.1.1. Retail
- 8.3.1.1.2. Wholesale
- 8.3.1.1.3. Hyperscale
- 8.3.1.2. End User
- 8.3.1.2.1. Cloud & IT
- 8.3.1.2.2. Telecom
- 8.3.1.2.3. Media & Entertainment
- 8.3.1.2.4. Government
- 8.3.1.2.5. BFSI
- 8.3.1.2.6. Manufacturing
- 8.3.1.2.7. E-Commerce
- 8.3.1.2.8. Other End User
- 8.3.1.1. Colocation Type
- 8.3.2. Non-Utilized
- 8.3.1. Utilized
- 8.1. Market Analysis, Insights and Forecast - by DC Size
- 9. Middle East & Africa Jakarta Data Center Market Analysis, Insights and Forecast, 2019-2031
- 9.1. Market Analysis, Insights and Forecast - by DC Size
- 9.1.1. Small
- 9.1.2. Medium
- 9.1.3. Large
- 9.1.4. Massive
- 9.1.5. Mega
- 9.2. Market Analysis, Insights and Forecast - by Tier Type
- 9.2.1. Tier 1 & 2
- 9.2.2. Tier 3
- 9.2.3. Tier 4
- 9.3. Market Analysis, Insights and Forecast - by Absorption
- 9.3.1. Utilized
- 9.3.1.1. Colocation Type
- 9.3.1.1.1. Retail
- 9.3.1.1.2. Wholesale
- 9.3.1.1.3. Hyperscale
- 9.3.1.2. End User
- 9.3.1.2.1. Cloud & IT
- 9.3.1.2.2. Telecom
- 9.3.1.2.3. Media & Entertainment
- 9.3.1.2.4. Government
- 9.3.1.2.5. BFSI
- 9.3.1.2.6. Manufacturing
- 9.3.1.2.7. E-Commerce
- 9.3.1.2.8. Other End User
- 9.3.1.1. Colocation Type
- 9.3.2. Non-Utilized
- 9.3.1. Utilized
- 9.1. Market Analysis, Insights and Forecast - by DC Size
- 10. Asia Pacific Jakarta Data Center Market Analysis, Insights and Forecast, 2019-2031
- 10.1. Market Analysis, Insights and Forecast - by DC Size
- 10.1.1. Small
- 10.1.2. Medium
- 10.1.3. Large
- 10.1.4. Massive
- 10.1.5. Mega
- 10.2. Market Analysis, Insights and Forecast - by Tier Type
- 10.2.1. Tier 1 & 2
- 10.2.2. Tier 3
- 10.2.3. Tier 4
- 10.3. Market Analysis, Insights and Forecast - by Absorption
- 10.3.1. Utilized
- 10.3.1.1. Colocation Type
- 10.3.1.1.1. Retail
- 10.3.1.1.2. Wholesale
- 10.3.1.1.3. Hyperscale
- 10.3.1.2. End User
- 10.3.1.2.1. Cloud & IT
- 10.3.1.2.2. Telecom
- 10.3.1.2.3. Media & Entertainment
- 10.3.1.2.4. Government
- 10.3.1.2.5. BFSI
- 10.3.1.2.6. Manufacturing
- 10.3.1.2.7. E-Commerce
- 10.3.1.2.8. Other End User
- 10.3.1.1. Colocation Type
- 10.3.2. Non-Utilized
- 10.3.1. Utilized
- 10.1. Market Analysis, Insights and Forecast - by DC Size
- 11. North America Jakarta Data Center Market Analysis, Insights and Forecast, 2019-2031
- 11.1. Market Analysis, Insights and Forecast - By Country/Sub-region
- 11.1.1.
- 12. Europe Jakarta Data Center Market Analysis, Insights and Forecast, 2019-2031
- 12.1. Market Analysis, Insights and Forecast - By Country/Sub-region
- 12.1.1.
- 13. Asia Pacific Jakarta Data Center Market Analysis, Insights and Forecast, 2019-2031
- 13.1. Market Analysis, Insights and Forecast - By Country/Sub-region
- 13.1.1.
- 14. Latin America Jakarta Data Center Market Analysis, Insights and Forecast, 2019-2031
- 14.1. Market Analysis, Insights and Forecast - By Country/Sub-region
- 14.1.1.
- 15. Middle East and Africa Jakarta Data Center Market Analysis, Insights and Forecast, 2019-2031
- 15.1. Market Analysis, Insights and Forecast - By Country/Sub-region
- 15.1.1.
- 16. Competitive Analysis
- 16.1. Global Market Share Analysis 2024
- 16.2. Company Profiles
- 16.2.1 PT Indosat Tbk (Big Data Exchange (BDx))
- 16.2.1.1. Overview
- 16.2.1.2. Products
- 16.2.1.3. SWOT Analysis
- 16.2.1.4. Recent Developments
- 16.2.1.5. Financials (Based on Availability)
- 16.2.2 Space DC Pte Ltd
- 16.2.2.1. Overview
- 16.2.2.2. Products
- 16.2.2.3. SWOT Analysis
- 16.2.2.4. Recent Developments
- 16.2.2.5. Financials (Based on Availability)
- 16.2.3 PT DWI Tunggal Putra (DTPNet)
- 16.2.3.1. Overview
- 16.2.3.2. Products
- 16.2.3.3. SWOT Analysis
- 16.2.3.4. Recent Developments
- 16.2.3.5. Financials (Based on Availability)
- 16.2.4 PT Jupiter Jala Arta (JupiterDC)
- 16.2.4.1. Overview
- 16.2.4.2. Products
- 16.2.4.3. SWOT Analysis
- 16.2.4.4. Recent Developments
- 16.2.4.5. Financials (Based on Availability)
- 16.2.5 Biznet Data Center
- 16.2.5.1. Overview
- 16.2.5.2. Products
- 16.2.5.3. SWOT Analysis
- 16.2.5.4. Recent Developments
- 16.2.5.5. Financials (Based on Availability)
- 16.2.6 PT Sigma Cipta Caraka (Telkomsigma)
- 16.2.6.1. Overview
- 16.2.6.2. Products
- 16.2.6.3. SWOT Analysis
- 16.2.6.4. Recent Developments
- 16.2.6.5. Financials (Based on Availability)
- 16.2.7 Digital Edge DC
- 16.2.7.1. Overview
- 16.2.7.2. Products
- 16.2.7.3. SWOT Analysis
- 16.2.7.4. Recent Developments
- 16.2.7.5. Financials (Based on Availability)
- 16.2.8 EdgeConneX Inc (GTN Data Centers)
- 16.2.8.1. Overview
- 16.2.8.2. Products
- 16.2.8.3. SWOT Analysis
- 16.2.8.4. Recent Developments
- 16.2.8.5. Financials (Based on Availability)
- 16.2.9 PT DCI Indonesia Tbk
- 16.2.9.1. Overview
- 16.2.9.2. Products
- 16.2.9.3. SWOT Analysis
- 16.2.9.4. Recent Developments
- 16.2.9.5. Financials (Based on Availability)
- 16.2.10 NEX Data Center Indonesia
- 16.2.10.1. Overview
- 16.2.10.2. Products
- 16.2.10.3. SWOT Analysis
- 16.2.10.4. Recent Developments
- 16.2.10.5. Financials (Based on Availability)
- 16.2.11 PT XL Axiata Tbk (Princeton Digital Group)
- 16.2.11.1. Overview
- 16.2.11.2. Products
- 16.2.11.3. SWOT Analysis
- 16.2.11.4. Recent Developments
- 16.2.11.5. Financials (Based on Availability)
- 16.2.12 NTT Ltd
- 16.2.12.1. Overview
- 16.2.12.2. Products
- 16.2.12.3. SWOT Analysis
- 16.2.12.4. Recent Developments
- 16.2.12.5. Financials (Based on Availability)
- 16.2.13 Nusantara Data Center
- 16.2.13.1. Overview
- 16.2.13.2. Products
- 16.2.13.3. SWOT Analysis
- 16.2.13.4. Recent Developments
- 16.2.13.5. Financials (Based on Availability)
- 16.2.1 PT Indosat Tbk (Big Data Exchange (BDx))
List of Figures
- Figure 1: Global Jakarta Data Center Market Revenue Breakdown (Million, %) by Region 2024 & 2032
- Figure 2: North America Jakarta Data Center Market Revenue (Million), by Country 2024 & 2032
- Figure 3: North America Jakarta Data Center Market Revenue Share (%), by Country 2024 & 2032
- Figure 4: Europe Jakarta Data Center Market Revenue (Million), by Country 2024 & 2032
- Figure 5: Europe Jakarta Data Center Market Revenue Share (%), by Country 2024 & 2032
- Figure 6: Asia Pacific Jakarta Data Center Market Revenue (Million), by Country 2024 & 2032
- Figure 7: Asia Pacific Jakarta Data Center Market Revenue Share (%), by Country 2024 & 2032
- Figure 8: Latin America Jakarta Data Center Market Revenue (Million), by Country 2024 & 2032
- Figure 9: Latin America Jakarta Data Center Market Revenue Share (%), by Country 2024 & 2032
- Figure 10: Middle East and Africa Jakarta Data Center Market Revenue (Million), by Country 2024 & 2032
- Figure 11: Middle East and Africa Jakarta Data Center Market Revenue Share (%), by Country 2024 & 2032
- Figure 12: North America Jakarta Data Center Market Revenue (Million), by DC Size 2024 & 2032
- Figure 13: North America Jakarta Data Center Market Revenue Share (%), by DC Size 2024 & 2032
- Figure 14: North America Jakarta Data Center Market Revenue (Million), by Tier Type 2024 & 2032
- Figure 15: North America Jakarta Data Center Market Revenue Share (%), by Tier Type 2024 & 2032
- Figure 16: North America Jakarta Data Center Market Revenue (Million), by Absorption 2024 & 2032
- Figure 17: North America Jakarta Data Center Market Revenue Share (%), by Absorption 2024 & 2032
- Figure 18: North America Jakarta Data Center Market Revenue (Million), by Country 2024 & 2032
- Figure 19: North America Jakarta Data Center Market Revenue Share (%), by Country 2024 & 2032
- Figure 20: South America Jakarta Data Center Market Revenue (Million), by DC Size 2024 & 2032
- Figure 21: South America Jakarta Data Center Market Revenue Share (%), by DC Size 2024 & 2032
- Figure 22: South America Jakarta Data Center Market Revenue (Million), by Tier Type 2024 & 2032
- Figure 23: South America Jakarta Data Center Market Revenue Share (%), by Tier Type 2024 & 2032
- Figure 24: South America Jakarta Data Center Market Revenue (Million), by Absorption 2024 & 2032
- Figure 25: South America Jakarta Data Center Market Revenue Share (%), by Absorption 2024 & 2032
- Figure 26: South America Jakarta Data Center Market Revenue (Million), by Country 2024 & 2032
- Figure 27: South America Jakarta Data Center Market Revenue Share (%), by Country 2024 & 2032
- Figure 28: Europe Jakarta Data Center Market Revenue (Million), by DC Size 2024 & 2032
- Figure 29: Europe Jakarta Data Center Market Revenue Share (%), by DC Size 2024 & 2032
- Figure 30: Europe Jakarta Data Center Market Revenue (Million), by Tier Type 2024 & 2032
- Figure 31: Europe Jakarta Data Center Market Revenue Share (%), by Tier Type 2024 & 2032
- Figure 32: Europe Jakarta Data Center Market Revenue (Million), by Absorption 2024 & 2032
- Figure 33: Europe Jakarta Data Center Market Revenue Share (%), by Absorption 2024 & 2032
- Figure 34: Europe Jakarta Data Center Market Revenue (Million), by Country 2024 & 2032
- Figure 35: Europe Jakarta Data Center Market Revenue Share (%), by Country 2024 & 2032
- Figure 36: Middle East & Africa Jakarta Data Center Market Revenue (Million), by DC Size 2024 & 2032
- Figure 37: Middle East & Africa Jakarta Data Center Market Revenue Share (%), by DC Size 2024 & 2032
- Figure 38: Middle East & Africa Jakarta Data Center Market Revenue (Million), by Tier Type 2024 & 2032
- Figure 39: Middle East & Africa Jakarta Data Center Market Revenue Share (%), by Tier Type 2024 & 2032
- Figure 40: Middle East & Africa Jakarta Data Center Market Revenue (Million), by Absorption 2024 & 2032
- Figure 41: Middle East & Africa Jakarta Data Center Market Revenue Share (%), by Absorption 2024 & 2032
- Figure 42: Middle East & Africa Jakarta Data Center Market Revenue (Million), by Country 2024 & 2032
- Figure 43: Middle East & Africa Jakarta Data Center Market Revenue Share (%), by Country 2024 & 2032
- Figure 44: Asia Pacific Jakarta Data Center Market Revenue (Million), by DC Size 2024 & 2032
- Figure 45: Asia Pacific Jakarta Data Center Market Revenue Share (%), by DC Size 2024 & 2032
- Figure 46: Asia Pacific Jakarta Data Center Market Revenue (Million), by Tier Type 2024 & 2032
- Figure 47: Asia Pacific Jakarta Data Center Market Revenue Share (%), by Tier Type 2024 & 2032
- Figure 48: Asia Pacific Jakarta Data Center Market Revenue (Million), by Absorption 2024 & 2032
- Figure 49: Asia Pacific Jakarta Data Center Market Revenue Share (%), by Absorption 2024 & 2032
- Figure 50: Asia Pacific Jakarta Data Center Market Revenue (Million), by Country 2024 & 2032
- Figure 51: Asia Pacific Jakarta Data Center Market Revenue Share (%), by Country 2024 & 2032
List of Tables
- Table 1: Global Jakarta Data Center Market Revenue Million Forecast, by Region 2019 & 2032
- Table 2: Global Jakarta Data Center Market Revenue Million Forecast, by DC Size 2019 & 2032
- Table 3: Global Jakarta Data Center Market Revenue Million Forecast, by Tier Type 2019 & 2032
- Table 4: Global Jakarta Data Center Market Revenue Million Forecast, by Absorption 2019 & 2032
- Table 5: Global Jakarta Data Center Market Revenue Million Forecast, by Region 2019 & 2032
- Table 6: Global Jakarta Data Center Market Revenue Million Forecast, by Country 2019 & 2032
- Table 7: Jakarta Data Center Market Revenue (Million) Forecast, by Application 2019 & 2032
- Table 8: Global Jakarta Data Center Market Revenue Million Forecast, by Country 2019 & 2032
- Table 9: Jakarta Data Center Market Revenue (Million) Forecast, by Application 2019 & 2032
- Table 10: Global Jakarta Data Center Market Revenue Million Forecast, by Country 2019 & 2032
- Table 11: Jakarta Data Center Market Revenue (Million) Forecast, by Application 2019 & 2032
- Table 12: Global Jakarta Data Center Market Revenue Million Forecast, by Country 2019 & 2032
- Table 13: Jakarta Data Center Market Revenue (Million) Forecast, by Application 2019 & 2032
- Table 14: Global Jakarta Data Center Market Revenue Million Forecast, by Country 2019 & 2032
- Table 15: Jakarta Data Center Market Revenue (Million) Forecast, by Application 2019 & 2032
- Table 16: Global Jakarta Data Center Market Revenue Million Forecast, by DC Size 2019 & 2032
- Table 17: Global Jakarta Data Center Market Revenue Million Forecast, by Tier Type 2019 & 2032
- Table 18: Global Jakarta Data Center Market Revenue Million Forecast, by Absorption 2019 & 2032
- Table 19: Global Jakarta Data Center Market Revenue Million Forecast, by Country 2019 & 2032
- Table 20: United States Jakarta Data Center Market Revenue (Million) Forecast, by Application 2019 & 2032
- Table 21: Canada Jakarta Data Center Market Revenue (Million) Forecast, by Application 2019 & 2032
- Table 22: Mexico Jakarta Data Center Market Revenue (Million) Forecast, by Application 2019 & 2032
- Table 23: Global Jakarta Data Center Market Revenue Million Forecast, by DC Size 2019 & 2032
- Table 24: Global Jakarta Data Center Market Revenue Million Forecast, by Tier Type 2019 & 2032
- Table 25: Global Jakarta Data Center Market Revenue Million Forecast, by Absorption 2019 & 2032
- Table 26: Global Jakarta Data Center Market Revenue Million Forecast, by Country 2019 & 2032
- Table 27: Brazil Jakarta Data Center Market Revenue (Million) Forecast, by Application 2019 & 2032
- Table 28: Argentina Jakarta Data Center Market Revenue (Million) Forecast, by Application 2019 & 2032
- Table 29: Rest of South America Jakarta Data Center Market Revenue (Million) Forecast, by Application 2019 & 2032
- Table 30: Global Jakarta Data Center Market Revenue Million Forecast, by DC Size 2019 & 2032
- Table 31: Global Jakarta Data Center Market Revenue Million Forecast, by Tier Type 2019 & 2032
- Table 32: Global Jakarta Data Center Market Revenue Million Forecast, by Absorption 2019 & 2032
- Table 33: Global Jakarta Data Center Market Revenue Million Forecast, by Country 2019 & 2032
- Table 34: United Kingdom Jakarta Data Center Market Revenue (Million) Forecast, by Application 2019 & 2032
- Table 35: Germany Jakarta Data Center Market Revenue (Million) Forecast, by Application 2019 & 2032
- Table 36: France Jakarta Data Center Market Revenue (Million) Forecast, by Application 2019 & 2032
- Table 37: Italy Jakarta Data Center Market Revenue (Million) Forecast, by Application 2019 & 2032
- Table 38: Spain Jakarta Data Center Market Revenue (Million) Forecast, by Application 2019 & 2032
- Table 39: Russia Jakarta Data Center Market Revenue (Million) Forecast, by Application 2019 & 2032
- Table 40: Benelux Jakarta Data Center Market Revenue (Million) Forecast, by Application 2019 & 2032
- Table 41: Nordics Jakarta Data Center Market Revenue (Million) Forecast, by Application 2019 & 2032
- Table 42: Rest of Europe Jakarta Data Center Market Revenue (Million) Forecast, by Application 2019 & 2032
- Table 43: Global Jakarta Data Center Market Revenue Million Forecast, by DC Size 2019 & 2032
- Table 44: Global Jakarta Data Center Market Revenue Million Forecast, by Tier Type 2019 & 2032
- Table 45: Global Jakarta Data Center Market Revenue Million Forecast, by Absorption 2019 & 2032
- Table 46: Global Jakarta Data Center Market Revenue Million Forecast, by Country 2019 & 2032
- Table 47: Turkey Jakarta Data Center Market Revenue (Million) Forecast, by Application 2019 & 2032
- Table 48: Israel Jakarta Data Center Market Revenue (Million) Forecast, by Application 2019 & 2032
- Table 49: GCC Jakarta Data Center Market Revenue (Million) Forecast, by Application 2019 & 2032
- Table 50: North Africa Jakarta Data Center Market Revenue (Million) Forecast, by Application 2019 & 2032
- Table 51: South Africa Jakarta Data Center Market Revenue (Million) Forecast, by Application 2019 & 2032
- Table 52: Rest of Middle East & Africa Jakarta Data Center Market Revenue (Million) Forecast, by Application 2019 & 2032
- Table 53: Global Jakarta Data Center Market Revenue Million Forecast, by DC Size 2019 & 2032
- Table 54: Global Jakarta Data Center Market Revenue Million Forecast, by Tier Type 2019 & 2032
- Table 55: Global Jakarta Data Center Market Revenue Million Forecast, by Absorption 2019 & 2032
- Table 56: Global Jakarta Data Center Market Revenue Million Forecast, by Country 2019 & 2032
- Table 57: China Jakarta Data Center Market Revenue (Million) Forecast, by Application 2019 & 2032
- Table 58: India Jakarta Data Center Market Revenue (Million) Forecast, by Application 2019 & 2032
- Table 59: Japan Jakarta Data Center Market Revenue (Million) Forecast, by Application 2019 & 2032
- Table 60: South Korea Jakarta Data Center Market Revenue (Million) Forecast, by Application 2019 & 2032
- Table 61: ASEAN Jakarta Data Center Market Revenue (Million) Forecast, by Application 2019 & 2032
- Table 62: Oceania Jakarta Data Center Market Revenue (Million) Forecast, by Application 2019 & 2032
- Table 63: Rest of Asia Pacific Jakarta Data Center Market Revenue (Million) Forecast, by Application 2019 & 2032
Frequently Asked Questions
1. What is the projected Compound Annual Growth Rate (CAGR) of the Jakarta Data Center Market?
The projected CAGR is approximately 16.49%.
2. Which companies are prominent players in the Jakarta Data Center Market?
Key companies in the market include PT Indosat Tbk (Big Data Exchange (BDx)), Space DC Pte Ltd, PT DWI Tunggal Putra (DTPNet), PT Jupiter Jala Arta (JupiterDC), Biznet Data Center, PT Sigma Cipta Caraka (Telkomsigma), Digital Edge DC, EdgeConneX Inc (GTN Data Centers), PT DCI Indonesia Tbk, NEX Data Center Indonesia, PT XL Axiata Tbk (Princeton Digital Group), NTT Ltd, Nusantara Data Center.
3. What are the main segments of the Jakarta Data Center Market?
The market segments include DC Size, Tier Type, Absorption.
4. Can you provide details about the market size?
The market size is estimated to be USD XX Million as of 2022.
5. What are some drivers contributing to market growth?
Regulations Promoting Proper Lighting for Worker Safety in Hazardous Locations; Rising Demand for Cost-effective and Energy-efficient LED Lighting Solutions.
6. What are the notable trends driving market growth?
Tier 4 is Expected to Hold Significant Share of the Market.
7. Are there any restraints impacting market growth?
High Costs of Equipment.
8. Can you provide examples of recent developments in the market?
Apr 2023: BDxIndonesia, a BDxaffiliate, began constructing a new greenfield data center, CGK3A, in TB Simatupang, South Jakarta. The data center, which has a capacity of 15 MW, seeks to deliver top data center services to Indonesian businesses and hyperscalers. The new 14,127-square-meter data center is outfitted with Tier 3 data center facilities, advanced security systems, automation technology, and high network uptime, as well as a below-average power usage effectiveness (PUE) of 1.4, which provides operational excellence and a sustainable solution without sacrificing productivity and scalability.
9. What pricing options are available for accessing the report?
Pricing options include single-user, multi-user, and enterprise licenses priced at USD 3800, USD 4500, and USD 5800 respectively.
10. Is the market size provided in terms of value or volume?
The market size is provided in terms of value, measured in Million.
11. Are there any specific market keywords associated with the report?
Yes, the market keyword associated with the report is "Jakarta Data Center Market," which aids in identifying and referencing the specific market segment covered.
12. How do I determine which pricing option suits my needs best?
The pricing options vary based on user requirements and access needs. Individual users may opt for single-user licenses, while businesses requiring broader access may choose multi-user or enterprise licenses for cost-effective access to the report.
13. Are there any additional resources or data provided in the Jakarta Data Center Market report?
While the report offers comprehensive insights, it's advisable to review the specific contents or supplementary materials provided to ascertain if additional resources or data are available.
14. How can I stay updated on further developments or reports in the Jakarta Data Center Market?
To stay informed about further developments, trends, and reports in the Jakarta Data Center Market, consider subscribing to industry newsletters, following relevant companies and organizations, or regularly checking reputable industry news sources and publications.
Methodology
Step 1 - Identification of Relevant Samples Size from Population Database


Step 2 - Approaches for Defining Global Market Size (Value, Volume* & Price*)

Note*: In applicable scenarios
Step 3 - Data Sources
Primary Research
- Web Analytics
- Survey Reports
- Research Institute
- Latest Research Reports
- Opinion Leaders
Secondary Research
- Annual Reports
- White Paper
- Latest Press Release
- Industry Association
- Paid Database
- Investor Presentations

Step 4 - Data Triangulation
Involves using different sources of information in order to increase the validity of a study
These sources are likely to be stakeholders in a program - participants, other researchers, program staff, other community members, and so on.
Then we put all data in single framework & apply various statistical tools to find out the dynamic on the market.
During the analysis stage, feedback from the stakeholder groups would be compared to determine areas of agreement as well as areas of divergence


