
Key Insights
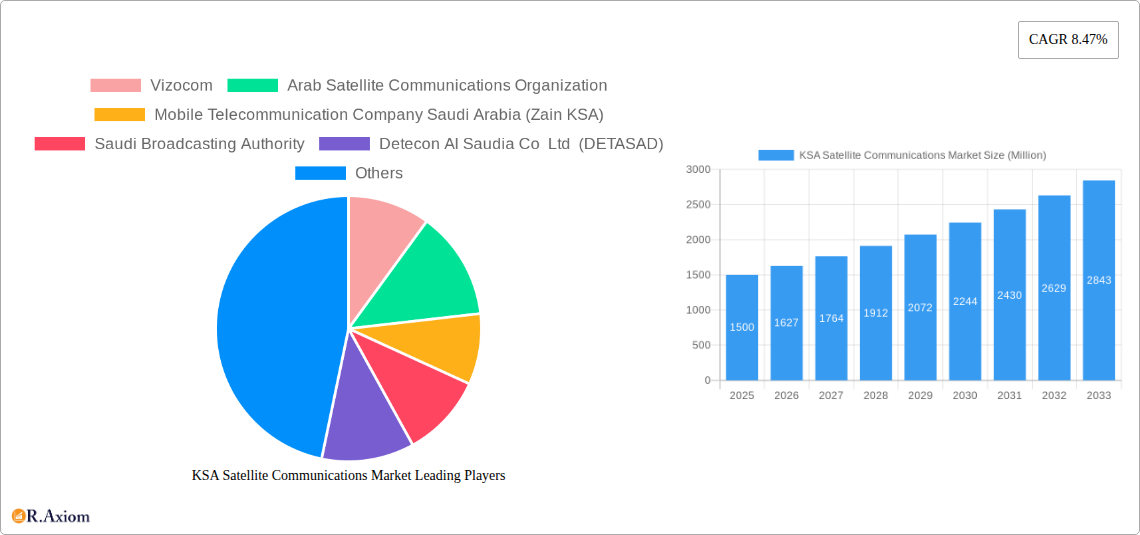
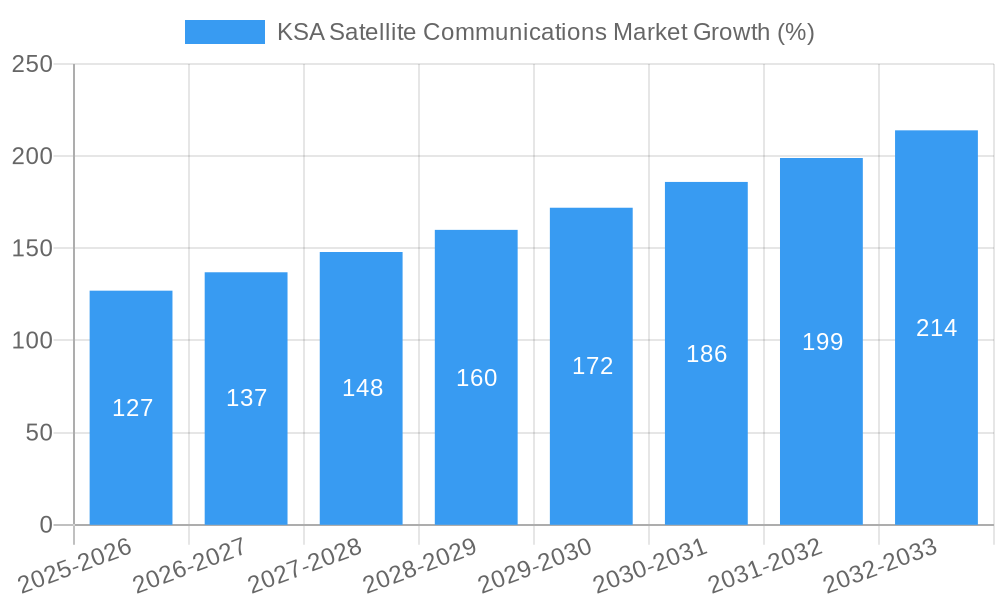
The Kingdom of Saudi Arabia (KSA) satellite communications market is experiencing robust growth, driven by increasing demand for high-speed internet access, expanding digital infrastructure, and the nation's ambitious Vision 2030 initiatives. The market, valued at approximately $XX million in 2025, is projected to exhibit a Compound Annual Growth Rate (CAGR) of 8.47% from 2025 to 2033. This growth is fueled by several key factors. The burgeoning media and entertainment sector, coupled with the expanding defense and government sectors' reliance on secure satellite communication technologies, are significant contributors. Furthermore, the rise of remote sensing applications and the increasing adoption of portable satellite communication devices across various industries are also boosting market expansion. The market segmentation reveals a significant contribution from the ground equipment segment, followed by services. Within platforms, the land-based segment holds a considerable market share, followed by airborne and maritime applications. Key players like STC, Thuraya, and others are aggressively investing in network expansion and technological upgrades to cater to this rising demand, fostering intense competition and innovation within the KSA satellite communications landscape.
The market's growth trajectory is also influenced by several trends, including the integration of 5G technology with satellite communication systems, the increasing adoption of Software-Defined Networking (SDN) and Network Function Virtualization (NFV) technologies for enhanced network flexibility and efficiency, and the growing demand for high-throughput satellite (HTS) solutions providing greater bandwidth and capacity. However, challenges such as the high initial investment costs associated with satellite infrastructure development and the potential for regulatory hurdles could potentially restrain market growth to some extent. Despite these challenges, the long-term outlook for the KSA satellite communications market remains positive, driven by continuous government support for technological advancement and a strong focus on digital transformation across various sectors within the Saudi Arabian economy. The market is expected to see substantial expansion across all segments and platforms in the forecast period.
This in-depth report provides a comprehensive analysis of the Kingdom of Saudi Arabia (KSA) satellite communications market, offering valuable insights for industry stakeholders, investors, and strategic decision-makers. The report covers the period 2019-2033, with a focus on the 2025-2033 forecast period. It analyzes market dynamics, key players, technological advancements, and future growth prospects, providing a detailed understanding of this rapidly evolving sector.
KSA Satellite Communications Market Market Concentration & Innovation
The KSA satellite communications market exhibits a moderately concentrated landscape, with several dominant players and a growing number of emerging companies. Market share is primarily determined by factors such as network coverage, service quality, and technological capabilities. STC and Zain KSA hold significant market share due to their established infrastructure and extensive customer base. However, the market shows evidence of increasing competition, driven by technological innovation and the entry of new players. The market is influenced by a relatively robust regulatory framework aimed at promoting sector development and enhancing competition. Mergers and acquisitions (M&A) activity has been relatively moderate, with deal values ranging from xx Million to xx Million in recent years. Notable M&A activities include [mention any specific M&A deals if available, otherwise use "limited publicly disclosed information on significant M&A activity"].
- Market Concentration: Moderate, dominated by a few key players like STC and Zain KSA.
- Innovation Drivers: Technological advancements in satellite technology, increasing demand for high-bandwidth services, and government initiatives to support the digital economy.
- Regulatory Framework: Relatively robust, encouraging sector development and competition.
- Product Substitutes: Terrestrial communication networks (fiber optics, 5G) pose a degree of competition, particularly in areas with robust terrestrial infrastructure.
- End-User Trends: Growing demand for reliable and high-speed connectivity across various sectors, including maritime, defense, and media.
- M&A Activity: Moderate; limited publicly disclosed information on significant M&A activity.
KSA Satellite Communications Market Industry Trends & Insights
The KSA satellite communications market is experiencing significant growth, driven by increasing demand for broadband services, government investments in infrastructure development, and advancements in satellite technology. The Compound Annual Growth Rate (CAGR) from 2025-2033 is estimated at xx%, indicating substantial market expansion. Market penetration is relatively high in urban areas but remains lower in remote regions. Technological disruptions, such as the adoption of High-Throughput Satellites (HTS) and Low Earth Orbit (LEO) constellations, are further fueling market growth. Consumer preferences are shifting towards higher data speeds, improved reliability, and cost-effective solutions. Competitive dynamics are characterized by intense competition among established players and new entrants vying for market share.
Dominant Markets & Segments in KSA Satellite Communications Market
The KSA satellite communications market is witnessing robust growth across multiple segments.
- By Type: The Services segment holds the largest market share, driven by rising demand for data transmission, satellite navigation, and broadcasting services. The Ground Equipment segment is also showing significant growth due to increasing investments in infrastructure and technology upgrades.
- By Platform: The Land segment is the dominant platform segment, owing to its extensive use in fixed communication networks and terrestrial infrastructure. The Maritime and Airborne segments are also exhibiting notable growth, driven by increasing demand in respective sectors. Portable satellite terminals are gaining popularity due to their convenience and mobility.
- By End-User Vertical: The Defense and Government sector is a key driver due to its significant need for secure and reliable communications. The Media and Entertainment sector is also a significant contributor, and the Enterprises and Maritime sectors continue to exhibit strong demand for satellite communication solutions.
Key Drivers for Dominant Segments:
- Economic Policies: Government investments in infrastructure and digital transformation are driving sector growth.
- Infrastructure Development: Expansion of communication networks and adoption of advanced technologies.
- Technological Advancements: HTS, LEO constellations, and improved ground equipment enhance connectivity and services.
KSA Satellite Communications Market Product Developments
Recent product innovations include the adoption of HTS and LEO satellite technologies, offering higher bandwidth and improved coverage. These advancements provide competitive advantages by enabling faster data speeds, lower latency, and more efficient services. New applications are emerging in areas such as IoT, remote sensing, and disaster management. The market is witnessing increasing integration of satellite communication technologies with other platforms, such as 5G and terrestrial networks.
Report Scope & Segmentation Analysis
This report segments the KSA satellite communications market by Type (Ground Equipment, Services), Platform (Portable, Land, Maritime, Airborne), and End-user Vertical (Maritime, Defense and Government, Enterprises, Media and Entertainment, Other End-user Verticals). Each segment's growth projection, market size, and competitive dynamics are analyzed.
By Type: The Services segment is projected to grow at xx% CAGR, while the Ground Equipment segment is expected to grow at xx% CAGR during the forecast period.
By Platform: The Land segment is the largest, with significant growth expected in Maritime and Airborne segments.
By End-user Vertical: The Defense and Government segment holds significant market share, with the Media and Entertainment and Enterprises segments also contributing substantially.
Key Drivers of KSA Satellite Communications Market Growth
The KSA satellite communications market's growth is driven by several factors: Government initiatives promoting digital transformation, increasing demand for high-bandwidth applications across various sectors, technological advancements in satellite technology (HTS, LEO), and expanding mobile and internet penetration in the Kingdom. Investments in infrastructure development are bolstering sector growth, and the country's strategic location and increasing emphasis on national security contribute to strong demand.
Challenges in the KSA Satellite Communications Market Sector
Challenges include the high initial investment costs associated with satellite infrastructure, potential regulatory hurdles, and competition from terrestrial communication networks. Supply chain disruptions can also impact market operations. The competitive landscape can create pricing pressures, influencing profitability.
Emerging Opportunities in KSA Satellite Communications Market
Emerging opportunities lie in the expansion of HTS and LEO satellite constellations, enabling broader coverage and higher bandwidth. The growth of IoT and M2M applications presents significant market expansion potential. The development of new applications in sectors like precision agriculture, smart cities, and disaster response also provides opportunities for growth and innovation.
Leading Players in the KSA Satellite Communications Market Market
- Vizocom
- Arab Satellite Communications Organization
- Mobile Telecommunication Company Saudi Arabia (Zain KSA)
- Saudi Broadcasting Authority
- Detecon Al Saudia Co Ltd (DETASAD)
- AXESS Networks Arabia Saudita
- Thuraya Telecommunications Company
- Saudi Telecom Company (STC)
- NOVAsat
- Salam (Integrated Telecom Company)
Key Developments in KSA Satellite Communications Market Industry
- May 2023: Arabsat launched Arabsat Badr-8, a seventh-generation satellite, enhancing satellite capacity and services in the region. This launch demonstrates commitment to technological advancements and expansion of satellite communication infrastructure.
- March 2023: The Helicopter Company (THC) equipped its helicopters with Iridium Certus satellite communications, improving safety and operational efficiency, highlighting the expansion of satellite technology into specialized sectors.
Strategic Outlook for KSA Satellite Communications Market Market
The KSA satellite communications market is poised for continued strong growth, driven by ongoing government investments in digital infrastructure, expanding broadband adoption, and technological advancements. The increasing adoption of advanced satellite technologies, such as HTS and LEO constellations, will further fuel market expansion. The opportunities in new applications and the expanding private sector will drive further market growth in the forecast period.
KSA Satellite Communications Market Segmentation
-
1. Type
- 1.1. Ground Equipment
- 1.2. Services
-
2. Platform
- 2.1. Portable
- 2.2. Land
- 2.3. Maritime
- 2.4. Airborne
-
3. End-user Vertical
- 3.1. Maritime
- 3.2. Defense and Government
- 3.3. Enterprises
- 3.4. Media and Entertainment
- 3.5. Other End-user Verticals
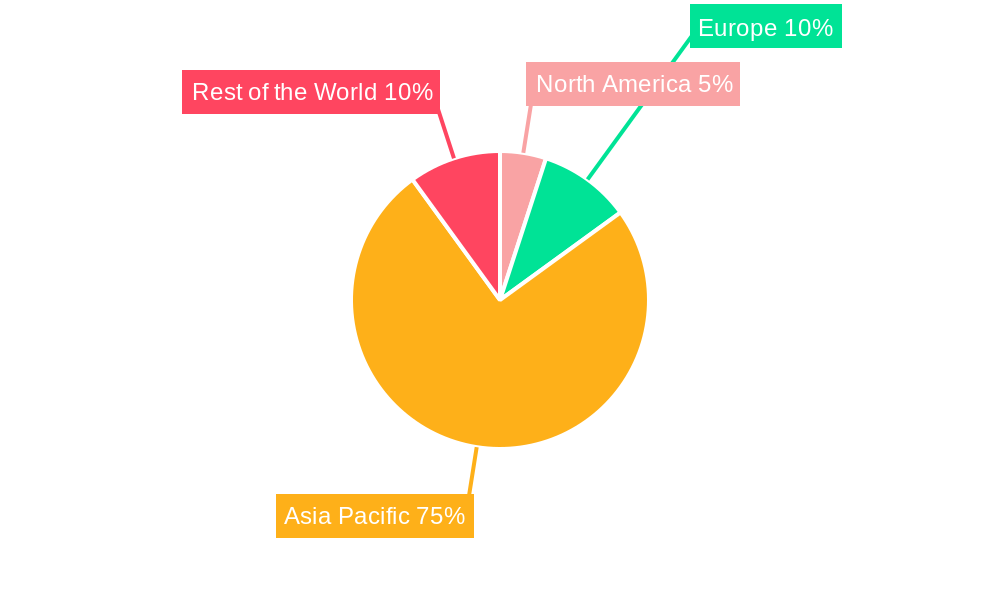
KSA Satellite Communications Market Segmentation By Geography
-
1. North America
- 1.1. United States
- 1.2. Canada
- 1.3. Mexico
-
2. South America
- 2.1. Brazil
- 2.2. Argentina
- 2.3. Rest of South America
-
3. Europe
- 3.1. United Kingdom
- 3.2. Germany
- 3.3. France
- 3.4. Italy
- 3.5. Spain
- 3.6. Russia
- 3.7. Benelux
- 3.8. Nordics
- 3.9. Rest of Europe
-
4. Middle East & Africa
- 4.1. Turkey
- 4.2. Israel
- 4.3. GCC
- 4.4. North Africa
- 4.5. South Africa
- 4.6. Rest of Middle East & Africa
-
5. Asia Pacific
- 5.1. China
- 5.2. India
- 5.3. Japan
- 5.4. South Korea
- 5.5. ASEAN
- 5.6. Oceania
- 5.7. Rest of Asia Pacific
KSA Satellite Communications Market REPORT HIGHLIGHTS
| Aspects | Details |
|---|---|
| Study Period | 2019-2033 |
| Base Year | 2024 |
| Estimated Year | 2025 |
| Forecast Period | 2025-2033 |
| Historical Period | 2019-2024 |
| Growth Rate | CAGR of 8.47% from 2019-2033 |
| Segmentation |
|
Table of Contents
- 1. Introduction
- 1.1. Research Scope
- 1.2. Market Segmentation
- 1.3. Research Methodology
- 1.4. Definitions and Assumptions
- 2. Executive Summary
- 2.1. Introduction
- 3. Market Dynamics
- 3.1. Introduction
- 3.2. Market Drivers
- 3.2.1. Increased Demand for Connectivity; Government Initiatives and Investments
- 3.3. Market Restrains
- 3.3.1. Regulatory and Policy Challenges; Competition from Alternative Technologies
- 3.4. Market Trends
- 3.4.1. Increased Demand for Connectivity to Drive the Market Growth
- 4. Market Factor Analysis
- 4.1. Porters Five Forces
- 4.2. Supply/Value Chain
- 4.3. PESTEL analysis
- 4.4. Market Entropy
- 4.5. Patent/Trademark Analysis
- 5. Global KSA Satellite Communications Market Analysis, Insights and Forecast, 2019-2031
- 5.1. Market Analysis, Insights and Forecast - by Type
- 5.1.1. Ground Equipment
- 5.1.2. Services
- 5.2. Market Analysis, Insights and Forecast - by Platform
- 5.2.1. Portable
- 5.2.2. Land
- 5.2.3. Maritime
- 5.2.4. Airborne
- 5.3. Market Analysis, Insights and Forecast - by End-user Vertical
- 5.3.1. Maritime
- 5.3.2. Defense and Government
- 5.3.3. Enterprises
- 5.3.4. Media and Entertainment
- 5.3.5. Other End-user Verticals
- 5.4. Market Analysis, Insights and Forecast - by Region
- 5.4.1. North America
- 5.4.2. South America
- 5.4.3. Europe
- 5.4.4. Middle East & Africa
- 5.4.5. Asia Pacific
- 5.1. Market Analysis, Insights and Forecast - by Type
- 6. North America KSA Satellite Communications Market Analysis, Insights and Forecast, 2019-2031
- 6.1. Market Analysis, Insights and Forecast - by Type
- 6.1.1. Ground Equipment
- 6.1.2. Services
- 6.2. Market Analysis, Insights and Forecast - by Platform
- 6.2.1. Portable
- 6.2.2. Land
- 6.2.3. Maritime
- 6.2.4. Airborne
- 6.3. Market Analysis, Insights and Forecast - by End-user Vertical
- 6.3.1. Maritime
- 6.3.2. Defense and Government
- 6.3.3. Enterprises
- 6.3.4. Media and Entertainment
- 6.3.5. Other End-user Verticals
- 6.1. Market Analysis, Insights and Forecast - by Type
- 7. South America KSA Satellite Communications Market Analysis, Insights and Forecast, 2019-2031
- 7.1. Market Analysis, Insights and Forecast - by Type
- 7.1.1. Ground Equipment
- 7.1.2. Services
- 7.2. Market Analysis, Insights and Forecast - by Platform
- 7.2.1. Portable
- 7.2.2. Land
- 7.2.3. Maritime
- 7.2.4. Airborne
- 7.3. Market Analysis, Insights and Forecast - by End-user Vertical
- 7.3.1. Maritime
- 7.3.2. Defense and Government
- 7.3.3. Enterprises
- 7.3.4. Media and Entertainment
- 7.3.5. Other End-user Verticals
- 7.1. Market Analysis, Insights and Forecast - by Type
- 8. Europe KSA Satellite Communications Market Analysis, Insights and Forecast, 2019-2031
- 8.1. Market Analysis, Insights and Forecast - by Type
- 8.1.1. Ground Equipment
- 8.1.2. Services
- 8.2. Market Analysis, Insights and Forecast - by Platform
- 8.2.1. Portable
- 8.2.2. Land
- 8.2.3. Maritime
- 8.2.4. Airborne
- 8.3. Market Analysis, Insights and Forecast - by End-user Vertical
- 8.3.1. Maritime
- 8.3.2. Defense and Government
- 8.3.3. Enterprises
- 8.3.4. Media and Entertainment
- 8.3.5. Other End-user Verticals
- 8.1. Market Analysis, Insights and Forecast - by Type
- 9. Middle East & Africa KSA Satellite Communications Market Analysis, Insights and Forecast, 2019-2031
- 9.1. Market Analysis, Insights and Forecast - by Type
- 9.1.1. Ground Equipment
- 9.1.2. Services
- 9.2. Market Analysis, Insights and Forecast - by Platform
- 9.2.1. Portable
- 9.2.2. Land
- 9.2.3. Maritime
- 9.2.4. Airborne
- 9.3. Market Analysis, Insights and Forecast - by End-user Vertical
- 9.3.1. Maritime
- 9.3.2. Defense and Government
- 9.3.3. Enterprises
- 9.3.4. Media and Entertainment
- 9.3.5. Other End-user Verticals
- 9.1. Market Analysis, Insights and Forecast - by Type
- 10. Asia Pacific KSA Satellite Communications Market Analysis, Insights and Forecast, 2019-2031
- 10.1. Market Analysis, Insights and Forecast - by Type
- 10.1.1. Ground Equipment
- 10.1.2. Services
- 10.2. Market Analysis, Insights and Forecast - by Platform
- 10.2.1. Portable
- 10.2.2. Land
- 10.2.3. Maritime
- 10.2.4. Airborne
- 10.3. Market Analysis, Insights and Forecast - by End-user Vertical
- 10.3.1. Maritime
- 10.3.2. Defense and Government
- 10.3.3. Enterprises
- 10.3.4. Media and Entertainment
- 10.3.5. Other End-user Verticals
- 10.1. Market Analysis, Insights and Forecast - by Type
- 11. North America KSA Satellite Communications Market Analysis, Insights and Forecast, 2019-2031
- 11.1. Market Analysis, Insights and Forecast - By Country/Sub-region
- 11.1.1.
- 12. Europe KSA Satellite Communications Market Analysis, Insights and Forecast, 2019-2031
- 12.1. Market Analysis, Insights and Forecast - By Country/Sub-region
- 12.1.1.
- 13. Asia Pacific KSA Satellite Communications Market Analysis, Insights and Forecast, 2019-2031
- 13.1. Market Analysis, Insights and Forecast - By Country/Sub-region
- 13.1.1.
- 14. Rest of the World KSA Satellite Communications Market Analysis, Insights and Forecast, 2019-2031
- 14.1. Market Analysis, Insights and Forecast - By Country/Sub-region
- 14.1.1.
- 15. Competitive Analysis
- 15.1. Global Market Share Analysis 2024
- 15.2. Company Profiles
- 15.2.1 Vizocom
- 15.2.1.1. Overview
- 15.2.1.2. Products
- 15.2.1.3. SWOT Analysis
- 15.2.1.4. Recent Developments
- 15.2.1.5. Financials (Based on Availability)
- 15.2.2 Arab Satellite Communications Organization
- 15.2.2.1. Overview
- 15.2.2.2. Products
- 15.2.2.3. SWOT Analysis
- 15.2.2.4. Recent Developments
- 15.2.2.5. Financials (Based on Availability)
- 15.2.3 Mobile Telecommunication Company Saudi Arabia (Zain KSA)
- 15.2.3.1. Overview
- 15.2.3.2. Products
- 15.2.3.3. SWOT Analysis
- 15.2.3.4. Recent Developments
- 15.2.3.5. Financials (Based on Availability)
- 15.2.4 Saudi Broadcasting Authority
- 15.2.4.1. Overview
- 15.2.4.2. Products
- 15.2.4.3. SWOT Analysis
- 15.2.4.4. Recent Developments
- 15.2.4.5. Financials (Based on Availability)
- 15.2.5 Detecon Al Saudia Co Ltd (DETASAD)
- 15.2.5.1. Overview
- 15.2.5.2. Products
- 15.2.5.3. SWOT Analysis
- 15.2.5.4. Recent Developments
- 15.2.5.5. Financials (Based on Availability)
- 15.2.6 AXESS Networks Arabia Saudita
- 15.2.6.1. Overview
- 15.2.6.2. Products
- 15.2.6.3. SWOT Analysis
- 15.2.6.4. Recent Developments
- 15.2.6.5. Financials (Based on Availability)
- 15.2.7 Thuraya Telecommunications Company
- 15.2.7.1. Overview
- 15.2.7.2. Products
- 15.2.7.3. SWOT Analysis
- 15.2.7.4. Recent Developments
- 15.2.7.5. Financials (Based on Availability)
- 15.2.8 Saudi Telecom Company (STC)
- 15.2.8.1. Overview
- 15.2.8.2. Products
- 15.2.8.3. SWOT Analysis
- 15.2.8.4. Recent Developments
- 15.2.8.5. Financials (Based on Availability)
- 15.2.9 NOVAsat
- 15.2.9.1. Overview
- 15.2.9.2. Products
- 15.2.9.3. SWOT Analysis
- 15.2.9.4. Recent Developments
- 15.2.9.5. Financials (Based on Availability)
- 15.2.10 Salam (Integrated Telecom Company)
- 15.2.10.1. Overview
- 15.2.10.2. Products
- 15.2.10.3. SWOT Analysis
- 15.2.10.4. Recent Developments
- 15.2.10.5. Financials (Based on Availability)
- 15.2.1 Vizocom
List of Figures
- Figure 1: Global KSA Satellite Communications Market Revenue Breakdown (Million, %) by Region 2024 & 2032
- Figure 2: Global KSA Satellite Communications Market Volume Breakdown (K Unit, %) by Region 2024 & 2032
- Figure 3: North America KSA Satellite Communications Market Revenue (Million), by Country 2024 & 2032
- Figure 4: North America KSA Satellite Communications Market Volume (K Unit), by Country 2024 & 2032
- Figure 5: North America KSA Satellite Communications Market Revenue Share (%), by Country 2024 & 2032
- Figure 6: North America KSA Satellite Communications Market Volume Share (%), by Country 2024 & 2032
- Figure 7: Europe KSA Satellite Communications Market Revenue (Million), by Country 2024 & 2032
- Figure 8: Europe KSA Satellite Communications Market Volume (K Unit), by Country 2024 & 2032
- Figure 9: Europe KSA Satellite Communications Market Revenue Share (%), by Country 2024 & 2032
- Figure 10: Europe KSA Satellite Communications Market Volume Share (%), by Country 2024 & 2032
- Figure 11: Asia Pacific KSA Satellite Communications Market Revenue (Million), by Country 2024 & 2032
- Figure 12: Asia Pacific KSA Satellite Communications Market Volume (K Unit), by Country 2024 & 2032
- Figure 13: Asia Pacific KSA Satellite Communications Market Revenue Share (%), by Country 2024 & 2032
- Figure 14: Asia Pacific KSA Satellite Communications Market Volume Share (%), by Country 2024 & 2032
- Figure 15: Rest of the World KSA Satellite Communications Market Revenue (Million), by Country 2024 & 2032
- Figure 16: Rest of the World KSA Satellite Communications Market Volume (K Unit), by Country 2024 & 2032
- Figure 17: Rest of the World KSA Satellite Communications Market Revenue Share (%), by Country 2024 & 2032
- Figure 18: Rest of the World KSA Satellite Communications Market Volume Share (%), by Country 2024 & 2032
- Figure 19: North America KSA Satellite Communications Market Revenue (Million), by Type 2024 & 2032
- Figure 20: North America KSA Satellite Communications Market Volume (K Unit), by Type 2024 & 2032
- Figure 21: North America KSA Satellite Communications Market Revenue Share (%), by Type 2024 & 2032
- Figure 22: North America KSA Satellite Communications Market Volume Share (%), by Type 2024 & 2032
- Figure 23: North America KSA Satellite Communications Market Revenue (Million), by Platform 2024 & 2032
- Figure 24: North America KSA Satellite Communications Market Volume (K Unit), by Platform 2024 & 2032
- Figure 25: North America KSA Satellite Communications Market Revenue Share (%), by Platform 2024 & 2032
- Figure 26: North America KSA Satellite Communications Market Volume Share (%), by Platform 2024 & 2032
- Figure 27: North America KSA Satellite Communications Market Revenue (Million), by End-user Vertical 2024 & 2032
- Figure 28: North America KSA Satellite Communications Market Volume (K Unit), by End-user Vertical 2024 & 2032
- Figure 29: North America KSA Satellite Communications Market Revenue Share (%), by End-user Vertical 2024 & 2032
- Figure 30: North America KSA Satellite Communications Market Volume Share (%), by End-user Vertical 2024 & 2032
- Figure 31: North America KSA Satellite Communications Market Revenue (Million), by Country 2024 & 2032
- Figure 32: North America KSA Satellite Communications Market Volume (K Unit), by Country 2024 & 2032
- Figure 33: North America KSA Satellite Communications Market Revenue Share (%), by Country 2024 & 2032
- Figure 34: North America KSA Satellite Communications Market Volume Share (%), by Country 2024 & 2032
- Figure 35: South America KSA Satellite Communications Market Revenue (Million), by Type 2024 & 2032
- Figure 36: South America KSA Satellite Communications Market Volume (K Unit), by Type 2024 & 2032
- Figure 37: South America KSA Satellite Communications Market Revenue Share (%), by Type 2024 & 2032
- Figure 38: South America KSA Satellite Communications Market Volume Share (%), by Type 2024 & 2032
- Figure 39: South America KSA Satellite Communications Market Revenue (Million), by Platform 2024 & 2032
- Figure 40: South America KSA Satellite Communications Market Volume (K Unit), by Platform 2024 & 2032
- Figure 41: South America KSA Satellite Communications Market Revenue Share (%), by Platform 2024 & 2032
- Figure 42: South America KSA Satellite Communications Market Volume Share (%), by Platform 2024 & 2032
- Figure 43: South America KSA Satellite Communications Market Revenue (Million), by End-user Vertical 2024 & 2032
- Figure 44: South America KSA Satellite Communications Market Volume (K Unit), by End-user Vertical 2024 & 2032
- Figure 45: South America KSA Satellite Communications Market Revenue Share (%), by End-user Vertical 2024 & 2032
- Figure 46: South America KSA Satellite Communications Market Volume Share (%), by End-user Vertical 2024 & 2032
- Figure 47: South America KSA Satellite Communications Market Revenue (Million), by Country 2024 & 2032
- Figure 48: South America KSA Satellite Communications Market Volume (K Unit), by Country 2024 & 2032
- Figure 49: South America KSA Satellite Communications Market Revenue Share (%), by Country 2024 & 2032
- Figure 50: South America KSA Satellite Communications Market Volume Share (%), by Country 2024 & 2032
- Figure 51: Europe KSA Satellite Communications Market Revenue (Million), by Type 2024 & 2032
- Figure 52: Europe KSA Satellite Communications Market Volume (K Unit), by Type 2024 & 2032
- Figure 53: Europe KSA Satellite Communications Market Revenue Share (%), by Type 2024 & 2032
- Figure 54: Europe KSA Satellite Communications Market Volume Share (%), by Type 2024 & 2032
- Figure 55: Europe KSA Satellite Communications Market Revenue (Million), by Platform 2024 & 2032
- Figure 56: Europe KSA Satellite Communications Market Volume (K Unit), by Platform 2024 & 2032
- Figure 57: Europe KSA Satellite Communications Market Revenue Share (%), by Platform 2024 & 2032
- Figure 58: Europe KSA Satellite Communications Market Volume Share (%), by Platform 2024 & 2032
- Figure 59: Europe KSA Satellite Communications Market Revenue (Million), by End-user Vertical 2024 & 2032
- Figure 60: Europe KSA Satellite Communications Market Volume (K Unit), by End-user Vertical 2024 & 2032
- Figure 61: Europe KSA Satellite Communications Market Revenue Share (%), by End-user Vertical 2024 & 2032
- Figure 62: Europe KSA Satellite Communications Market Volume Share (%), by End-user Vertical 2024 & 2032
- Figure 63: Europe KSA Satellite Communications Market Revenue (Million), by Country 2024 & 2032
- Figure 64: Europe KSA Satellite Communications Market Volume (K Unit), by Country 2024 & 2032
- Figure 65: Europe KSA Satellite Communications Market Revenue Share (%), by Country 2024 & 2032
- Figure 66: Europe KSA Satellite Communications Market Volume Share (%), by Country 2024 & 2032
- Figure 67: Middle East & Africa KSA Satellite Communications Market Revenue (Million), by Type 2024 & 2032
- Figure 68: Middle East & Africa KSA Satellite Communications Market Volume (K Unit), by Type 2024 & 2032
- Figure 69: Middle East & Africa KSA Satellite Communications Market Revenue Share (%), by Type 2024 & 2032
- Figure 70: Middle East & Africa KSA Satellite Communications Market Volume Share (%), by Type 2024 & 2032
- Figure 71: Middle East & Africa KSA Satellite Communications Market Revenue (Million), by Platform 2024 & 2032
- Figure 72: Middle East & Africa KSA Satellite Communications Market Volume (K Unit), by Platform 2024 & 2032
- Figure 73: Middle East & Africa KSA Satellite Communications Market Revenue Share (%), by Platform 2024 & 2032
- Figure 74: Middle East & Africa KSA Satellite Communications Market Volume Share (%), by Platform 2024 & 2032
- Figure 75: Middle East & Africa KSA Satellite Communications Market Revenue (Million), by End-user Vertical 2024 & 2032
- Figure 76: Middle East & Africa KSA Satellite Communications Market Volume (K Unit), by End-user Vertical 2024 & 2032
- Figure 77: Middle East & Africa KSA Satellite Communications Market Revenue Share (%), by End-user Vertical 2024 & 2032
- Figure 78: Middle East & Africa KSA Satellite Communications Market Volume Share (%), by End-user Vertical 2024 & 2032
- Figure 79: Middle East & Africa KSA Satellite Communications Market Revenue (Million), by Country 2024 & 2032
- Figure 80: Middle East & Africa KSA Satellite Communications Market Volume (K Unit), by Country 2024 & 2032
- Figure 81: Middle East & Africa KSA Satellite Communications Market Revenue Share (%), by Country 2024 & 2032
- Figure 82: Middle East & Africa KSA Satellite Communications Market Volume Share (%), by Country 2024 & 2032
- Figure 83: Asia Pacific KSA Satellite Communications Market Revenue (Million), by Type 2024 & 2032
- Figure 84: Asia Pacific KSA Satellite Communications Market Volume (K Unit), by Type 2024 & 2032
- Figure 85: Asia Pacific KSA Satellite Communications Market Revenue Share (%), by Type 2024 & 2032
- Figure 86: Asia Pacific KSA Satellite Communications Market Volume Share (%), by Type 2024 & 2032
- Figure 87: Asia Pacific KSA Satellite Communications Market Revenue (Million), by Platform 2024 & 2032
- Figure 88: Asia Pacific KSA Satellite Communications Market Volume (K Unit), by Platform 2024 & 2032
- Figure 89: Asia Pacific KSA Satellite Communications Market Revenue Share (%), by Platform 2024 & 2032
- Figure 90: Asia Pacific KSA Satellite Communications Market Volume Share (%), by Platform 2024 & 2032
- Figure 91: Asia Pacific KSA Satellite Communications Market Revenue (Million), by End-user Vertical 2024 & 2032
- Figure 92: Asia Pacific KSA Satellite Communications Market Volume (K Unit), by End-user Vertical 2024 & 2032
- Figure 93: Asia Pacific KSA Satellite Communications Market Revenue Share (%), by End-user Vertical 2024 & 2032
- Figure 94: Asia Pacific KSA Satellite Communications Market Volume Share (%), by End-user Vertical 2024 & 2032
- Figure 95: Asia Pacific KSA Satellite Communications Market Revenue (Million), by Country 2024 & 2032
- Figure 96: Asia Pacific KSA Satellite Communications Market Volume (K Unit), by Country 2024 & 2032
- Figure 97: Asia Pacific KSA Satellite Communications Market Revenue Share (%), by Country 2024 & 2032
- Figure 98: Asia Pacific KSA Satellite Communications Market Volume Share (%), by Country 2024 & 2032
List of Tables
- Table 1: Global KSA Satellite Communications Market Revenue Million Forecast, by Region 2019 & 2032
- Table 2: Global KSA Satellite Communications Market Volume K Unit Forecast, by Region 2019 & 2032
- Table 3: Global KSA Satellite Communications Market Revenue Million Forecast, by Type 2019 & 2032
- Table 4: Global KSA Satellite Communications Market Volume K Unit Forecast, by Type 2019 & 2032
- Table 5: Global KSA Satellite Communications Market Revenue Million Forecast, by Platform 2019 & 2032
- Table 6: Global KSA Satellite Communications Market Volume K Unit Forecast, by Platform 2019 & 2032
- Table 7: Global KSA Satellite Communications Market Revenue Million Forecast, by End-user Vertical 2019 & 2032
- Table 8: Global KSA Satellite Communications Market Volume K Unit Forecast, by End-user Vertical 2019 & 2032
- Table 9: Global KSA Satellite Communications Market Revenue Million Forecast, by Region 2019 & 2032
- Table 10: Global KSA Satellite Communications Market Volume K Unit Forecast, by Region 2019 & 2032
- Table 11: Global KSA Satellite Communications Market Revenue Million Forecast, by Country 2019 & 2032
- Table 12: Global KSA Satellite Communications Market Volume K Unit Forecast, by Country 2019 & 2032
- Table 13: KSA Satellite Communications Market Revenue (Million) Forecast, by Application 2019 & 2032
- Table 14: KSA Satellite Communications Market Volume (K Unit) Forecast, by Application 2019 & 2032
- Table 15: Global KSA Satellite Communications Market Revenue Million Forecast, by Country 2019 & 2032
- Table 16: Global KSA Satellite Communications Market Volume K Unit Forecast, by Country 2019 & 2032
- Table 17: KSA Satellite Communications Market Revenue (Million) Forecast, by Application 2019 & 2032
- Table 18: KSA Satellite Communications Market Volume (K Unit) Forecast, by Application 2019 & 2032
- Table 19: Global KSA Satellite Communications Market Revenue Million Forecast, by Country 2019 & 2032
- Table 20: Global KSA Satellite Communications Market Volume K Unit Forecast, by Country 2019 & 2032
- Table 21: KSA Satellite Communications Market Revenue (Million) Forecast, by Application 2019 & 2032
- Table 22: KSA Satellite Communications Market Volume (K Unit) Forecast, by Application 2019 & 2032
- Table 23: Global KSA Satellite Communications Market Revenue Million Forecast, by Country 2019 & 2032
- Table 24: Global KSA Satellite Communications Market Volume K Unit Forecast, by Country 2019 & 2032
- Table 25: KSA Satellite Communications Market Revenue (Million) Forecast, by Application 2019 & 2032
- Table 26: KSA Satellite Communications Market Volume (K Unit) Forecast, by Application 2019 & 2032
- Table 27: Global KSA Satellite Communications Market Revenue Million Forecast, by Type 2019 & 2032
- Table 28: Global KSA Satellite Communications Market Volume K Unit Forecast, by Type 2019 & 2032
- Table 29: Global KSA Satellite Communications Market Revenue Million Forecast, by Platform 2019 & 2032
- Table 30: Global KSA Satellite Communications Market Volume K Unit Forecast, by Platform 2019 & 2032
- Table 31: Global KSA Satellite Communications Market Revenue Million Forecast, by End-user Vertical 2019 & 2032
- Table 32: Global KSA Satellite Communications Market Volume K Unit Forecast, by End-user Vertical 2019 & 2032
- Table 33: Global KSA Satellite Communications Market Revenue Million Forecast, by Country 2019 & 2032
- Table 34: Global KSA Satellite Communications Market Volume K Unit Forecast, by Country 2019 & 2032
- Table 35: United States KSA Satellite Communications Market Revenue (Million) Forecast, by Application 2019 & 2032
- Table 36: United States KSA Satellite Communications Market Volume (K Unit) Forecast, by Application 2019 & 2032
- Table 37: Canada KSA Satellite Communications Market Revenue (Million) Forecast, by Application 2019 & 2032
- Table 38: Canada KSA Satellite Communications Market Volume (K Unit) Forecast, by Application 2019 & 2032
- Table 39: Mexico KSA Satellite Communications Market Revenue (Million) Forecast, by Application 2019 & 2032
- Table 40: Mexico KSA Satellite Communications Market Volume (K Unit) Forecast, by Application 2019 & 2032
- Table 41: Global KSA Satellite Communications Market Revenue Million Forecast, by Type 2019 & 2032
- Table 42: Global KSA Satellite Communications Market Volume K Unit Forecast, by Type 2019 & 2032
- Table 43: Global KSA Satellite Communications Market Revenue Million Forecast, by Platform 2019 & 2032
- Table 44: Global KSA Satellite Communications Market Volume K Unit Forecast, by Platform 2019 & 2032
- Table 45: Global KSA Satellite Communications Market Revenue Million Forecast, by End-user Vertical 2019 & 2032
- Table 46: Global KSA Satellite Communications Market Volume K Unit Forecast, by End-user Vertical 2019 & 2032
- Table 47: Global KSA Satellite Communications Market Revenue Million Forecast, by Country 2019 & 2032
- Table 48: Global KSA Satellite Communications Market Volume K Unit Forecast, by Country 2019 & 2032
- Table 49: Brazil KSA Satellite Communications Market Revenue (Million) Forecast, by Application 2019 & 2032
- Table 50: Brazil KSA Satellite Communications Market Volume (K Unit) Forecast, by Application 2019 & 2032
- Table 51: Argentina KSA Satellite Communications Market Revenue (Million) Forecast, by Application 2019 & 2032
- Table 52: Argentina KSA Satellite Communications Market Volume (K Unit) Forecast, by Application 2019 & 2032
- Table 53: Rest of South America KSA Satellite Communications Market Revenue (Million) Forecast, by Application 2019 & 2032
- Table 54: Rest of South America KSA Satellite Communications Market Volume (K Unit) Forecast, by Application 2019 & 2032
- Table 55: Global KSA Satellite Communications Market Revenue Million Forecast, by Type 2019 & 2032
- Table 56: Global KSA Satellite Communications Market Volume K Unit Forecast, by Type 2019 & 2032
- Table 57: Global KSA Satellite Communications Market Revenue Million Forecast, by Platform 2019 & 2032
- Table 58: Global KSA Satellite Communications Market Volume K Unit Forecast, by Platform 2019 & 2032
- Table 59: Global KSA Satellite Communications Market Revenue Million Forecast, by End-user Vertical 2019 & 2032
- Table 60: Global KSA Satellite Communications Market Volume K Unit Forecast, by End-user Vertical 2019 & 2032
- Table 61: Global KSA Satellite Communications Market Revenue Million Forecast, by Country 2019 & 2032
- Table 62: Global KSA Satellite Communications Market Volume K Unit Forecast, by Country 2019 & 2032
- Table 63: United Kingdom KSA Satellite Communications Market Revenue (Million) Forecast, by Application 2019 & 2032
- Table 64: United Kingdom KSA Satellite Communications Market Volume (K Unit) Forecast, by Application 2019 & 2032
- Table 65: Germany KSA Satellite Communications Market Revenue (Million) Forecast, by Application 2019 & 2032
- Table 66: Germany KSA Satellite Communications Market Volume (K Unit) Forecast, by Application 2019 & 2032
- Table 67: France KSA Satellite Communications Market Revenue (Million) Forecast, by Application 2019 & 2032
- Table 68: France KSA Satellite Communications Market Volume (K Unit) Forecast, by Application 2019 & 2032
- Table 69: Italy KSA Satellite Communications Market Revenue (Million) Forecast, by Application 2019 & 2032
- Table 70: Italy KSA Satellite Communications Market Volume (K Unit) Forecast, by Application 2019 & 2032
- Table 71: Spain KSA Satellite Communications Market Revenue (Million) Forecast, by Application 2019 & 2032
- Table 72: Spain KSA Satellite Communications Market Volume (K Unit) Forecast, by Application 2019 & 2032
- Table 73: Russia KSA Satellite Communications Market Revenue (Million) Forecast, by Application 2019 & 2032
- Table 74: Russia KSA Satellite Communications Market Volume (K Unit) Forecast, by Application 2019 & 2032
- Table 75: Benelux KSA Satellite Communications Market Revenue (Million) Forecast, by Application 2019 & 2032
- Table 76: Benelux KSA Satellite Communications Market Volume (K Unit) Forecast, by Application 2019 & 2032
- Table 77: Nordics KSA Satellite Communications Market Revenue (Million) Forecast, by Application 2019 & 2032
- Table 78: Nordics KSA Satellite Communications Market Volume (K Unit) Forecast, by Application 2019 & 2032
- Table 79: Rest of Europe KSA Satellite Communications Market Revenue (Million) Forecast, by Application 2019 & 2032
- Table 80: Rest of Europe KSA Satellite Communications Market Volume (K Unit) Forecast, by Application 2019 & 2032
- Table 81: Global KSA Satellite Communications Market Revenue Million Forecast, by Type 2019 & 2032
- Table 82: Global KSA Satellite Communications Market Volume K Unit Forecast, by Type 2019 & 2032
- Table 83: Global KSA Satellite Communications Market Revenue Million Forecast, by Platform 2019 & 2032
- Table 84: Global KSA Satellite Communications Market Volume K Unit Forecast, by Platform 2019 & 2032
- Table 85: Global KSA Satellite Communications Market Revenue Million Forecast, by End-user Vertical 2019 & 2032
- Table 86: Global KSA Satellite Communications Market Volume K Unit Forecast, by End-user Vertical 2019 & 2032
- Table 87: Global KSA Satellite Communications Market Revenue Million Forecast, by Country 2019 & 2032
- Table 88: Global KSA Satellite Communications Market Volume K Unit Forecast, by Country 2019 & 2032
- Table 89: Turkey KSA Satellite Communications Market Revenue (Million) Forecast, by Application 2019 & 2032
- Table 90: Turkey KSA Satellite Communications Market Volume (K Unit) Forecast, by Application 2019 & 2032
- Table 91: Israel KSA Satellite Communications Market Revenue (Million) Forecast, by Application 2019 & 2032
- Table 92: Israel KSA Satellite Communications Market Volume (K Unit) Forecast, by Application 2019 & 2032
- Table 93: GCC KSA Satellite Communications Market Revenue (Million) Forecast, by Application 2019 & 2032
- Table 94: GCC KSA Satellite Communications Market Volume (K Unit) Forecast, by Application 2019 & 2032
- Table 95: North Africa KSA Satellite Communications Market Revenue (Million) Forecast, by Application 2019 & 2032
- Table 96: North Africa KSA Satellite Communications Market Volume (K Unit) Forecast, by Application 2019 & 2032
- Table 97: South Africa KSA Satellite Communications Market Revenue (Million) Forecast, by Application 2019 & 2032
- Table 98: South Africa KSA Satellite Communications Market Volume (K Unit) Forecast, by Application 2019 & 2032
- Table 99: Rest of Middle East & Africa KSA Satellite Communications Market Revenue (Million) Forecast, by Application 2019 & 2032
- Table 100: Rest of Middle East & Africa KSA Satellite Communications Market Volume (K Unit) Forecast, by Application 2019 & 2032
- Table 101: Global KSA Satellite Communications Market Revenue Million Forecast, by Type 2019 & 2032
- Table 102: Global KSA Satellite Communications Market Volume K Unit Forecast, by Type 2019 & 2032
- Table 103: Global KSA Satellite Communications Market Revenue Million Forecast, by Platform 2019 & 2032
- Table 104: Global KSA Satellite Communications Market Volume K Unit Forecast, by Platform 2019 & 2032
- Table 105: Global KSA Satellite Communications Market Revenue Million Forecast, by End-user Vertical 2019 & 2032
- Table 106: Global KSA Satellite Communications Market Volume K Unit Forecast, by End-user Vertical 2019 & 2032
- Table 107: Global KSA Satellite Communications Market Revenue Million Forecast, by Country 2019 & 2032
- Table 108: Global KSA Satellite Communications Market Volume K Unit Forecast, by Country 2019 & 2032
- Table 109: China KSA Satellite Communications Market Revenue (Million) Forecast, by Application 2019 & 2032
- Table 110: China KSA Satellite Communications Market Volume (K Unit) Forecast, by Application 2019 & 2032
- Table 111: India KSA Satellite Communications Market Revenue (Million) Forecast, by Application 2019 & 2032
- Table 112: India KSA Satellite Communications Market Volume (K Unit) Forecast, by Application 2019 & 2032
- Table 113: Japan KSA Satellite Communications Market Revenue (Million) Forecast, by Application 2019 & 2032
- Table 114: Japan KSA Satellite Communications Market Volume (K Unit) Forecast, by Application 2019 & 2032
- Table 115: South Korea KSA Satellite Communications Market Revenue (Million) Forecast, by Application 2019 & 2032
- Table 116: South Korea KSA Satellite Communications Market Volume (K Unit) Forecast, by Application 2019 & 2032
- Table 117: ASEAN KSA Satellite Communications Market Revenue (Million) Forecast, by Application 2019 & 2032
- Table 118: ASEAN KSA Satellite Communications Market Volume (K Unit) Forecast, by Application 2019 & 2032
- Table 119: Oceania KSA Satellite Communications Market Revenue (Million) Forecast, by Application 2019 & 2032
- Table 120: Oceania KSA Satellite Communications Market Volume (K Unit) Forecast, by Application 2019 & 2032
- Table 121: Rest of Asia Pacific KSA Satellite Communications Market Revenue (Million) Forecast, by Application 2019 & 2032
- Table 122: Rest of Asia Pacific KSA Satellite Communications Market Volume (K Unit) Forecast, by Application 2019 & 2032
Frequently Asked Questions
1. What is the projected Compound Annual Growth Rate (CAGR) of the KSA Satellite Communications Market?
The projected CAGR is approximately 8.47%.
2. Which companies are prominent players in the KSA Satellite Communications Market?
Key companies in the market include Vizocom, Arab Satellite Communications Organization, Mobile Telecommunication Company Saudi Arabia (Zain KSA), Saudi Broadcasting Authority, Detecon Al Saudia Co Ltd (DETASAD), AXESS Networks Arabia Saudita, Thuraya Telecommunications Company, Saudi Telecom Company (STC), NOVAsat, Salam (Integrated Telecom Company).
3. What are the main segments of the KSA Satellite Communications Market?
The market segments include Type, Platform, End-user Vertical.
4. Can you provide details about the market size?
The market size is estimated to be USD XX Million as of 2022.
5. What are some drivers contributing to market growth?
Increased Demand for Connectivity; Government Initiatives and Investments.
6. What are the notable trends driving market growth?
Increased Demand for Connectivity to Drive the Market Growth.
7. Are there any restraints impacting market growth?
Regulatory and Policy Challenges; Competition from Alternative Technologies.
8. Can you provide examples of recent developments in the market?
May 2023: Arabsat launched Arabsat Badr-8, a seventh-generation satellite built on the Airbus Eurostar Neo electric orbit boosting platform, in partnership with Airbus and SpaceX. On May 26, the satellite was launched by a SpaceX Falcon 9 from Cape Canaveral Air Force Station in Florida.
9. What pricing options are available for accessing the report?
Pricing options include single-user, multi-user, and enterprise licenses priced at USD 3800, USD 4500, and USD 5800 respectively.
10. Is the market size provided in terms of value or volume?
The market size is provided in terms of value, measured in Million and volume, measured in K Unit.
11. Are there any specific market keywords associated with the report?
Yes, the market keyword associated with the report is "KSA Satellite Communications Market," which aids in identifying and referencing the specific market segment covered.
12. How do I determine which pricing option suits my needs best?
The pricing options vary based on user requirements and access needs. Individual users may opt for single-user licenses, while businesses requiring broader access may choose multi-user or enterprise licenses for cost-effective access to the report.
13. Are there any additional resources or data provided in the KSA Satellite Communications Market report?
While the report offers comprehensive insights, it's advisable to review the specific contents or supplementary materials provided to ascertain if additional resources or data are available.
14. How can I stay updated on further developments or reports in the KSA Satellite Communications Market?
To stay informed about further developments, trends, and reports in the KSA Satellite Communications Market, consider subscribing to industry newsletters, following relevant companies and organizations, or regularly checking reputable industry news sources and publications.
Methodology
Step 1 - Identification of Relevant Samples Size from Population Database


Step 2 - Approaches for Defining Global Market Size (Value, Volume* & Price*)

Note*: In applicable scenarios
Step 3 - Data Sources
Primary Research
- Web Analytics
- Survey Reports
- Research Institute
- Latest Research Reports
- Opinion Leaders
Secondary Research
- Annual Reports
- White Paper
- Latest Press Release
- Industry Association
- Paid Database
- Investor Presentations

Step 4 - Data Triangulation
Involves using different sources of information in order to increase the validity of a study
These sources are likely to be stakeholders in a program - participants, other researchers, program staff, other community members, and so on.
Then we put all data in single framework & apply various statistical tools to find out the dynamic on the market.
During the analysis stage, feedback from the stakeholder groups would be compared to determine areas of agreement as well as areas of divergence


