

Key Insights
The Lighting as a Service (LaaS) market is projected to reach 3.5 billion by 2025, exhibiting a robust Compound Annual Growth Rate (CAGR) of 34.8%. This significant expansion is driven by the increasing demand for energy-efficient, cost-effective, and intelligent lighting solutions. Key growth catalysts include the widespread adoption of LED technology, the imperative for smart building infrastructure, and a heightened corporate focus on sustainability. LaaS models appeal to businesses due to predictable operational expenses, reduced upfront capital outlay, and substantial energy savings. The commercial sector currently dominates the market, followed by industrial and outdoor applications, as organizations prioritize energy optimization and operational efficiency. North America and Europe are leading growth, supported by advanced building technologies and stringent environmental regulations. Emerging markets in Asia-Pacific and South America are expected to witness accelerated adoption driven by urbanization and infrastructure development. Despite initial implementation costs and potential security concerns for connected systems, the long-term advantages of reduced operational expenditure and enhanced lighting control are paramount. The presence of prominent industry leaders underscores the market's maturity and considerable potential.
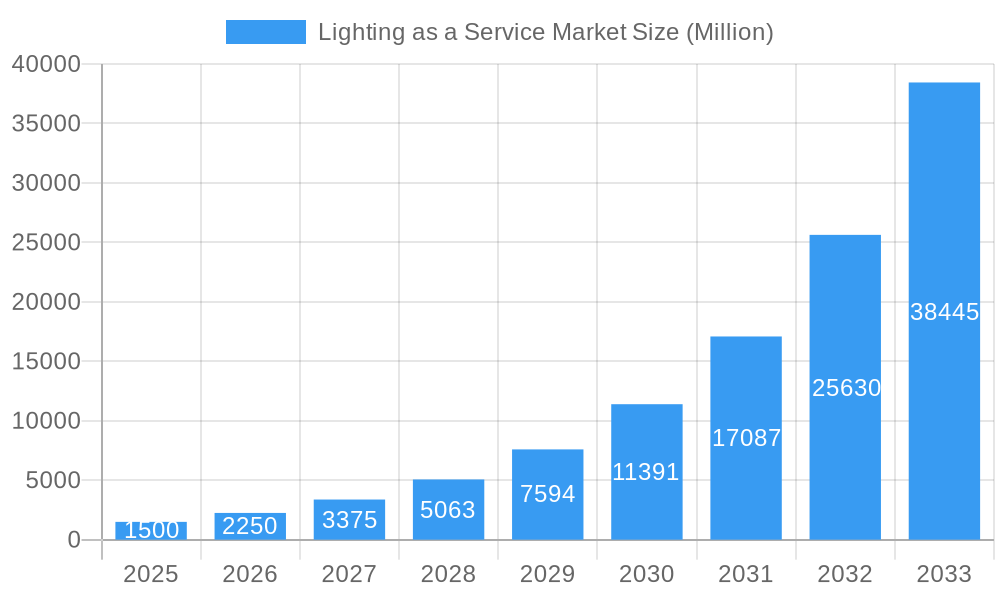
Lighting as a Service Market Market Size (In Billion)
The LaaS market trajectory is exceptionally positive, with ongoing technological advancements, including the integration of IoT and AI, poised to further accelerate growth. The global proliferation of smart city initiatives will also drive demand for intelligent lighting systems. Market segmentation is anticipated to become more specialized, with bespoke LaaS solutions catering to specific industry needs. The competitive landscape will remain dynamic, characterized by market consolidation among established players and the emergence of new entrants leveraging innovative technologies and business models. The sustained growth of this burgeoning market segment hinges on LaaS providers consistently delivering superior value through efficient service delivery and proactive customer support.
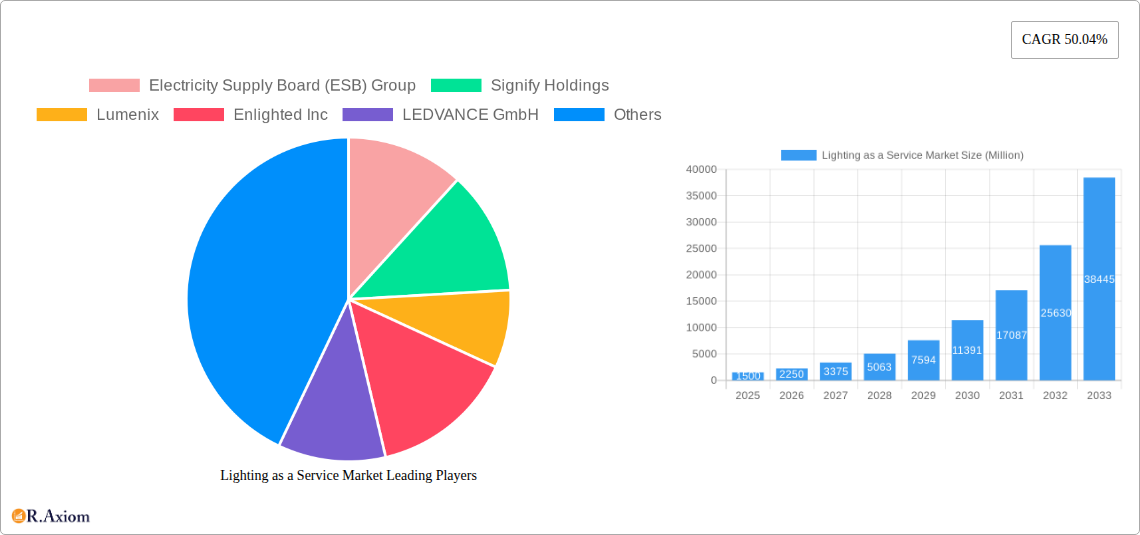
Lighting as a Service Market Company Market Share
Lighting as a Service (LaaS) Market: A Comprehensive Report (2019-2033)
This comprehensive report provides an in-depth analysis of the Lighting as a Service (LaaS) market, offering actionable insights for industry stakeholders. Covering the period from 2019 to 2033, with a base year of 2025 and a forecast period of 2025-2033, this report examines market dynamics, growth drivers, challenges, and emerging opportunities. The study delves into key segments – Commercial, Industrial, and Outdoor – and profiles leading players such as Electricity Supply Board (ESB) Group, Signify Holdings, Lumenix, Enlighted Inc, LEDVANCE GmbH, Lighthouse, Stouch Lighting, Every Watt Matters, General Electric Company, and LumenServe Inc. The report uses Million for all values.
Lighting as a Service Market Market Concentration & Innovation
The LaaS market exhibits a moderately concentrated landscape, with a few major players holding significant market share. Signify Holdings and General Electric Company, for example, leverage their established lighting expertise to dominate certain segments. However, the market is witnessing increasing competition from smaller, specialized firms focusing on niche applications or innovative service models. Innovation is a key driver, fueled by advancements in LED technology, IoT integration, smart lighting controls, and energy-efficient solutions. Regulatory frameworks, particularly those promoting energy efficiency and sustainability, are further propelling market growth. Product substitutes, such as traditional lighting systems, face decreasing market share due to the cost-effectiveness and long-term benefits of LaaS. Mergers and acquisitions (M&A) activity is expected to increase, with larger companies acquiring smaller innovative firms to expand their product portfolios and market reach. The total value of M&A deals in the LaaS market during the historical period (2019-2024) was approximately xx Million. Market share is currently estimated as follows: Signify Holdings (xx%), General Electric (xx%), and Others (xx%).
- Market Concentration: Moderately concentrated, with a few major players and many smaller competitors.
- Innovation Drivers: Advancements in LED, IoT, smart controls, energy efficiency.
- Regulatory Frameworks: Increasingly supportive of energy efficiency and sustainable solutions.
- Product Substitutes: Traditional lighting systems, declining in market share.
- End-User Trends: Growing preference for energy-efficient and cost-effective solutions.
- M&A Activity: Expected to increase, with significant deal values in the coming years.
Lighting as a Service Market Industry Trends & Insights
The LaaS market is experiencing significant growth, driven by the increasing adoption of energy-efficient lighting solutions, rising awareness of environmental sustainability, and the need for reduced operational costs for businesses. The Compound Annual Growth Rate (CAGR) for the forecast period (2025-2033) is estimated at xx%. Technological disruptions, such as the development of advanced sensors and analytics capabilities, are enhancing the functionality and value proposition of LaaS solutions. Consumer preferences are shifting towards smart and connected lighting systems that offer increased control, flexibility, and personalization. Competitive dynamics are shaped by factors like pricing strategies, service offerings, and technological innovation. Market penetration for LaaS is expected to reach xx% by 2033, signifying substantial growth within the broader lighting market. The rising adoption of cloud-based platforms and the integration of AI are further accelerating market expansion. This is also driving the development of advanced functionalities such as predictive maintenance and real-time performance monitoring, offering additional value to end-users.
Dominant Markets & Segments in Lighting as a Service Market
The Commercial segment currently holds the largest market share within the LaaS market, driven by the high concentration of businesses seeking cost-effective and energy-efficient lighting solutions. North America is expected to remain the leading region throughout the forecast period due to robust economic growth, supportive government policies and technological advancements.
- Commercial Segment: Key drivers include rising energy costs, increasing demand for energy-efficient lighting solutions, and the growing adoption of smart building technologies.
- Industrial Segment: Demand is driven by the need for enhanced workplace safety, improved operational efficiency, and reduced energy consumption in manufacturing facilities.
- Outdoor Segment: Growth is fueled by smart city initiatives, increasing urbanization, and the need for energy-efficient street and outdoor lighting solutions.
Dominance Analysis: The commercial segment's dominance stems from high adoption rates amongst businesses. This is driven by the potential for significant cost savings and enhanced operational efficiency. North America leads due to the region’s advanced technological infrastructure, high level of disposable income, and supportive government regulations.
Lighting as a Service Market Product Developments
Recent product innovations include the integration of advanced sensors and AI capabilities to enable predictive maintenance and real-time performance monitoring. These developments enhance the value proposition of LaaS by reducing downtime, optimizing energy consumption, and providing actionable data insights. The market is also witnessing the integration of LaaS solutions with other smart building technologies, creating a comprehensive and interconnected ecosystem. This integration leads to enhanced user experiences and improved operational efficiency.
Report Scope & Segmentation Analysis
This report segments the LaaS market by end-user: Commercial, Industrial, and Outdoor. The Commercial segment is projected to maintain the largest market share due to high demand. The Industrial segment is expected to witness strong growth driven by factory automation. The Outdoor segment's expansion is linked to smart city developments. Each segment presents unique competitive dynamics and growth projections. The market size for each segment varies significantly, reflecting differences in adoption rates and market maturity.
Key Drivers of Lighting as a Service Market Growth
The LaaS market's growth is driven by several key factors, including:
- Energy Efficiency: LaaS solutions deliver significant energy savings, reducing operating costs.
- Technological Advancements: IoT integration, smart controls, and AI enhance functionalities.
- Government Regulations: Incentives for energy-efficient lighting solutions boost adoption.
- Sustainability Concerns: Growing environmental consciousness drives demand for eco-friendly options.
- Reduced Maintenance Costs: Predictive maintenance capabilities minimize downtime and expenses.
Challenges in the Lighting as a Service Market Sector
Challenges include:
- High Initial Investment: The upfront cost of implementing LaaS can deter some businesses.
- Data Security Concerns: Concerns about data breaches and privacy can hinder adoption.
- Contractual complexities: Negotiating and managing long-term contracts can be complex.
- Dependence on Network Connectivity: Reliable internet connectivity is crucial for LaaS operation.
Emerging Opportunities in Lighting as a Service Market
Emerging opportunities include:
- Integration with other smart building technologies: Creating synergistic solutions.
- Expansion into new geographic markets: Reaching untapped potential in developing economies.
- Development of specialized LaaS solutions: Catering to niche market segments.
- Increased adoption of advanced analytics: Leveraging data insights for improved decision-making.
Leading Players in the Lighting as a Service Market Market
- Electricity Supply Board (ESB) Group
- Signify Holdings
- Lumenix
- Enlighted Inc
- LEDVANCE GmbH
- Lighthouse
- Stouch Lighting
- Every Watt Matters
- General Electric Company
- LumenServe Inc
Key Developments in Lighting as a Service Market Industry
- January 2023: Signify Holdings launches a new range of smart lighting solutions integrated with IoT capabilities.
- March 2022: General Electric acquires a smaller LaaS provider to expand its market presence.
- July 2021: A new energy efficiency regulation is implemented in California, boosting LaaS adoption.
Strategic Outlook for Lighting as a Service Market Market
The LaaS market is poised for continued growth, driven by technological advancements, increasing demand for energy-efficient lighting solutions, and supportive government policies. The integration of AI and advanced analytics will enhance the value proposition of LaaS, creating new opportunities for innovation and market expansion. The market’s future is bright, with substantial potential for growth in both established and emerging markets.
Lighting as a Service Market Segmentation
-
1. End User
- 1.1. Commercial
- 1.2. Outdoor
- 1.3. Industrial
Lighting as a Service Market Segmentation By Geography
- 1. North America
- 2. Europe
- 3. Asia Pacific
- 4. Latin America
- 5. Middle East
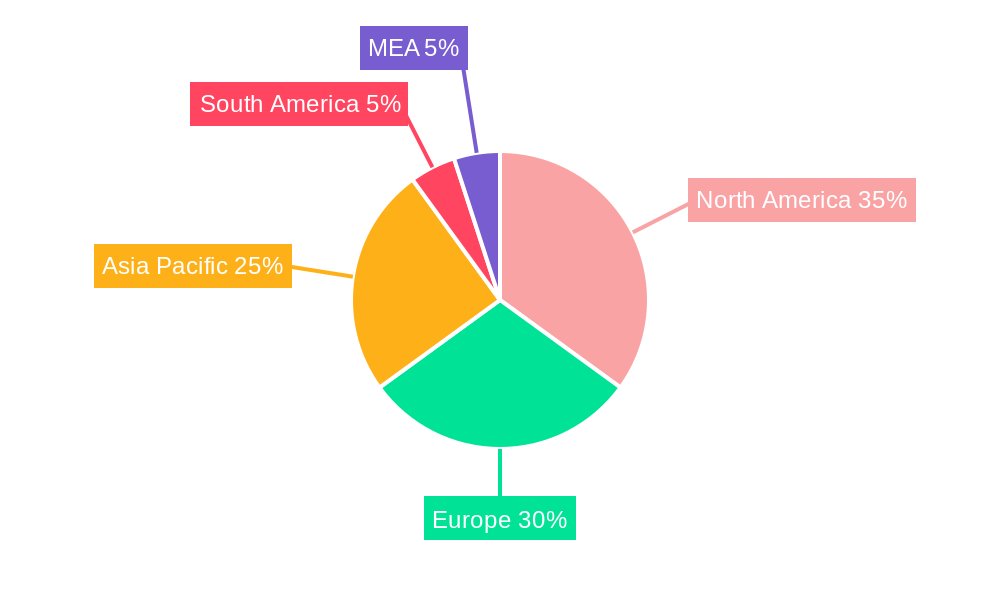
Lighting as a Service Market Regional Market Share
Geographic Coverage of Lighting as a Service Market
Lighting as a Service Market REPORT HIGHLIGHTS
| Aspects | Details |
|---|---|
| Study Period | 2020-2034 |
| Base Year | 2025 |
| Estimated Year | 2026 |
| Forecast Period | 2026-2034 |
| Historical Period | 2020-2025 |
| Growth Rate | CAGR of 34.8% from 2020-2034 |
| Segmentation |
|
Table of Contents
- 1. Introduction
- 1.1. Research Scope
- 1.2. Market Segmentation
- 1.3. Research Objective
- 1.4. Definitions and Assumptions
- 2. Executive Summary
- 2.1. Market Snapshot
- 3. Market Dynamics
- 3.1. Market Drivers
- 3.2. Market Restrains
- 3.3. Market Trends
- 3.4. Market Opportunities
- 4. Market Factor Analysis
- 4.1. Porters Five Forces
- 4.1.1. Bargaining Power of Suppliers
- 4.1.2. Bargaining Power of Buyers
- 4.1.3. Threat of New Entrants
- 4.1.4. Threat of Substitutes
- 4.1.5. Competitive Rivalry
- 4.2. PESTEL analysis
- 4.3. BCG Analysis
- 4.3.1. Stars (High Growth, High Market Share)
- 4.3.2. Cash Cows (Low Growth, High Market Share)
- 4.3.3. Question Mark (High Growth, Low Market Share)
- 4.3.4. Dogs (Low Growth, Low Market Share)
- 4.4. Ansoff Matrix Analysis
- 4.5. Supply Chain Analysis
- 4.6. Regulatory Landscape
- 4.7. Current Market Potential and Opportunity Assessment (TAM–SAM–SOM Framework)
- 4.8. RAX Analyst Note
- 4.1. Porters Five Forces
- 5. Market Analysis, Insights and Forecast 2021-2033
- 5.1. Market Analysis, Insights and Forecast - by End User
- 5.1.1. Commercial
- 5.1.2. Outdoor
- 5.1.3. Industrial
- 5.2. Market Analysis, Insights and Forecast - by Region
- 5.2.1. North America
- 5.2.2. Europe
- 5.2.3. Asia Pacific
- 5.2.4. Latin America
- 5.2.5. Middle East
- 5.1. Market Analysis, Insights and Forecast - by End User
- 6. Global Lighting as a Service Market Analysis, Insights and Forecast, 2021-2033
- 6.1. Market Analysis, Insights and Forecast - by End User
- 6.1.1. Commercial
- 6.1.2. Outdoor
- 6.1.3. Industrial
- 6.1. Market Analysis, Insights and Forecast - by End User
- 7. North America Lighting as a Service Market Analysis, Insights and Forecast, 2020-2032
- 7.1. Market Analysis, Insights and Forecast - by End User
- 7.1.1. Commercial
- 7.1.2. Outdoor
- 7.1.3. Industrial
- 7.1. Market Analysis, Insights and Forecast - by End User
- 8. Europe Lighting as a Service Market Analysis, Insights and Forecast, 2020-2032
- 8.1. Market Analysis, Insights and Forecast - by End User
- 8.1.1. Commercial
- 8.1.2. Outdoor
- 8.1.3. Industrial
- 8.1. Market Analysis, Insights and Forecast - by End User
- 9. Asia Pacific Lighting as a Service Market Analysis, Insights and Forecast, 2020-2032
- 9.1. Market Analysis, Insights and Forecast - by End User
- 9.1.1. Commercial
- 9.1.2. Outdoor
- 9.1.3. Industrial
- 9.1. Market Analysis, Insights and Forecast - by End User
- 10. Latin America Lighting as a Service Market Analysis, Insights and Forecast, 2020-2032
- 10.1. Market Analysis, Insights and Forecast - by End User
- 10.1.1. Commercial
- 10.1.2. Outdoor
- 10.1.3. Industrial
- 10.1. Market Analysis, Insights and Forecast - by End User
- 11. Middle East Lighting as a Service Market Analysis, Insights and Forecast, 2020-2032
- 11.1. Market Analysis, Insights and Forecast - by End User
- 11.1.1. Commercial
- 11.1.2. Outdoor
- 11.1.3. Industrial
- 11.1. Market Analysis, Insights and Forecast - by End User
- 12. Competitive Analysis
- 12.1. Company Profiles
- 12.1.1 Electricity Supply Board (ESB) Group
- 12.1.1.1. Company Overview
- 12.1.1.2. Products
- 12.1.1.3. Company Financials
- 12.1.1.4. SWOT Analysis
- 12.1.2 Signify Holdings
- 12.1.2.1. Company Overview
- 12.1.2.2. Products
- 12.1.2.3. Company Financials
- 12.1.2.4. SWOT Analysis
- 12.1.3 Lumenix
- 12.1.3.1. Company Overview
- 12.1.3.2. Products
- 12.1.3.3. Company Financials
- 12.1.3.4. SWOT Analysis
- 12.1.4 Enlighted Inc
- 12.1.4.1. Company Overview
- 12.1.4.2. Products
- 12.1.4.3. Company Financials
- 12.1.4.4. SWOT Analysis
- 12.1.5 LEDVANCE GmbH
- 12.1.5.1. Company Overview
- 12.1.5.2. Products
- 12.1.5.3. Company Financials
- 12.1.5.4. SWOT Analysis
- 12.1.6 Lighthouse*List Not Exhaustive
- 12.1.6.1. Company Overview
- 12.1.6.2. Products
- 12.1.6.3. Company Financials
- 12.1.6.4. SWOT Analysis
- 12.1.7 Stouch Lighting
- 12.1.7.1. Company Overview
- 12.1.7.2. Products
- 12.1.7.3. Company Financials
- 12.1.7.4. SWOT Analysis
- 12.1.8 Every Watt Matters
- 12.1.8.1. Company Overview
- 12.1.8.2. Products
- 12.1.8.3. Company Financials
- 12.1.8.4. SWOT Analysis
- 12.1.9 General Electric Company
- 12.1.9.1. Company Overview
- 12.1.9.2. Products
- 12.1.9.3. Company Financials
- 12.1.9.4. SWOT Analysis
- 12.1.10 LumenServe Inc
- 12.1.10.1. Company Overview
- 12.1.10.2. Products
- 12.1.10.3. Company Financials
- 12.1.10.4. SWOT Analysis
- 12.1.1 Electricity Supply Board (ESB) Group
- 12.2. Market Entropy
- 12.2.1 Company's Key Areas Served
- 12.2.2 Recent Developments
- 12.3. Company Market Share Analysis 2025
- 12.3.1 Top 5 Companies Market Share Analysis
- 12.3.2 Top 3 Companies Market Share Analysis
- 12.4. List of Potential Customers
- 13. Research Methodology
List of Figures
- Figure 1: Global Lighting as a Service Market Revenue Breakdown (billion, %) by Region 2025 & 2033
- Figure 2: North America Lighting as a Service Market Revenue (billion), by End User 2025 & 2033
- Figure 3: North America Lighting as a Service Market Revenue Share (%), by End User 2025 & 2033
- Figure 4: North America Lighting as a Service Market Revenue (billion), by Country 2025 & 2033
- Figure 5: North America Lighting as a Service Market Revenue Share (%), by Country 2025 & 2033
- Figure 6: Europe Lighting as a Service Market Revenue (billion), by End User 2025 & 2033
- Figure 7: Europe Lighting as a Service Market Revenue Share (%), by End User 2025 & 2033
- Figure 8: Europe Lighting as a Service Market Revenue (billion), by Country 2025 & 2033
- Figure 9: Europe Lighting as a Service Market Revenue Share (%), by Country 2025 & 2033
- Figure 10: Asia Pacific Lighting as a Service Market Revenue (billion), by End User 2025 & 2033
- Figure 11: Asia Pacific Lighting as a Service Market Revenue Share (%), by End User 2025 & 2033
- Figure 12: Asia Pacific Lighting as a Service Market Revenue (billion), by Country 2025 & 2033
- Figure 13: Asia Pacific Lighting as a Service Market Revenue Share (%), by Country 2025 & 2033
- Figure 14: Latin America Lighting as a Service Market Revenue (billion), by End User 2025 & 2033
- Figure 15: Latin America Lighting as a Service Market Revenue Share (%), by End User 2025 & 2033
- Figure 16: Latin America Lighting as a Service Market Revenue (billion), by Country 2025 & 2033
- Figure 17: Latin America Lighting as a Service Market Revenue Share (%), by Country 2025 & 2033
- Figure 18: Middle East Lighting as a Service Market Revenue (billion), by End User 2025 & 2033
- Figure 19: Middle East Lighting as a Service Market Revenue Share (%), by End User 2025 & 2033
- Figure 20: Middle East Lighting as a Service Market Revenue (billion), by Country 2025 & 2033
- Figure 21: Middle East Lighting as a Service Market Revenue Share (%), by Country 2025 & 2033
List of Tables
- Table 1: Global Lighting as a Service Market Revenue billion Forecast, by End User 2020 & 2033
- Table 2: Global Lighting as a Service Market Revenue billion Forecast, by Region 2020 & 2033
- Table 3: Global Lighting as a Service Market Revenue billion Forecast, by End User 2020 & 2033
- Table 4: Global Lighting as a Service Market Revenue billion Forecast, by Country 2020 & 2033
- Table 5: Global Lighting as a Service Market Revenue billion Forecast, by End User 2020 & 2033
- Table 6: Global Lighting as a Service Market Revenue billion Forecast, by Country 2020 & 2033
- Table 7: Global Lighting as a Service Market Revenue billion Forecast, by End User 2020 & 2033
- Table 8: Global Lighting as a Service Market Revenue billion Forecast, by Country 2020 & 2033
- Table 9: Global Lighting as a Service Market Revenue billion Forecast, by End User 2020 & 2033
- Table 10: Global Lighting as a Service Market Revenue billion Forecast, by Country 2020 & 2033
- Table 11: Global Lighting as a Service Market Revenue billion Forecast, by End User 2020 & 2033
- Table 12: Global Lighting as a Service Market Revenue billion Forecast, by Country 2020 & 2033
Frequently Asked Questions
1. What is the projected Compound Annual Growth Rate (CAGR) of the Lighting as a Service Market?
The projected CAGR is approximately 34.8%.
2. Which companies are prominent players in the Lighting as a Service Market?
Key companies in the market include Electricity Supply Board (ESB) Group, Signify Holdings, Lumenix, Enlighted Inc, LEDVANCE GmbH, Lighthouse*List Not Exhaustive, Stouch Lighting, Every Watt Matters, General Electric Company, LumenServe Inc.
3. What are the main segments of the Lighting as a Service Market?
The market segments include End User.
4. Can you provide details about the market size?
The market size is estimated to be USD 3.5 billion as of 2022.
5. What are some drivers contributing to market growth?
; Government Policies for the Adoption of Energy-efficient Lighting Systems; Adoption of IoT with Lighting Systems.
6. What are the notable trends driving market growth?
Commercial Segment to Dominate the Market.
7. Are there any restraints impacting market growth?
4.; The global shift toward renewable sources for electricity generation.
8. Can you provide examples of recent developments in the market?
N/A
9. What pricing options are available for accessing the report?
Pricing options include single-user, multi-user, and enterprise licenses priced at USD 4750, USD 5250, and USD 8750 respectively.
10. Is the market size provided in terms of value or volume?
The market size is provided in terms of value, measured in billion.
11. Are there any specific market keywords associated with the report?
Yes, the market keyword associated with the report is "Lighting as a Service Market," which aids in identifying and referencing the specific market segment covered.
12. How do I determine which pricing option suits my needs best?
The pricing options vary based on user requirements and access needs. Individual users may opt for single-user licenses, while businesses requiring broader access may choose multi-user or enterprise licenses for cost-effective access to the report.
13. Are there any additional resources or data provided in the Lighting as a Service Market report?
While the report offers comprehensive insights, it's advisable to review the specific contents or supplementary materials provided to ascertain if additional resources or data are available.
14. How can I stay updated on further developments or reports in the Lighting as a Service Market?
To stay informed about further developments, trends, and reports in the Lighting as a Service Market, consider subscribing to industry newsletters, following relevant companies and organizations, or regularly checking reputable industry news sources and publications.
Methodology
Step 1 - Identification of Relevant Samples Size from Population Database


Step 2 - Approaches for Defining Global Market Size (Value, Volume* & Price*)

Note*: In applicable scenarios
Step 3 - Data Sources
Primary Research
- Web Analytics
- Survey Reports
- Research Institute
- Latest Research Reports
- Opinion Leaders
Secondary Research
- Annual Reports
- White Paper
- Latest Press Release
- Industry Association
- Paid Database
- Investor Presentations

Step 4 - Data Triangulation
Involves using different sources of information in order to increase the validity of a study
These sources are likely to be stakeholders in a program - participants, other researchers, program staff, other community members, and so on.
Then we put all data in single framework & apply various statistical tools to find out the dynamic on the market.
During the analysis stage, feedback from the stakeholder groups would be compared to determine areas of agreement as well as areas of divergence