
Key Insights
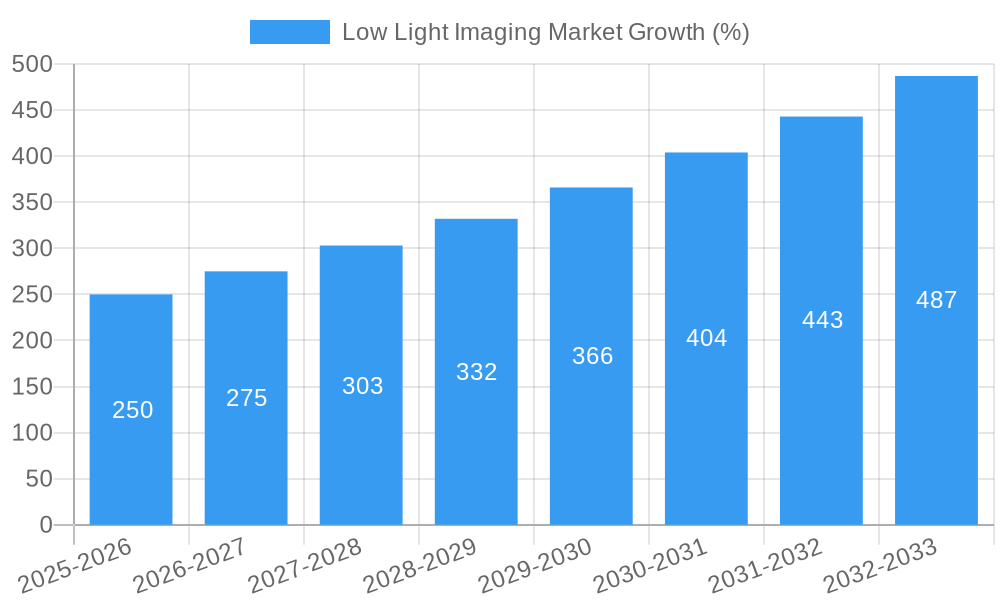
The low-light imaging market is experiencing robust growth, driven by advancements in image sensor technology, particularly CMOS sensors, and increasing demand across diverse applications. The market's Compound Annual Growth Rate (CAGR) of 10% from 2019 to 2024 indicates a significant expansion, projected to continue through 2033. Key application segments like medical imaging, security and surveillance, and scientific imaging are major contributors to this growth, fueled by the need for high-quality images in low-light conditions. The automotive sector's increasing adoption of advanced driver-assistance systems (ADAS) and autonomous vehicles is another significant driver, demanding improved night vision capabilities. Furthermore, the development of more sensitive and efficient image sensors, coupled with sophisticated image processing algorithms, is enhancing the quality and performance of low-light imaging systems. Companies like Sony, Samsung, and Teledyne are key players, constantly innovating to meet this growing demand.
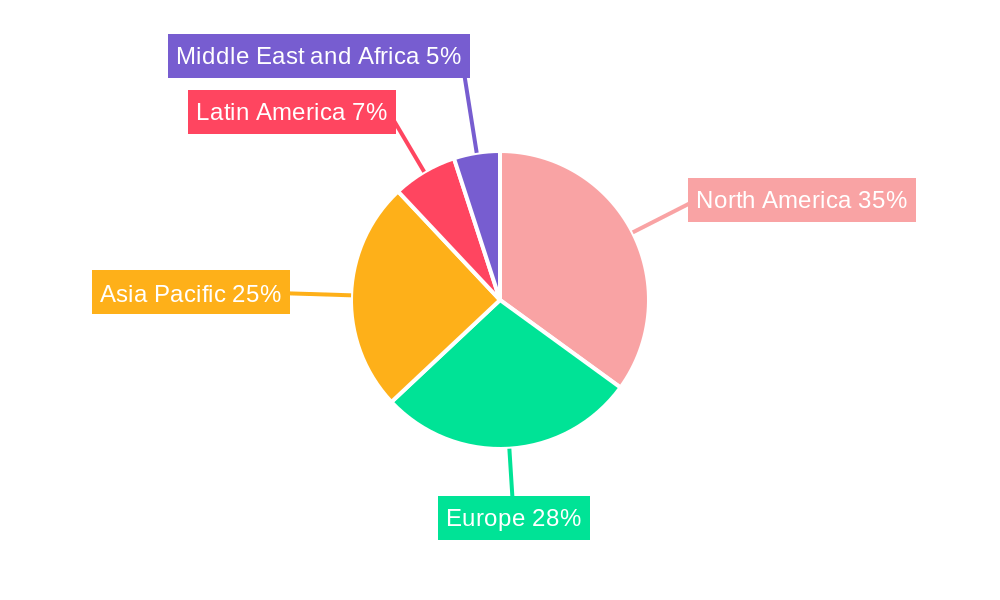
Despite the significant growth, certain restraints exist. The high cost of advanced low-light imaging technologies, particularly in specialized applications such as space imaging, can limit market penetration, especially in price-sensitive sectors. Additionally, the need for powerful computational resources to process the data from high-resolution sensors can present a technological challenge. However, ongoing research and development efforts focused on reducing costs and improving processing efficiency are expected to mitigate these limitations. The geographic distribution of the market is broad, with North America and Asia-Pacific currently holding significant shares, although developing regions are showing promising growth potential. The increasing adoption of IoT devices that require improved low-light imaging is a further positive influence.
Low Light Imaging Market: A Comprehensive Report (2019-2033)
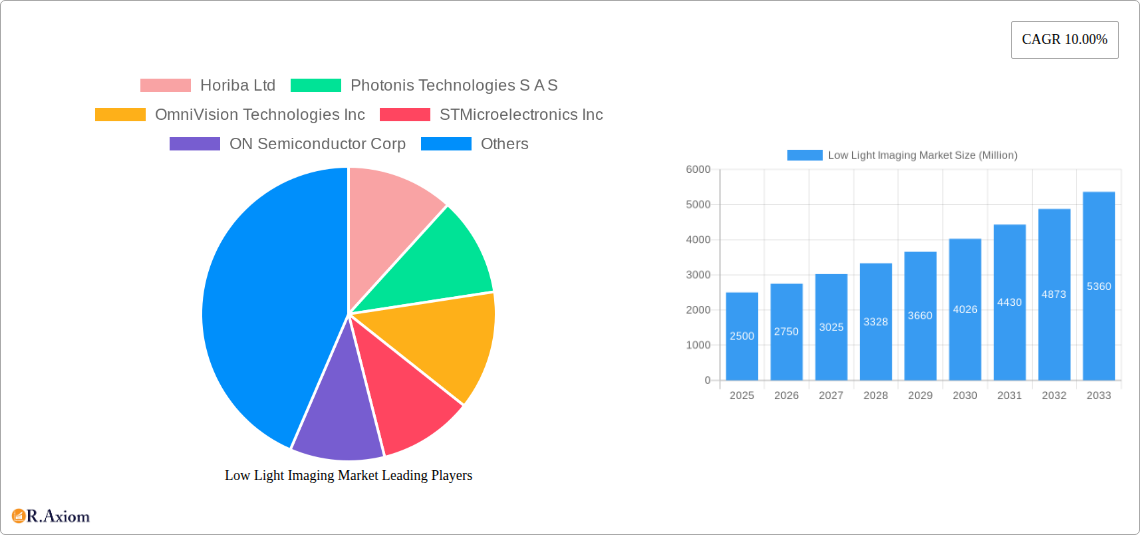
This detailed report provides a comprehensive analysis of the Low Light Imaging Market, offering actionable insights for industry stakeholders. The study period spans from 2019 to 2033, with 2025 as the base and estimated year. The forecast period covers 2025-2033, and the historical period encompasses 2019-2024. The report covers key market segments, including Type of Image Sensor (CCD and CMOS), Application (Scientific Imaging, Medical Imaging, Security and Surveillance, Space Imaging, Low Light Photography, Others), and End-user Industry (Electronics, Automotive, Military and Defense, and Others). Key players analyzed include Horiba Ltd, Photonis Technologies S A S, OmniVision Technologies Inc, STMicroelectronics Inc, ON Semiconductor Corp, Teledyne Technologies Inc, Samsung Electronics Co Ltd, Oxford Instruments (Andor), Panasonic Corporation, and Sony Corporation. The report values are expressed in Millions.
Low Light Imaging Market Concentration & Innovation
The low light imaging market exhibits a moderately concentrated landscape, with a few major players holding significant market share. The market share of the top five companies is estimated at xx% in 2025. Innovation is a key driver, fueled by advancements in sensor technology, particularly CMOS sensors, offering improved sensitivity and lower power consumption. Regulatory frameworks, such as those related to data privacy and security, particularly within the surveillance sector, play a crucial role in shaping market dynamics. Product substitutes, including enhanced software-based image processing techniques, pose a competitive challenge, but the demand for high-quality, real-time low-light imaging continues to drive market growth. End-user trends, such as the increasing adoption of smart devices and autonomous vehicles, are significantly impacting market demand. M&A activity in the sector has been moderate, with deal values totaling approximately xx Million in the last five years. Key mergers and acquisitions have focused on expanding product portfolios and strengthening technological capabilities. For instance, a key deal involved the acquisition of [Company A] by [Company B] for an estimated xx Million, significantly impacting the market dynamics in the [Specific Segment] segment.
Low Light Imaging Market Industry Trends & Insights
The low light imaging market is experiencing robust growth, with a projected Compound Annual Growth Rate (CAGR) of xx% during the forecast period (2025-2033). This growth is primarily driven by increasing demand from various applications, including security and surveillance, automotive, and medical imaging. Technological disruptions, such as the development of advanced sensor technologies with enhanced sensitivity and resolution, are pushing the boundaries of low-light imaging capabilities. Consumer preferences for high-quality imaging in low-light conditions, especially in mobile devices and personal photography, are another major factor. The market exhibits intense competitive dynamics, with major players focusing on innovation, partnerships, and strategic acquisitions to gain a competitive edge. Market penetration is high in developed regions, with emerging economies showing significant growth potential. The increasing adoption of advanced driver-assistance systems (ADAS) in the automotive sector is expected to drive substantial demand for low-light imaging technology. The market's penetration in niche sectors like space imaging and scientific research is also anticipated to grow significantly, contributing to the overall market expansion.
Dominant Markets & Segments in Low Light Imaging Market
Leading Region: North America currently holds a dominant position in the low-light imaging market due to high technological advancements and strong demand from the security and surveillance, and automotive sectors. Asia-Pacific is expected to experience substantial growth in the forecast period, driven by rising disposable incomes and increasing adoption of smart devices.
Leading Country: The United States currently dominates the global market, thanks to its strong presence of key players and technological innovation. However, China's growth potential is substantial due to its rapid technological development.
Dominant Type of Image Sensor: CMOS sensors are rapidly overtaking CCD sensors due to their advantages in terms of cost, power efficiency, and performance. The CMOS sensor segment is projected to capture over xx% of the market share by 2033.
Dominant Application: Security and surveillance currently constitutes the largest application segment. This is fueled by increasing demand for enhanced security solutions in both residential and commercial applications. Medical imaging and automotive are also key segments exhibiting significant growth trajectories.
Dominant End-user Industry: The automotive industry is a significant driver of market growth, with growing demand for ADAS and autonomous driving functionalities requiring high-performance low-light imaging solutions. The electronics industry is another significant contributor.
Key Drivers: Several factors are driving market dominance within each segment. These factors include robust government support for technological innovation (particularly in the US and China), substantial investments in infrastructure supporting the automotive and security sectors, and high consumer demand for superior image quality in a wide range of applications.
Low Light Imaging Market Product Developments
Recent product innovations focus on enhancing sensitivity, resolution, and dynamic range in low-light conditions. The development of advanced image processing algorithms and improved sensor designs with larger pixel sizes and enhanced quantum efficiency are key technological trends. These innovations aim to improve image quality, reduce noise, and extend the capabilities of low-light imaging systems, improving their market fit across various applications. New products are incorporating AI and machine learning for automatic scene recognition and improved object detection in low light.
Report Scope & Segmentation Analysis
This report provides a detailed segmentation analysis of the Low Light Imaging Market across various parameters.
Type of Image Sensor: The market is segmented into Charge-Coupled Device (CCD) and CMOS sensor (Active-Pixel Sensor). CMOS sensors are projected to show faster growth due to their cost-effectiveness and improved performance.
Application: The report segments the market by application including Scientific Imaging, Medical Imaging, Security and Surveillance, Space Imaging, Low Light Photography, and Others. Each segment's growth is analyzed based on specific drivers and challenges. The Security and Surveillance segment dominates the market currently.
End-user Industry: The market is segmented by end-user industry including Electronics, Automotive, Military and Defense, and Others. The Automotive sector is poised for significant growth due to the rising adoption of ADAS and autonomous driving technologies.
Key Drivers of Low Light Imaging Market Growth
Technological advancements in sensor technology, including improved quantum efficiency and reduced noise levels, are a significant driver. The increasing demand for enhanced security and surveillance solutions across various sectors fuels market growth. The automotive industry's shift towards advanced driver-assistance systems (ADAS) and autonomous driving necessitates high-performance low-light imaging solutions. Furthermore, the growth of the medical imaging sector with its demand for precise diagnostics is another key driver. Government regulations promoting safety and security in various domains encourage the adoption of low light imaging technology.
Challenges in the Low Light Imaging Market Sector
High manufacturing costs for advanced sensor technologies can limit market penetration. Supply chain disruptions can impact the availability of raw materials and components. Intense competition from established players and new entrants puts pressure on pricing and profitability. Stringent regulatory requirements for data privacy and security, particularly in surveillance applications, pose significant challenges. The complexity of integrating low-light imaging systems into various applications presents a technical hurdle.
Emerging Opportunities in Low Light Imaging Market
The development of advanced sensor materials and novel architectures presents significant opportunities. The increasing adoption of artificial intelligence (AI) and machine learning for image processing offers improved object detection and scene understanding. The expansion into new applications such as augmented reality (AR) and virtual reality (VR) presents growth potential. Miniaturization of low-light imaging systems creates opportunities for integration into various devices and applications. Growth in emerging markets like Asia-Pacific presents significant opportunities for expansion.
Leading Players in the Low Light Imaging Market Market
- Horiba Ltd
- Photonis Technologies S A S
- OmniVision Technologies Inc
- STMicroelectronics Inc
- ON Semiconductor Corp
- Teledyne Technologies Inc
- Samsung Electronics Co Ltd
- Oxford Instruments (Andor)
- Panasonic Corporation
- Sony Corporation
Key Developments in Low Light Imaging Market Industry
- January 2023: Company X launched a new CMOS sensor with enhanced low-light performance.
- June 2022: Company Y announced a strategic partnership to develop advanced image processing algorithms.
- October 2021: Company Z acquired Company A, expanding its portfolio of low-light imaging technologies.
- Further key developments will be detailed within the full report.
Strategic Outlook for Low Light Imaging Market Market
The low light imaging market is poised for continued growth, driven by technological innovation and increasing demand across diverse applications. The convergence of advanced sensor technologies, AI, and improved image processing algorithms will lead to enhanced image quality and improved functionality. Expansion into new markets and applications, such as AR/VR and advanced robotics, presents substantial growth opportunities. Strategic partnerships and M&A activities will play a crucial role in shaping the market landscape. Companies focusing on innovation and adapting to evolving market trends are best positioned to capitalize on future growth prospects.
Low Light Imaging Market Segmentation
-
1. Type of Image Sensor
- 1.1. Charge-Coupled Device (CCD)
- 1.2. CMOS sensor (Active-Pixel Sensor)
-
2. Application
- 2.1. Scientific Imaging
- 2.2. Medical Imaging
- 2.3. Security and Surveillance
- 2.4. Space Imaging
- 2.5. Low Light Photography
- 2.6. Others
-
3. End-user Industry
- 3.1. Electronics
- 3.2. Automotive
- 3.3. Military and Defense
- 3.4. Other End-user Industries
Low Light Imaging Market Segmentation By Geography
-
1. North America
- 1.1. United States
- 1.2. Canada
-
2. Europe
- 2.1. Germany
- 2.2. United Kingdom
- 2.3. France
- 2.4. Rest of Europe
-
3. Asia Pacific
- 3.1. India
- 3.2. China
- 3.3. Japan
- 3.4. Rest of Asia Pacific
-
4. Latin America
- 4.1. Brazil
- 4.2. Argentina
- 4.3. Rest of Latin America
-
5. Middle East and Africa
- 5.1. United Arab Emirates
- 5.2. Saudi Arabia
- 5.3. Rest of Middle East and Africa
Low Light Imaging Market REPORT HIGHLIGHTS
| Aspects | Details |
|---|---|
| Study Period | 2019-2033 |
| Base Year | 2024 |
| Estimated Year | 2025 |
| Forecast Period | 2025-2033 |
| Historical Period | 2019-2024 |
| Growth Rate | CAGR of 10.00% from 2019-2033 |
| Segmentation |
|
Table of Contents
- 1. Introduction
- 1.1. Research Scope
- 1.2. Market Segmentation
- 1.3. Research Methodology
- 1.4. Definitions and Assumptions
- 2. Executive Summary
- 2.1. Introduction
- 3. Market Dynamics
- 3.1. Introduction
- 3.2. Market Drivers
- 3.2.1. ; Increased usage of Low Light Photography in Smartphones; Enhancements in the sensor technologies and processing power; Deployment of Artificial Intelligence in the low light imaging solutions
- 3.3. Market Restrains
- 3.3.1. ; Outbreak of COVID-19 is expected disrupt the manufacturing sector
- 3.4. Market Trends
- 3.4.1. The growth usage of low light image photography in the smartphones
- 4. Market Factor Analysis
- 4.1. Porters Five Forces
- 4.2. Supply/Value Chain
- 4.3. PESTEL analysis
- 4.4. Market Entropy
- 4.5. Patent/Trademark Analysis
- 5. Global Low Light Imaging Market Analysis, Insights and Forecast, 2019-2031
- 5.1. Market Analysis, Insights and Forecast - by Type of Image Sensor
- 5.1.1. Charge-Coupled Device (CCD)
- 5.1.2. CMOS sensor (Active-Pixel Sensor)
- 5.2. Market Analysis, Insights and Forecast - by Application
- 5.2.1. Scientific Imaging
- 5.2.2. Medical Imaging
- 5.2.3. Security and Surveillance
- 5.2.4. Space Imaging
- 5.2.5. Low Light Photography
- 5.2.6. Others
- 5.3. Market Analysis, Insights and Forecast - by End-user Industry
- 5.3.1. Electronics
- 5.3.2. Automotive
- 5.3.3. Military and Defense
- 5.3.4. Other End-user Industries
- 5.4. Market Analysis, Insights and Forecast - by Region
- 5.4.1. North America
- 5.4.2. Europe
- 5.4.3. Asia Pacific
- 5.4.4. Latin America
- 5.4.5. Middle East and Africa
- 5.1. Market Analysis, Insights and Forecast - by Type of Image Sensor
- 6. North America Low Light Imaging Market Analysis, Insights and Forecast, 2019-2031
- 6.1. Market Analysis, Insights and Forecast - by Type of Image Sensor
- 6.1.1. Charge-Coupled Device (CCD)
- 6.1.2. CMOS sensor (Active-Pixel Sensor)
- 6.2. Market Analysis, Insights and Forecast - by Application
- 6.2.1. Scientific Imaging
- 6.2.2. Medical Imaging
- 6.2.3. Security and Surveillance
- 6.2.4. Space Imaging
- 6.2.5. Low Light Photography
- 6.2.6. Others
- 6.3. Market Analysis, Insights and Forecast - by End-user Industry
- 6.3.1. Electronics
- 6.3.2. Automotive
- 6.3.3. Military and Defense
- 6.3.4. Other End-user Industries
- 6.1. Market Analysis, Insights and Forecast - by Type of Image Sensor
- 7. Europe Low Light Imaging Market Analysis, Insights and Forecast, 2019-2031
- 7.1. Market Analysis, Insights and Forecast - by Type of Image Sensor
- 7.1.1. Charge-Coupled Device (CCD)
- 7.1.2. CMOS sensor (Active-Pixel Sensor)
- 7.2. Market Analysis, Insights and Forecast - by Application
- 7.2.1. Scientific Imaging
- 7.2.2. Medical Imaging
- 7.2.3. Security and Surveillance
- 7.2.4. Space Imaging
- 7.2.5. Low Light Photography
- 7.2.6. Others
- 7.3. Market Analysis, Insights and Forecast - by End-user Industry
- 7.3.1. Electronics
- 7.3.2. Automotive
- 7.3.3. Military and Defense
- 7.3.4. Other End-user Industries
- 7.1. Market Analysis, Insights and Forecast - by Type of Image Sensor
- 8. Asia Pacific Low Light Imaging Market Analysis, Insights and Forecast, 2019-2031
- 8.1. Market Analysis, Insights and Forecast - by Type of Image Sensor
- 8.1.1. Charge-Coupled Device (CCD)
- 8.1.2. CMOS sensor (Active-Pixel Sensor)
- 8.2. Market Analysis, Insights and Forecast - by Application
- 8.2.1. Scientific Imaging
- 8.2.2. Medical Imaging
- 8.2.3. Security and Surveillance
- 8.2.4. Space Imaging
- 8.2.5. Low Light Photography
- 8.2.6. Others
- 8.3. Market Analysis, Insights and Forecast - by End-user Industry
- 8.3.1. Electronics
- 8.3.2. Automotive
- 8.3.3. Military and Defense
- 8.3.4. Other End-user Industries
- 8.1. Market Analysis, Insights and Forecast - by Type of Image Sensor
- 9. Latin America Low Light Imaging Market Analysis, Insights and Forecast, 2019-2031
- 9.1. Market Analysis, Insights and Forecast - by Type of Image Sensor
- 9.1.1. Charge-Coupled Device (CCD)
- 9.1.2. CMOS sensor (Active-Pixel Sensor)
- 9.2. Market Analysis, Insights and Forecast - by Application
- 9.2.1. Scientific Imaging
- 9.2.2. Medical Imaging
- 9.2.3. Security and Surveillance
- 9.2.4. Space Imaging
- 9.2.5. Low Light Photography
- 9.2.6. Others
- 9.3. Market Analysis, Insights and Forecast - by End-user Industry
- 9.3.1. Electronics
- 9.3.2. Automotive
- 9.3.3. Military and Defense
- 9.3.4. Other End-user Industries
- 9.1. Market Analysis, Insights and Forecast - by Type of Image Sensor
- 10. Middle East and Africa Low Light Imaging Market Analysis, Insights and Forecast, 2019-2031
- 10.1. Market Analysis, Insights and Forecast - by Type of Image Sensor
- 10.1.1. Charge-Coupled Device (CCD)
- 10.1.2. CMOS sensor (Active-Pixel Sensor)
- 10.2. Market Analysis, Insights and Forecast - by Application
- 10.2.1. Scientific Imaging
- 10.2.2. Medical Imaging
- 10.2.3. Security and Surveillance
- 10.2.4. Space Imaging
- 10.2.5. Low Light Photography
- 10.2.6. Others
- 10.3. Market Analysis, Insights and Forecast - by End-user Industry
- 10.3.1. Electronics
- 10.3.2. Automotive
- 10.3.3. Military and Defense
- 10.3.4. Other End-user Industries
- 10.1. Market Analysis, Insights and Forecast - by Type of Image Sensor
- 11. North America Low Light Imaging Market Analysis, Insights and Forecast, 2019-2031
- 11.1. Market Analysis, Insights and Forecast - By Country/Sub-region
- 11.1.1 United States
- 11.1.2 Canada
- 12. Europe Low Light Imaging Market Analysis, Insights and Forecast, 2019-2031
- 12.1. Market Analysis, Insights and Forecast - By Country/Sub-region
- 12.1.1 Germany
- 12.1.2 United Kingdom
- 12.1.3 France
- 12.1.4 Rest of Europe
- 13. Asia Pacific Low Light Imaging Market Analysis, Insights and Forecast, 2019-2031
- 13.1. Market Analysis, Insights and Forecast - By Country/Sub-region
- 13.1.1 India
- 13.1.2 China
- 13.1.3 Japan
- 13.1.4 Rest of Asia Pacific
- 14. Latin America Low Light Imaging Market Analysis, Insights and Forecast, 2019-2031
- 14.1. Market Analysis, Insights and Forecast - By Country/Sub-region
- 14.1.1 Brazil
- 14.1.2 Argentina
- 14.1.3 Rest of Latin America
- 15. Middle East and Africa Low Light Imaging Market Analysis, Insights and Forecast, 2019-2031
- 15.1. Market Analysis, Insights and Forecast - By Country/Sub-region
- 15.1.1 United Arab Emirates
- 15.1.2 Saudi Arabia
- 15.1.3 Rest of Middle East and Africa
- 16. Competitive Analysis
- 16.1. Global Market Share Analysis 2024
- 16.2. Company Profiles
- 16.2.1 Horiba Ltd
- 16.2.1.1. Overview
- 16.2.1.2. Products
- 16.2.1.3. SWOT Analysis
- 16.2.1.4. Recent Developments
- 16.2.1.5. Financials (Based on Availability)
- 16.2.2 Photonis Technologies S A S
- 16.2.2.1. Overview
- 16.2.2.2. Products
- 16.2.2.3. SWOT Analysis
- 16.2.2.4. Recent Developments
- 16.2.2.5. Financials (Based on Availability)
- 16.2.3 OmniVision Technologies Inc
- 16.2.3.1. Overview
- 16.2.3.2. Products
- 16.2.3.3. SWOT Analysis
- 16.2.3.4. Recent Developments
- 16.2.3.5. Financials (Based on Availability)
- 16.2.4 STMicroelectronics Inc
- 16.2.4.1. Overview
- 16.2.4.2. Products
- 16.2.4.3. SWOT Analysis
- 16.2.4.4. Recent Developments
- 16.2.4.5. Financials (Based on Availability)
- 16.2.5 ON Semiconductor Corp
- 16.2.5.1. Overview
- 16.2.5.2. Products
- 16.2.5.3. SWOT Analysis
- 16.2.5.4. Recent Developments
- 16.2.5.5. Financials (Based on Availability)
- 16.2.6 Teledyne Technologies Inc *List Not Exhaustive
- 16.2.6.1. Overview
- 16.2.6.2. Products
- 16.2.6.3. SWOT Analysis
- 16.2.6.4. Recent Developments
- 16.2.6.5. Financials (Based on Availability)
- 16.2.7 Samsung Electronics Co Ltd
- 16.2.7.1. Overview
- 16.2.7.2. Products
- 16.2.7.3. SWOT Analysis
- 16.2.7.4. Recent Developments
- 16.2.7.5. Financials (Based on Availability)
- 16.2.8 Oxford Instruments (Andor)
- 16.2.8.1. Overview
- 16.2.8.2. Products
- 16.2.8.3. SWOT Analysis
- 16.2.8.4. Recent Developments
- 16.2.8.5. Financials (Based on Availability)
- 16.2.9 Panasonic Corporation
- 16.2.9.1. Overview
- 16.2.9.2. Products
- 16.2.9.3. SWOT Analysis
- 16.2.9.4. Recent Developments
- 16.2.9.5. Financials (Based on Availability)
- 16.2.10 Sony Corporation
- 16.2.10.1. Overview
- 16.2.10.2. Products
- 16.2.10.3. SWOT Analysis
- 16.2.10.4. Recent Developments
- 16.2.10.5. Financials (Based on Availability)
- 16.2.1 Horiba Ltd
List of Figures
- Figure 1: Global Low Light Imaging Market Revenue Breakdown (Million, %) by Region 2024 & 2032
- Figure 2: North America Low Light Imaging Market Revenue (Million), by Country 2024 & 2032
- Figure 3: North America Low Light Imaging Market Revenue Share (%), by Country 2024 & 2032
- Figure 4: Europe Low Light Imaging Market Revenue (Million), by Country 2024 & 2032
- Figure 5: Europe Low Light Imaging Market Revenue Share (%), by Country 2024 & 2032
- Figure 6: Asia Pacific Low Light Imaging Market Revenue (Million), by Country 2024 & 2032
- Figure 7: Asia Pacific Low Light Imaging Market Revenue Share (%), by Country 2024 & 2032
- Figure 8: Latin America Low Light Imaging Market Revenue (Million), by Country 2024 & 2032
- Figure 9: Latin America Low Light Imaging Market Revenue Share (%), by Country 2024 & 2032
- Figure 10: Middle East and Africa Low Light Imaging Market Revenue (Million), by Country 2024 & 2032
- Figure 11: Middle East and Africa Low Light Imaging Market Revenue Share (%), by Country 2024 & 2032
- Figure 12: North America Low Light Imaging Market Revenue (Million), by Type of Image Sensor 2024 & 2032
- Figure 13: North America Low Light Imaging Market Revenue Share (%), by Type of Image Sensor 2024 & 2032
- Figure 14: North America Low Light Imaging Market Revenue (Million), by Application 2024 & 2032
- Figure 15: North America Low Light Imaging Market Revenue Share (%), by Application 2024 & 2032
- Figure 16: North America Low Light Imaging Market Revenue (Million), by End-user Industry 2024 & 2032
- Figure 17: North America Low Light Imaging Market Revenue Share (%), by End-user Industry 2024 & 2032
- Figure 18: North America Low Light Imaging Market Revenue (Million), by Country 2024 & 2032
- Figure 19: North America Low Light Imaging Market Revenue Share (%), by Country 2024 & 2032
- Figure 20: Europe Low Light Imaging Market Revenue (Million), by Type of Image Sensor 2024 & 2032
- Figure 21: Europe Low Light Imaging Market Revenue Share (%), by Type of Image Sensor 2024 & 2032
- Figure 22: Europe Low Light Imaging Market Revenue (Million), by Application 2024 & 2032
- Figure 23: Europe Low Light Imaging Market Revenue Share (%), by Application 2024 & 2032
- Figure 24: Europe Low Light Imaging Market Revenue (Million), by End-user Industry 2024 & 2032
- Figure 25: Europe Low Light Imaging Market Revenue Share (%), by End-user Industry 2024 & 2032
- Figure 26: Europe Low Light Imaging Market Revenue (Million), by Country 2024 & 2032
- Figure 27: Europe Low Light Imaging Market Revenue Share (%), by Country 2024 & 2032
- Figure 28: Asia Pacific Low Light Imaging Market Revenue (Million), by Type of Image Sensor 2024 & 2032
- Figure 29: Asia Pacific Low Light Imaging Market Revenue Share (%), by Type of Image Sensor 2024 & 2032
- Figure 30: Asia Pacific Low Light Imaging Market Revenue (Million), by Application 2024 & 2032
- Figure 31: Asia Pacific Low Light Imaging Market Revenue Share (%), by Application 2024 & 2032
- Figure 32: Asia Pacific Low Light Imaging Market Revenue (Million), by End-user Industry 2024 & 2032
- Figure 33: Asia Pacific Low Light Imaging Market Revenue Share (%), by End-user Industry 2024 & 2032
- Figure 34: Asia Pacific Low Light Imaging Market Revenue (Million), by Country 2024 & 2032
- Figure 35: Asia Pacific Low Light Imaging Market Revenue Share (%), by Country 2024 & 2032
- Figure 36: Latin America Low Light Imaging Market Revenue (Million), by Type of Image Sensor 2024 & 2032
- Figure 37: Latin America Low Light Imaging Market Revenue Share (%), by Type of Image Sensor 2024 & 2032
- Figure 38: Latin America Low Light Imaging Market Revenue (Million), by Application 2024 & 2032
- Figure 39: Latin America Low Light Imaging Market Revenue Share (%), by Application 2024 & 2032
- Figure 40: Latin America Low Light Imaging Market Revenue (Million), by End-user Industry 2024 & 2032
- Figure 41: Latin America Low Light Imaging Market Revenue Share (%), by End-user Industry 2024 & 2032
- Figure 42: Latin America Low Light Imaging Market Revenue (Million), by Country 2024 & 2032
- Figure 43: Latin America Low Light Imaging Market Revenue Share (%), by Country 2024 & 2032
- Figure 44: Middle East and Africa Low Light Imaging Market Revenue (Million), by Type of Image Sensor 2024 & 2032
- Figure 45: Middle East and Africa Low Light Imaging Market Revenue Share (%), by Type of Image Sensor 2024 & 2032
- Figure 46: Middle East and Africa Low Light Imaging Market Revenue (Million), by Application 2024 & 2032
- Figure 47: Middle East and Africa Low Light Imaging Market Revenue Share (%), by Application 2024 & 2032
- Figure 48: Middle East and Africa Low Light Imaging Market Revenue (Million), by End-user Industry 2024 & 2032
- Figure 49: Middle East and Africa Low Light Imaging Market Revenue Share (%), by End-user Industry 2024 & 2032
- Figure 50: Middle East and Africa Low Light Imaging Market Revenue (Million), by Country 2024 & 2032
- Figure 51: Middle East and Africa Low Light Imaging Market Revenue Share (%), by Country 2024 & 2032
List of Tables
- Table 1: Global Low Light Imaging Market Revenue Million Forecast, by Region 2019 & 2032
- Table 2: Global Low Light Imaging Market Revenue Million Forecast, by Type of Image Sensor 2019 & 2032
- Table 3: Global Low Light Imaging Market Revenue Million Forecast, by Application 2019 & 2032
- Table 4: Global Low Light Imaging Market Revenue Million Forecast, by End-user Industry 2019 & 2032
- Table 5: Global Low Light Imaging Market Revenue Million Forecast, by Region 2019 & 2032
- Table 6: Global Low Light Imaging Market Revenue Million Forecast, by Country 2019 & 2032
- Table 7: United States Low Light Imaging Market Revenue (Million) Forecast, by Application 2019 & 2032
- Table 8: Canada Low Light Imaging Market Revenue (Million) Forecast, by Application 2019 & 2032
- Table 9: Global Low Light Imaging Market Revenue Million Forecast, by Country 2019 & 2032
- Table 10: Germany Low Light Imaging Market Revenue (Million) Forecast, by Application 2019 & 2032
- Table 11: United Kingdom Low Light Imaging Market Revenue (Million) Forecast, by Application 2019 & 2032
- Table 12: France Low Light Imaging Market Revenue (Million) Forecast, by Application 2019 & 2032
- Table 13: Rest of Europe Low Light Imaging Market Revenue (Million) Forecast, by Application 2019 & 2032
- Table 14: Global Low Light Imaging Market Revenue Million Forecast, by Country 2019 & 2032
- Table 15: India Low Light Imaging Market Revenue (Million) Forecast, by Application 2019 & 2032
- Table 16: China Low Light Imaging Market Revenue (Million) Forecast, by Application 2019 & 2032
- Table 17: Japan Low Light Imaging Market Revenue (Million) Forecast, by Application 2019 & 2032
- Table 18: Rest of Asia Pacific Low Light Imaging Market Revenue (Million) Forecast, by Application 2019 & 2032
- Table 19: Global Low Light Imaging Market Revenue Million Forecast, by Country 2019 & 2032
- Table 20: Brazil Low Light Imaging Market Revenue (Million) Forecast, by Application 2019 & 2032
- Table 21: Argentina Low Light Imaging Market Revenue (Million) Forecast, by Application 2019 & 2032
- Table 22: Rest of Latin America Low Light Imaging Market Revenue (Million) Forecast, by Application 2019 & 2032
- Table 23: Global Low Light Imaging Market Revenue Million Forecast, by Country 2019 & 2032
- Table 24: United Arab Emirates Low Light Imaging Market Revenue (Million) Forecast, by Application 2019 & 2032
- Table 25: Saudi Arabia Low Light Imaging Market Revenue (Million) Forecast, by Application 2019 & 2032
- Table 26: Rest of Middle East and Africa Low Light Imaging Market Revenue (Million) Forecast, by Application 2019 & 2032
- Table 27: Global Low Light Imaging Market Revenue Million Forecast, by Type of Image Sensor 2019 & 2032
- Table 28: Global Low Light Imaging Market Revenue Million Forecast, by Application 2019 & 2032
- Table 29: Global Low Light Imaging Market Revenue Million Forecast, by End-user Industry 2019 & 2032
- Table 30: Global Low Light Imaging Market Revenue Million Forecast, by Country 2019 & 2032
- Table 31: United States Low Light Imaging Market Revenue (Million) Forecast, by Application 2019 & 2032
- Table 32: Canada Low Light Imaging Market Revenue (Million) Forecast, by Application 2019 & 2032
- Table 33: Global Low Light Imaging Market Revenue Million Forecast, by Type of Image Sensor 2019 & 2032
- Table 34: Global Low Light Imaging Market Revenue Million Forecast, by Application 2019 & 2032
- Table 35: Global Low Light Imaging Market Revenue Million Forecast, by End-user Industry 2019 & 2032
- Table 36: Global Low Light Imaging Market Revenue Million Forecast, by Country 2019 & 2032
- Table 37: Germany Low Light Imaging Market Revenue (Million) Forecast, by Application 2019 & 2032
- Table 38: United Kingdom Low Light Imaging Market Revenue (Million) Forecast, by Application 2019 & 2032
- Table 39: France Low Light Imaging Market Revenue (Million) Forecast, by Application 2019 & 2032
- Table 40: Rest of Europe Low Light Imaging Market Revenue (Million) Forecast, by Application 2019 & 2032
- Table 41: Global Low Light Imaging Market Revenue Million Forecast, by Type of Image Sensor 2019 & 2032
- Table 42: Global Low Light Imaging Market Revenue Million Forecast, by Application 2019 & 2032
- Table 43: Global Low Light Imaging Market Revenue Million Forecast, by End-user Industry 2019 & 2032
- Table 44: Global Low Light Imaging Market Revenue Million Forecast, by Country 2019 & 2032
- Table 45: India Low Light Imaging Market Revenue (Million) Forecast, by Application 2019 & 2032
- Table 46: China Low Light Imaging Market Revenue (Million) Forecast, by Application 2019 & 2032
- Table 47: Japan Low Light Imaging Market Revenue (Million) Forecast, by Application 2019 & 2032
- Table 48: Rest of Asia Pacific Low Light Imaging Market Revenue (Million) Forecast, by Application 2019 & 2032
- Table 49: Global Low Light Imaging Market Revenue Million Forecast, by Type of Image Sensor 2019 & 2032
- Table 50: Global Low Light Imaging Market Revenue Million Forecast, by Application 2019 & 2032
- Table 51: Global Low Light Imaging Market Revenue Million Forecast, by End-user Industry 2019 & 2032
- Table 52: Global Low Light Imaging Market Revenue Million Forecast, by Country 2019 & 2032
- Table 53: Brazil Low Light Imaging Market Revenue (Million) Forecast, by Application 2019 & 2032
- Table 54: Argentina Low Light Imaging Market Revenue (Million) Forecast, by Application 2019 & 2032
- Table 55: Rest of Latin America Low Light Imaging Market Revenue (Million) Forecast, by Application 2019 & 2032
- Table 56: Global Low Light Imaging Market Revenue Million Forecast, by Type of Image Sensor 2019 & 2032
- Table 57: Global Low Light Imaging Market Revenue Million Forecast, by Application 2019 & 2032
- Table 58: Global Low Light Imaging Market Revenue Million Forecast, by End-user Industry 2019 & 2032
- Table 59: Global Low Light Imaging Market Revenue Million Forecast, by Country 2019 & 2032
- Table 60: United Arab Emirates Low Light Imaging Market Revenue (Million) Forecast, by Application 2019 & 2032
- Table 61: Saudi Arabia Low Light Imaging Market Revenue (Million) Forecast, by Application 2019 & 2032
- Table 62: Rest of Middle East and Africa Low Light Imaging Market Revenue (Million) Forecast, by Application 2019 & 2032
Frequently Asked Questions
1. What is the projected Compound Annual Growth Rate (CAGR) of the Low Light Imaging Market?
The projected CAGR is approximately 10.00%.
2. Which companies are prominent players in the Low Light Imaging Market?
Key companies in the market include Horiba Ltd, Photonis Technologies S A S, OmniVision Technologies Inc, STMicroelectronics Inc, ON Semiconductor Corp, Teledyne Technologies Inc *List Not Exhaustive, Samsung Electronics Co Ltd, Oxford Instruments (Andor), Panasonic Corporation, Sony Corporation.
3. What are the main segments of the Low Light Imaging Market?
The market segments include Type of Image Sensor, Application, End-user Industry.
4. Can you provide details about the market size?
The market size is estimated to be USD XX Million as of 2022.
5. What are some drivers contributing to market growth?
; Increased usage of Low Light Photography in Smartphones; Enhancements in the sensor technologies and processing power; Deployment of Artificial Intelligence in the low light imaging solutions.
6. What are the notable trends driving market growth?
The growth usage of low light image photography in the smartphones.
7. Are there any restraints impacting market growth?
; Outbreak of COVID-19 is expected disrupt the manufacturing sector.
8. Can you provide examples of recent developments in the market?
N/A
9. What pricing options are available for accessing the report?
Pricing options include single-user, multi-user, and enterprise licenses priced at USD 4750, USD 5250, and USD 8750 respectively.
10. Is the market size provided in terms of value or volume?
The market size is provided in terms of value, measured in Million.
11. Are there any specific market keywords associated with the report?
Yes, the market keyword associated with the report is "Low Light Imaging Market," which aids in identifying and referencing the specific market segment covered.
12. How do I determine which pricing option suits my needs best?
The pricing options vary based on user requirements and access needs. Individual users may opt for single-user licenses, while businesses requiring broader access may choose multi-user or enterprise licenses for cost-effective access to the report.
13. Are there any additional resources or data provided in the Low Light Imaging Market report?
While the report offers comprehensive insights, it's advisable to review the specific contents or supplementary materials provided to ascertain if additional resources or data are available.
14. How can I stay updated on further developments or reports in the Low Light Imaging Market?
To stay informed about further developments, trends, and reports in the Low Light Imaging Market, consider subscribing to industry newsletters, following relevant companies and organizations, or regularly checking reputable industry news sources and publications.
Methodology
Step 1 - Identification of Relevant Samples Size from Population Database


Step 2 - Approaches for Defining Global Market Size (Value, Volume* & Price*)

Note*: In applicable scenarios
Step 3 - Data Sources
Primary Research
- Web Analytics
- Survey Reports
- Research Institute
- Latest Research Reports
- Opinion Leaders
Secondary Research
- Annual Reports
- White Paper
- Latest Press Release
- Industry Association
- Paid Database
- Investor Presentations

Step 4 - Data Triangulation
Involves using different sources of information in order to increase the validity of a study
These sources are likely to be stakeholders in a program - participants, other researchers, program staff, other community members, and so on.
Then we put all data in single framework & apply various statistical tools to find out the dynamic on the market.
During the analysis stage, feedback from the stakeholder groups would be compared to determine areas of agreement as well as areas of divergence


