
Key Insights
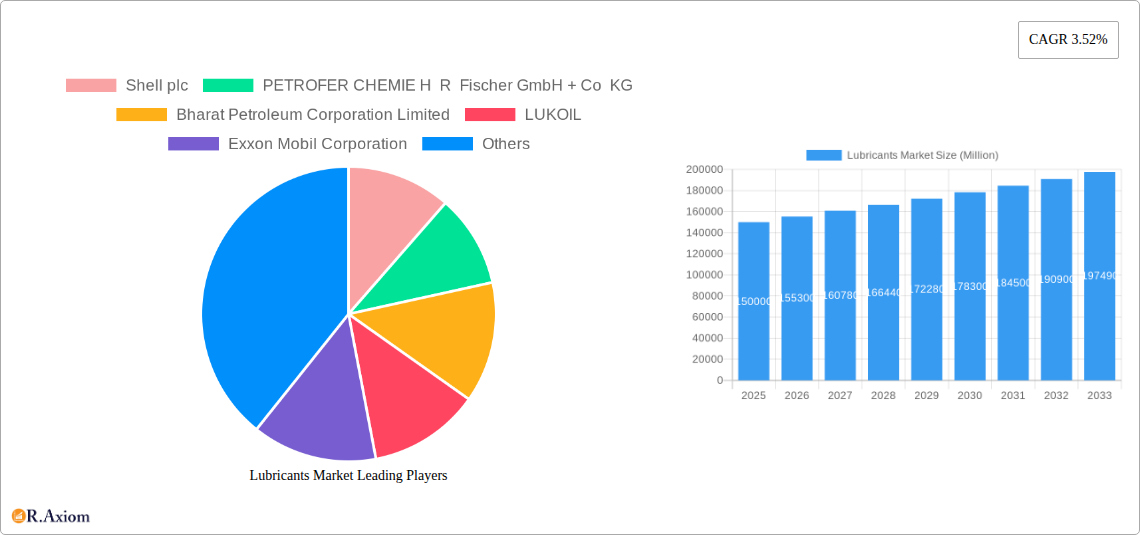
The global lubricants market, valued at approximately $150 billion in 2025, is projected to experience steady growth, driven by a compound annual growth rate (CAGR) of 3.52% from 2025 to 2033. This expansion is fueled by several key factors. The automotive sector, encompassing both passenger vehicles and heavy-duty transportation, remains a significant driver, with increasing vehicle production and the rising demand for high-performance lubricants contributing to market growth. Furthermore, the growth of industrial sectors such as power generation, manufacturing (particularly metallurgy and metalworking), and food and beverage processing necessitates the continued use of specialized lubricants, fostering market expansion. The increasing adoption of synthetic and bio-based lubricants, driven by environmental concerns and advancements in lubricant technology, further contributes to the market's positive trajectory. While the market faces challenges, such as fluctuating crude oil prices and stringent environmental regulations impacting the production and use of certain lubricants, the overall growth outlook remains positive, driven by sustained industrial growth and technological advancements.
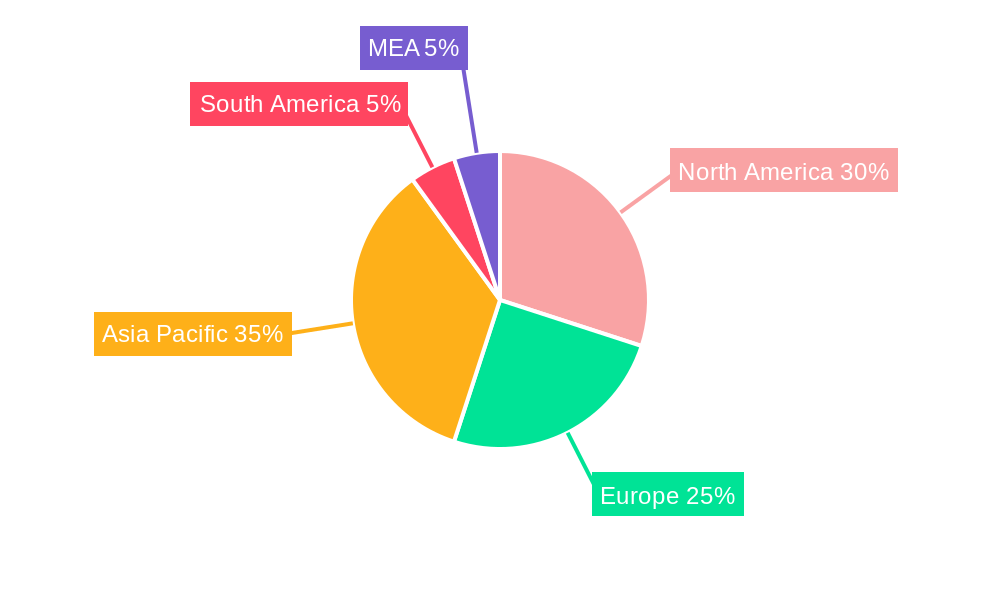
Regional variations in market growth are expected. North America and Europe are anticipated to hold significant market shares, owing to established automotive and industrial sectors. However, the Asia-Pacific region is projected to experience the fastest growth, fueled by rapid industrialization and increasing vehicle ownership in developing economies like India and China. The market segmentation, encompassing various product types (engine oil, gear oil, greases, etc.) and end-user industries, presents diverse growth opportunities. Major players like Shell, ExxonMobil, and Fuchs are engaged in strategic partnerships, acquisitions, and product innovation to maintain their market position and capitalize on emerging trends. The increasing focus on sustainable and environmentally friendly lubricants is expected to shape market dynamics in the coming years, favoring bio-based and high-performance alternatives.
Lubricants Market: A Comprehensive Report (2019-2033)
This detailed report provides a comprehensive analysis of the global lubricants market, offering actionable insights for industry stakeholders. Covering the period from 2019 to 2033, with a base year of 2025, this study unveils market dynamics, growth drivers, and future opportunities. The report examines key segments, including base stock types, product types, and end-user industries, while profiling major players like Shell plc, ExxonMobil, and others.
Lubricants Market Concentration & Innovation
The global lubricants market exhibits a moderately concentrated structure, with a few major players holding significant market share. However, the presence of numerous regional and specialized lubricant manufacturers fosters competition. Innovation is driven by the need for enhanced performance, reduced environmental impact, and extended lubricant life. Stringent environmental regulations, particularly concerning emissions and waste disposal, are shaping product development. Bio-based lubricants are emerging as a significant area of innovation, driven by environmental concerns and potential cost advantages. Product substitution is primarily driven by advancements in synthetic lubricants which offer superior performance compared to mineral oils. End-user trends increasingly favor high-performance, specialized lubricants tailored to specific applications. Mergers and acquisitions (M&A) play a crucial role in market consolidation and expansion, as evidenced by recent transactions like Shell's acquisition of MIDEL and MIVOLT in 2024.
- Market Share: Top 5 players hold approximately xx% of the global market share (2024).
- M&A Activity: Total M&A deal value in the lubricants sector from 2019-2024 totaled approximately $xx Million. (Note: This figure is an estimate.)
- Key Innovation Areas: Bio-based lubricants, enhanced performance additives, and improved waste management systems.
Lubricants Market Industry Trends & Insights
The lubricants market is experiencing robust growth, with a projected Compound Annual Growth Rate (CAGR) of xx% during the forecast period (2025-2033). This growth is fueled by several key factors. The increasing demand from the automotive and transportation sectors, driven by the growth in vehicle ownership and the expansion of the global fleet, is a primary driver. Industrialization and infrastructure development in emerging economies contribute significantly to market expansion. Technological advancements such as the development of higher-efficiency engines and advanced manufacturing processes drive demand for specialized lubricants. Consumer preferences are shifting towards eco-friendly and sustainable lubricants, creating opportunities for bio-based and environmentally friendly product offerings. Furthermore, the intense competition among key players is pushing innovation and driving down prices, thus benefiting consumers. Market penetration of synthetic lubricants is steadily increasing, replacing traditional mineral oils in various applications due to their superior performance and longevity.

Dominant Markets & Segments in Lubricants Market
The automotive and other transportation sector is the dominant end-user industry for lubricants, accounting for approximately xx% of global market share in 2024. Asia-Pacific is the leading regional market, fueled by rapid economic growth and industrialization. Within product types, engine oil constitutes the largest segment due to widespread vehicle usage. In base stock types, mineral oil lubricants still maintain a large share, but synthetic lubricants are witnessing rapid growth due to their superior performance characteristics.
- Key Drivers of Dominance (Asia-Pacific): Rapid industrialization, rising vehicle ownership, expanding infrastructure projects.
- Key Drivers of Dominance (Automotive Sector): Growth in global vehicle sales, rising fleet size, and the increasing demand for high-performance vehicles.
- Detailed Dominance Analysis: Paragraphs detailing the specific market dynamics driving the dominance of these segments and regions, including competitive landscape, pricing, and regulatory influences. (Note: Further market research would be needed to fill in specific numerical data and detailed analysis.)
Lubricants Market Product Developments
Recent product developments focus on enhancing lubricant performance, extending their lifespan, and improving their environmental profile. This includes the introduction of energy-efficient formulations, lubricants designed for specific engine types (e.g., hybrid vehicles), and bio-based alternatives. Manufacturers are emphasizing product differentiation through specialized formulations catering to diverse application needs, thus strengthening their competitive advantage. The integration of advanced nanomaterials and additives further contributes to the performance enhancement of modern lubricants.
Report Scope & Segmentation Analysis
This report segments the lubricants market across multiple dimensions:
- Group: Group I, Group II, Group III, Group IV, Group V (Each paragraph would detail the market size, growth projections, and competitive dynamics of each Group)
- Base Stock: Mineral Oil Lubricant, Synthetic Lubricant, Semi-synthetic Lubricant, Bio-based Lubricant (Each paragraph would detail the market size, growth projections, and competitive dynamics of each base stock type)
- Product Type: Engine Oil, Transmission and Hydraulic Fluid, Metalworking Fluid, General Industrial Oil, Gear Oil, Grease, Process Oil, Other Product Types (Each paragraph would detail the market size, growth projections, and competitive dynamics of each product type)
- End-user Industry: Power Generation, Automotive and Other Transportation, Heavy Equipment, Food and Beverage, Metallurgy and Metalworking, Chemical Manufacturing, Other End-user Industries (Packaging, Oil, and Gas) (Each paragraph would detail the market size, growth projections, and competitive dynamics of each end-user industry).
Key Drivers of Lubricants Market Growth
The lubricants market's growth is driven by several factors: the expanding automotive sector, rising industrialization in emerging economies, stricter environmental regulations prompting the adoption of eco-friendly lubricants, and the continuous development of advanced lubricant technologies enhancing efficiency and performance. Increased infrastructure investment in developing nations further stimulates demand for industrial lubricants. Government regulations promoting energy efficiency also impact the market positively.
Challenges in the Lubricants Market Sector
The lubricants industry faces challenges such as fluctuating crude oil prices affecting raw material costs, intense competition among numerous players, stringent environmental regulations demanding compliance with emission standards, and the potential volatility of global supply chains. The industry also faces complexities in managing waste disposal and lubricant recycling. These factors affect profitability and require strategic adaptation.
Emerging Opportunities in Lubricants Market
Emerging opportunities include the growth of the renewable energy sector demanding specialized lubricants, the increasing adoption of electric and hybrid vehicles requiring specific lubricant formulations, and the rising demand for high-performance lubricants in advanced manufacturing processes. Expanding into new geographical markets, particularly in developing countries, presents significant growth potential. Further innovation in bio-based and sustainable lubricants will create new market opportunities.
Leading Players in the Lubricants Market Market
- Shell plc
- PETROFER CHEMIE H R Fischer GmbH + Co KG
- Bharat Petroleum Corporation Limited
- LUKOIL
- Exxon Mobil Corporation
- AMSOIL INC
- Petromin
- Hindustan Petroleum Corporation Limited
- PT Pertamina Lubricants
- China National Petroleum Corporation (PetroChina)
- Kluber Lubrication München GmbH & Co KG
- ENEOS Corporation
- FUCHS
- Motul
- Petrobras
- Repsol
- Gazprom Neft PJSC
- BASF SE
- Illinois Tool Works Inc (ROCOL)
- Chevron Corporation
- Valvoline LLC
- TotalEnergies
- Petroliam Nasional Berhad
- Idemitsu Kosan Co Ltd
- Carl Bechem GmbH
- China Petrochemical Corporation (Sinopec)
- Phillips 66 Company
- Eni SpA
- SK Lubricants Co Ltd
- Veedol International Limited
- Indian Oil Corporation Ltd
- BP p l c
- Blaser Swisslube
- Gulf Oil Corporation Limited
Key Developments in Lubricants Market Industry
- Sep 2023: ENSO Oils & Lubricants partnered with Gazpromneft-Lubricants to expand lubricant distribution in South Asia.
- Oct 2023: HPCL and Chevron Corporation formed a long-term agreement for the licensing, production, distribution, and marketing of Chevron's lubricant products in India.
- Jan 2024: Shell Lubricants acquired MIDEL and MIVOLT, expanding its global lubricant portfolio.
Strategic Outlook for Lubricants Market Market
The lubricants market is poised for continued growth, driven by technological advancements, expanding industrialization, and the rising demand for high-performance lubricants across various sectors. Strategic investments in research and development, focusing on sustainable and eco-friendly options, will be crucial for long-term success. Further expansion into emerging markets and strategic partnerships will be key for market leadership.
Lubricants Market Segmentation
-
1. Group
- 1.1. Group I
- 1.2. Group II
- 1.3. Group III
- 1.4. Group IV
- 1.5. Group V
-
2. Base Stock
- 2.1. Mineral Oil Lubricant
- 2.2. Synthetic Lubricant
- 2.3. Semi-synthetic Lubricant
- 2.4. Bio-based Lubricant
-
3. Product Type
- 3.1. Engine Oil
- 3.2. Transmission and Hydraulic Fluid
- 3.3. Metalworking Fluid
- 3.4. General Industrial Oil
- 3.5. Gear Oil
- 3.6. Grease
- 3.7. Process Oil
- 3.8. Other Product Types
-
4. End-user Industry
- 4.1. Power Generation
- 4.2. Automotive and Other Transportation
- 4.3. Heavy Equipment
- 4.4. Food and Beverage
- 4.5. Metallurgy and Metalworking
- 4.6. Chemical Manufacturing
- 4.7. Other En
Lubricants Market Segmentation By Geography
-
1. Asia Pacific
- 1.1. China
- 1.2. India
- 1.3. Japan
- 1.4. South Korea
- 1.5. Philippines
- 1.6. Indonesia
- 1.7. Malaysia
- 1.8. Thailand
- 1.9. Vietnam
- 1.10. Rest of Asia Pacific
-
2. North America
- 2.1. United States
- 2.2. Canada
- 2.3. Mexico
-
3. Europe
- 3.1. Germany
- 3.2. United Kingdom
- 3.3. Italy
- 3.4. France
- 3.5. Russia
- 3.6. Turkey
- 3.7. Spain
- 3.8. Rest of Europe
-
4. South America
- 4.1. Brazil
- 4.2. Argentina
- 4.3. Chile
- 4.4. Colombia
- 4.5. Rest of South America
-
5. Middle East
- 5.1. Saudi Arabia
- 5.2. Iran
- 5.3. Iraq
- 5.4. United Arab Emirates
- 5.5. Kuwait
- 5.6. Rest of the Middle East
-
6. Africa
- 6.1. Egypt
- 6.2. South Africa
- 6.3. Nigeria
- 6.4. Algeria
- 6.5. Morocco
- 6.6. Rest of Africa
Lubricants Market REPORT HIGHLIGHTS
| Aspects | Details |
|---|---|
| Study Period | 2019-2033 |
| Base Year | 2024 |
| Estimated Year | 2025 |
| Forecast Period | 2025-2033 |
| Historical Period | 2019-2024 |
| Growth Rate | CAGR of 3.52% from 2019-2033 |
| Segmentation |
|
Table of Contents
- 1. Introduction
- 1.1. Research Scope
- 1.2. Market Segmentation
- 1.3. Research Methodology
- 1.4. Definitions and Assumptions
- 2. Executive Summary
- 2.1. Introduction
- 3. Market Dynamics
- 3.1. Introduction
- 3.2. Market Drivers
- 3.2.1. Increasing Usage of High-performance Lubricants; Demand from the Growing Wind Energy Sector; Expansion of the Global Cold Chain Market
- 3.3. Market Restrains
- 3.3.1. Increasing Drain Intervals in the Automotive and Industrial Sectors; Modest Impact of Electric Vehicles (EVs) in the Future
- 3.4. Market Trends
- 3.4.1. Automotive and Other Transportation Segment to Dominate the Market
- 4. Market Factor Analysis
- 4.1. Porters Five Forces
- 4.2. Supply/Value Chain
- 4.3. PESTEL analysis
- 4.4. Market Entropy
- 4.5. Patent/Trademark Analysis
- 5. Global Lubricants Market Analysis, Insights and Forecast, 2019-2031
- 5.1. Market Analysis, Insights and Forecast - by Group
- 5.1.1. Group I
- 5.1.2. Group II
- 5.1.3. Group III
- 5.1.4. Group IV
- 5.1.5. Group V
- 5.2. Market Analysis, Insights and Forecast - by Base Stock
- 5.2.1. Mineral Oil Lubricant
- 5.2.2. Synthetic Lubricant
- 5.2.3. Semi-synthetic Lubricant
- 5.2.4. Bio-based Lubricant
- 5.3. Market Analysis, Insights and Forecast - by Product Type
- 5.3.1. Engine Oil
- 5.3.2. Transmission and Hydraulic Fluid
- 5.3.3. Metalworking Fluid
- 5.3.4. General Industrial Oil
- 5.3.5. Gear Oil
- 5.3.6. Grease
- 5.3.7. Process Oil
- 5.3.8. Other Product Types
- 5.4. Market Analysis, Insights and Forecast - by End-user Industry
- 5.4.1. Power Generation
- 5.4.2. Automotive and Other Transportation
- 5.4.3. Heavy Equipment
- 5.4.4. Food and Beverage
- 5.4.5. Metallurgy and Metalworking
- 5.4.6. Chemical Manufacturing
- 5.4.7. Other En
- 5.5. Market Analysis, Insights and Forecast - by Region
- 5.5.1. Asia Pacific
- 5.5.2. North America
- 5.5.3. Europe
- 5.5.4. South America
- 5.5.5. Middle East
- 5.5.6. Africa
- 5.1. Market Analysis, Insights and Forecast - by Group
- 6. Asia Pacific Lubricants Market Analysis, Insights and Forecast, 2019-2031
- 6.1. Market Analysis, Insights and Forecast - by Group
- 6.1.1. Group I
- 6.1.2. Group II
- 6.1.3. Group III
- 6.1.4. Group IV
- 6.1.5. Group V
- 6.2. Market Analysis, Insights and Forecast - by Base Stock
- 6.2.1. Mineral Oil Lubricant
- 6.2.2. Synthetic Lubricant
- 6.2.3. Semi-synthetic Lubricant
- 6.2.4. Bio-based Lubricant
- 6.3. Market Analysis, Insights and Forecast - by Product Type
- 6.3.1. Engine Oil
- 6.3.2. Transmission and Hydraulic Fluid
- 6.3.3. Metalworking Fluid
- 6.3.4. General Industrial Oil
- 6.3.5. Gear Oil
- 6.3.6. Grease
- 6.3.7. Process Oil
- 6.3.8. Other Product Types
- 6.4. Market Analysis, Insights and Forecast - by End-user Industry
- 6.4.1. Power Generation
- 6.4.2. Automotive and Other Transportation
- 6.4.3. Heavy Equipment
- 6.4.4. Food and Beverage
- 6.4.5. Metallurgy and Metalworking
- 6.4.6. Chemical Manufacturing
- 6.4.7. Other En
- 6.1. Market Analysis, Insights and Forecast - by Group
- 7. North America Lubricants Market Analysis, Insights and Forecast, 2019-2031
- 7.1. Market Analysis, Insights and Forecast - by Group
- 7.1.1. Group I
- 7.1.2. Group II
- 7.1.3. Group III
- 7.1.4. Group IV
- 7.1.5. Group V
- 7.2. Market Analysis, Insights and Forecast - by Base Stock
- 7.2.1. Mineral Oil Lubricant
- 7.2.2. Synthetic Lubricant
- 7.2.3. Semi-synthetic Lubricant
- 7.2.4. Bio-based Lubricant
- 7.3. Market Analysis, Insights and Forecast - by Product Type
- 7.3.1. Engine Oil
- 7.3.2. Transmission and Hydraulic Fluid
- 7.3.3. Metalworking Fluid
- 7.3.4. General Industrial Oil
- 7.3.5. Gear Oil
- 7.3.6. Grease
- 7.3.7. Process Oil
- 7.3.8. Other Product Types
- 7.4. Market Analysis, Insights and Forecast - by End-user Industry
- 7.4.1. Power Generation
- 7.4.2. Automotive and Other Transportation
- 7.4.3. Heavy Equipment
- 7.4.4. Food and Beverage
- 7.4.5. Metallurgy and Metalworking
- 7.4.6. Chemical Manufacturing
- 7.4.7. Other En
- 7.1. Market Analysis, Insights and Forecast - by Group
- 8. Europe Lubricants Market Analysis, Insights and Forecast, 2019-2031
- 8.1. Market Analysis, Insights and Forecast - by Group
- 8.1.1. Group I
- 8.1.2. Group II
- 8.1.3. Group III
- 8.1.4. Group IV
- 8.1.5. Group V
- 8.2. Market Analysis, Insights and Forecast - by Base Stock
- 8.2.1. Mineral Oil Lubricant
- 8.2.2. Synthetic Lubricant
- 8.2.3. Semi-synthetic Lubricant
- 8.2.4. Bio-based Lubricant
- 8.3. Market Analysis, Insights and Forecast - by Product Type
- 8.3.1. Engine Oil
- 8.3.2. Transmission and Hydraulic Fluid
- 8.3.3. Metalworking Fluid
- 8.3.4. General Industrial Oil
- 8.3.5. Gear Oil
- 8.3.6. Grease
- 8.3.7. Process Oil
- 8.3.8. Other Product Types
- 8.4. Market Analysis, Insights and Forecast - by End-user Industry
- 8.4.1. Power Generation
- 8.4.2. Automotive and Other Transportation
- 8.4.3. Heavy Equipment
- 8.4.4. Food and Beverage
- 8.4.5. Metallurgy and Metalworking
- 8.4.6. Chemical Manufacturing
- 8.4.7. Other En
- 8.1. Market Analysis, Insights and Forecast - by Group
- 9. South America Lubricants Market Analysis, Insights and Forecast, 2019-2031
- 9.1. Market Analysis, Insights and Forecast - by Group
- 9.1.1. Group I
- 9.1.2. Group II
- 9.1.3. Group III
- 9.1.4. Group IV
- 9.1.5. Group V
- 9.2. Market Analysis, Insights and Forecast - by Base Stock
- 9.2.1. Mineral Oil Lubricant
- 9.2.2. Synthetic Lubricant
- 9.2.3. Semi-synthetic Lubricant
- 9.2.4. Bio-based Lubricant
- 9.3. Market Analysis, Insights and Forecast - by Product Type
- 9.3.1. Engine Oil
- 9.3.2. Transmission and Hydraulic Fluid
- 9.3.3. Metalworking Fluid
- 9.3.4. General Industrial Oil
- 9.3.5. Gear Oil
- 9.3.6. Grease
- 9.3.7. Process Oil
- 9.3.8. Other Product Types
- 9.4. Market Analysis, Insights and Forecast - by End-user Industry
- 9.4.1. Power Generation
- 9.4.2. Automotive and Other Transportation
- 9.4.3. Heavy Equipment
- 9.4.4. Food and Beverage
- 9.4.5. Metallurgy and Metalworking
- 9.4.6. Chemical Manufacturing
- 9.4.7. Other En
- 9.1. Market Analysis, Insights and Forecast - by Group
- 10. Middle East Lubricants Market Analysis, Insights and Forecast, 2019-2031
- 10.1. Market Analysis, Insights and Forecast - by Group
- 10.1.1. Group I
- 10.1.2. Group II
- 10.1.3. Group III
- 10.1.4. Group IV
- 10.1.5. Group V
- 10.2. Market Analysis, Insights and Forecast - by Base Stock
- 10.2.1. Mineral Oil Lubricant
- 10.2.2. Synthetic Lubricant
- 10.2.3. Semi-synthetic Lubricant
- 10.2.4. Bio-based Lubricant
- 10.3. Market Analysis, Insights and Forecast - by Product Type
- 10.3.1. Engine Oil
- 10.3.2. Transmission and Hydraulic Fluid
- 10.3.3. Metalworking Fluid
- 10.3.4. General Industrial Oil
- 10.3.5. Gear Oil
- 10.3.6. Grease
- 10.3.7. Process Oil
- 10.3.8. Other Product Types
- 10.4. Market Analysis, Insights and Forecast - by End-user Industry
- 10.4.1. Power Generation
- 10.4.2. Automotive and Other Transportation
- 10.4.3. Heavy Equipment
- 10.4.4. Food and Beverage
- 10.4.5. Metallurgy and Metalworking
- 10.4.6. Chemical Manufacturing
- 10.4.7. Other En
- 10.1. Market Analysis, Insights and Forecast - by Group
- 11. Africa Lubricants Market Analysis, Insights and Forecast, 2019-2031
- 11.1. Market Analysis, Insights and Forecast - by Group
- 11.1.1. Group I
- 11.1.2. Group II
- 11.1.3. Group III
- 11.1.4. Group IV
- 11.1.5. Group V
- 11.2. Market Analysis, Insights and Forecast - by Base Stock
- 11.2.1. Mineral Oil Lubricant
- 11.2.2. Synthetic Lubricant
- 11.2.3. Semi-synthetic Lubricant
- 11.2.4. Bio-based Lubricant
- 11.3. Market Analysis, Insights and Forecast - by Product Type
- 11.3.1. Engine Oil
- 11.3.2. Transmission and Hydraulic Fluid
- 11.3.3. Metalworking Fluid
- 11.3.4. General Industrial Oil
- 11.3.5. Gear Oil
- 11.3.6. Grease
- 11.3.7. Process Oil
- 11.3.8. Other Product Types
- 11.4. Market Analysis, Insights and Forecast - by End-user Industry
- 11.4.1. Power Generation
- 11.4.2. Automotive and Other Transportation
- 11.4.3. Heavy Equipment
- 11.4.4. Food and Beverage
- 11.4.5. Metallurgy and Metalworking
- 11.4.6. Chemical Manufacturing
- 11.4.7. Other En
- 11.1. Market Analysis, Insights and Forecast - by Group
- 12. North America Lubricants Market Analysis, Insights and Forecast, 2019-2031
- 12.1. Market Analysis, Insights and Forecast - By Country/Sub-region
- 12.1.1 United States
- 12.1.2 Canada
- 12.1.3 Mexico
- 13. Europe Lubricants Market Analysis, Insights and Forecast, 2019-2031
- 13.1. Market Analysis, Insights and Forecast - By Country/Sub-region
- 13.1.1 Germany
- 13.1.2 United Kingdom
- 13.1.3 France
- 13.1.4 Spain
- 13.1.5 Italy
- 13.1.6 Spain
- 13.1.7 Belgium
- 13.1.8 Netherland
- 13.1.9 Nordics
- 13.1.10 Rest of Europe
- 14. Asia Pacific Lubricants Market Analysis, Insights and Forecast, 2019-2031
- 14.1. Market Analysis, Insights and Forecast - By Country/Sub-region
- 14.1.1 China
- 14.1.2 Japan
- 14.1.3 India
- 14.1.4 South Korea
- 14.1.5 Southeast Asia
- 14.1.6 Australia
- 14.1.7 Indonesia
- 14.1.8 Phillipes
- 14.1.9 Singapore
- 14.1.10 Thailandc
- 14.1.11 Rest of Asia Pacific
- 15. South America Lubricants Market Analysis, Insights and Forecast, 2019-2031
- 15.1. Market Analysis, Insights and Forecast - By Country/Sub-region
- 15.1.1 Brazil
- 15.1.2 Argentina
- 15.1.3 Peru
- 15.1.4 Chile
- 15.1.5 Colombia
- 15.1.6 Ecuador
- 15.1.7 Venezuela
- 15.1.8 Rest of South America
- 16. North America Lubricants Market Analysis, Insights and Forecast, 2019-2031
- 16.1. Market Analysis, Insights and Forecast - By Country/Sub-region
- 16.1.1 United States
- 16.1.2 Canada
- 16.1.3 Mexico
- 17. MEA Lubricants Market Analysis, Insights and Forecast, 2019-2031
- 17.1. Market Analysis, Insights and Forecast - By Country/Sub-region
- 17.1.1 United Arab Emirates
- 17.1.2 Saudi Arabia
- 17.1.3 South Africa
- 17.1.4 Rest of Middle East and Africa
- 18. Competitive Analysis
- 18.1. Global Market Share Analysis 2024
- 18.2. Company Profiles
- 18.2.1 Shell plc
- 18.2.1.1. Overview
- 18.2.1.2. Products
- 18.2.1.3. SWOT Analysis
- 18.2.1.4. Recent Developments
- 18.2.1.5. Financials (Based on Availability)
- 18.2.2 PETROFER CHEMIE H R Fischer GmbH + Co KG
- 18.2.2.1. Overview
- 18.2.2.2. Products
- 18.2.2.3. SWOT Analysis
- 18.2.2.4. Recent Developments
- 18.2.2.5. Financials (Based on Availability)
- 18.2.3 Bharat Petroleum Corporation Limited
- 18.2.3.1. Overview
- 18.2.3.2. Products
- 18.2.3.3. SWOT Analysis
- 18.2.3.4. Recent Developments
- 18.2.3.5. Financials (Based on Availability)
- 18.2.4 LUKOIL
- 18.2.4.1. Overview
- 18.2.4.2. Products
- 18.2.4.3. SWOT Analysis
- 18.2.4.4. Recent Developments
- 18.2.4.5. Financials (Based on Availability)
- 18.2.5 Exxon Mobil Corporation
- 18.2.5.1. Overview
- 18.2.5.2. Products
- 18.2.5.3. SWOT Analysis
- 18.2.5.4. Recent Developments
- 18.2.5.5. Financials (Based on Availability)
- 18.2.6 AMSOIL INC
- 18.2.6.1. Overview
- 18.2.6.2. Products
- 18.2.6.3. SWOT Analysis
- 18.2.6.4. Recent Developments
- 18.2.6.5. Financials (Based on Availability)
- 18.2.7 Petromin
- 18.2.7.1. Overview
- 18.2.7.2. Products
- 18.2.7.3. SWOT Analysis
- 18.2.7.4. Recent Developments
- 18.2.7.5. Financials (Based on Availability)
- 18.2.8 Hindustan Petroleum Corporation Limited
- 18.2.8.1. Overview
- 18.2.8.2. Products
- 18.2.8.3. SWOT Analysis
- 18.2.8.4. Recent Developments
- 18.2.8.5. Financials (Based on Availability)
- 18.2.9 PT Pertamina Lubricants
- 18.2.9.1. Overview
- 18.2.9.2. Products
- 18.2.9.3. SWOT Analysis
- 18.2.9.4. Recent Developments
- 18.2.9.5. Financials (Based on Availability)
- 18.2.10 China National Petroleum Corporation (PetroChina)
- 18.2.10.1. Overview
- 18.2.10.2. Products
- 18.2.10.3. SWOT Analysis
- 18.2.10.4. Recent Developments
- 18.2.10.5. Financials (Based on Availability)
- 18.2.11 Kluber Lubrication München GmbH & Co KG
- 18.2.11.1. Overview
- 18.2.11.2. Products
- 18.2.11.3. SWOT Analysis
- 18.2.11.4. Recent Developments
- 18.2.11.5. Financials (Based on Availability)
- 18.2.12 ENEOS Corporation
- 18.2.12.1. Overview
- 18.2.12.2. Products
- 18.2.12.3. SWOT Analysis
- 18.2.12.4. Recent Developments
- 18.2.12.5. Financials (Based on Availability)
- 18.2.13 FUCHS
- 18.2.13.1. Overview
- 18.2.13.2. Products
- 18.2.13.3. SWOT Analysis
- 18.2.13.4. Recent Developments
- 18.2.13.5. Financials (Based on Availability)
- 18.2.14 Motul
- 18.2.14.1. Overview
- 18.2.14.2. Products
- 18.2.14.3. SWOT Analysis
- 18.2.14.4. Recent Developments
- 18.2.14.5. Financials (Based on Availability)
- 18.2.15 Petrobras
- 18.2.15.1. Overview
- 18.2.15.2. Products
- 18.2.15.3. SWOT Analysis
- 18.2.15.4. Recent Developments
- 18.2.15.5. Financials (Based on Availability)
- 18.2.16 Repsol
- 18.2.16.1. Overview
- 18.2.16.2. Products
- 18.2.16.3. SWOT Analysis
- 18.2.16.4. Recent Developments
- 18.2.16.5. Financials (Based on Availability)
- 18.2.17 Gazprom Neft PJSC
- 18.2.17.1. Overview
- 18.2.17.2. Products
- 18.2.17.3. SWOT Analysis
- 18.2.17.4. Recent Developments
- 18.2.17.5. Financials (Based on Availability)
- 18.2.18 BASF SE
- 18.2.18.1. Overview
- 18.2.18.2. Products
- 18.2.18.3. SWOT Analysis
- 18.2.18.4. Recent Developments
- 18.2.18.5. Financials (Based on Availability)
- 18.2.19 Illinois Tool Works Inc (ROCOL)
- 18.2.19.1. Overview
- 18.2.19.2. Products
- 18.2.19.3. SWOT Analysis
- 18.2.19.4. Recent Developments
- 18.2.19.5. Financials (Based on Availability)
- 18.2.20 Chevron Corporation
- 18.2.20.1. Overview
- 18.2.20.2. Products
- 18.2.20.3. SWOT Analysis
- 18.2.20.4. Recent Developments
- 18.2.20.5. Financials (Based on Availability)
- 18.2.21 Valvoline LLC*List Not Exhaustive
- 18.2.21.1. Overview
- 18.2.21.2. Products
- 18.2.21.3. SWOT Analysis
- 18.2.21.4. Recent Developments
- 18.2.21.5. Financials (Based on Availability)
- 18.2.22 TotalEnergies
- 18.2.22.1. Overview
- 18.2.22.2. Products
- 18.2.22.3. SWOT Analysis
- 18.2.22.4. Recent Developments
- 18.2.22.5. Financials (Based on Availability)
- 18.2.23 Petroliam Nasional Berhad
- 18.2.23.1. Overview
- 18.2.23.2. Products
- 18.2.23.3. SWOT Analysis
- 18.2.23.4. Recent Developments
- 18.2.23.5. Financials (Based on Availability)
- 18.2.24 Idemitsu Kosan Co Ltd
- 18.2.24.1. Overview
- 18.2.24.2. Products
- 18.2.24.3. SWOT Analysis
- 18.2.24.4. Recent Developments
- 18.2.24.5. Financials (Based on Availability)
- 18.2.25 Carl Bechem GmbH
- 18.2.25.1. Overview
- 18.2.25.2. Products
- 18.2.25.3. SWOT Analysis
- 18.2.25.4. Recent Developments
- 18.2.25.5. Financials (Based on Availability)
- 18.2.26 China Petrochemical Corporation (Sinopec)
- 18.2.26.1. Overview
- 18.2.26.2. Products
- 18.2.26.3. SWOT Analysis
- 18.2.26.4. Recent Developments
- 18.2.26.5. Financials (Based on Availability)
- 18.2.27 Phillips 66 Company
- 18.2.27.1. Overview
- 18.2.27.2. Products
- 18.2.27.3. SWOT Analysis
- 18.2.27.4. Recent Developments
- 18.2.27.5. Financials (Based on Availability)
- 18.2.28 Eni SpA
- 18.2.28.1. Overview
- 18.2.28.2. Products
- 18.2.28.3. SWOT Analysis
- 18.2.28.4. Recent Developments
- 18.2.28.5. Financials (Based on Availability)
- 18.2.29 SK Lubricants Co Ltd
- 18.2.29.1. Overview
- 18.2.29.2. Products
- 18.2.29.3. SWOT Analysis
- 18.2.29.4. Recent Developments
- 18.2.29.5. Financials (Based on Availability)
- 18.2.30 Veedol International Limited
- 18.2.30.1. Overview
- 18.2.30.2. Products
- 18.2.30.3. SWOT Analysis
- 18.2.30.4. Recent Developments
- 18.2.30.5. Financials (Based on Availability)
- 18.2.31 Indian Oil Corporation Ltd
- 18.2.31.1. Overview
- 18.2.31.2. Products
- 18.2.31.3. SWOT Analysis
- 18.2.31.4. Recent Developments
- 18.2.31.5. Financials (Based on Availability)
- 18.2.32 BP p l c
- 18.2.32.1. Overview
- 18.2.32.2. Products
- 18.2.32.3. SWOT Analysis
- 18.2.32.4. Recent Developments
- 18.2.32.5. Financials (Based on Availability)
- 18.2.33 Blaser Swisslube
- 18.2.33.1. Overview
- 18.2.33.2. Products
- 18.2.33.3. SWOT Analysis
- 18.2.33.4. Recent Developments
- 18.2.33.5. Financials (Based on Availability)
- 18.2.34 Gulf Oil Corporation Limited
- 18.2.34.1. Overview
- 18.2.34.2. Products
- 18.2.34.3. SWOT Analysis
- 18.2.34.4. Recent Developments
- 18.2.34.5. Financials (Based on Availability)
- 18.2.1 Shell plc
List of Figures
- Figure 1: Global Lubricants Market Revenue Breakdown (Million, %) by Region 2024 & 2032
- Figure 2: Global Lubricants Market Volume Breakdown (Billion, %) by Region 2024 & 2032
- Figure 3: North America Lubricants Market Revenue (Million), by Country 2024 & 2032
- Figure 4: North America Lubricants Market Volume (Billion), by Country 2024 & 2032
- Figure 5: North America Lubricants Market Revenue Share (%), by Country 2024 & 2032
- Figure 6: North America Lubricants Market Volume Share (%), by Country 2024 & 2032
- Figure 7: Europe Lubricants Market Revenue (Million), by Country 2024 & 2032
- Figure 8: Europe Lubricants Market Volume (Billion), by Country 2024 & 2032
- Figure 9: Europe Lubricants Market Revenue Share (%), by Country 2024 & 2032
- Figure 10: Europe Lubricants Market Volume Share (%), by Country 2024 & 2032
- Figure 11: Asia Pacific Lubricants Market Revenue (Million), by Country 2024 & 2032
- Figure 12: Asia Pacific Lubricants Market Volume (Billion), by Country 2024 & 2032
- Figure 13: Asia Pacific Lubricants Market Revenue Share (%), by Country 2024 & 2032
- Figure 14: Asia Pacific Lubricants Market Volume Share (%), by Country 2024 & 2032
- Figure 15: South America Lubricants Market Revenue (Million), by Country 2024 & 2032
- Figure 16: South America Lubricants Market Volume (Billion), by Country 2024 & 2032
- Figure 17: South America Lubricants Market Revenue Share (%), by Country 2024 & 2032
- Figure 18: South America Lubricants Market Volume Share (%), by Country 2024 & 2032
- Figure 19: North America Lubricants Market Revenue (Million), by Country 2024 & 2032
- Figure 20: North America Lubricants Market Volume (Billion), by Country 2024 & 2032
- Figure 21: North America Lubricants Market Revenue Share (%), by Country 2024 & 2032
- Figure 22: North America Lubricants Market Volume Share (%), by Country 2024 & 2032
- Figure 23: MEA Lubricants Market Revenue (Million), by Country 2024 & 2032
- Figure 24: MEA Lubricants Market Volume (Billion), by Country 2024 & 2032
- Figure 25: MEA Lubricants Market Revenue Share (%), by Country 2024 & 2032
- Figure 26: MEA Lubricants Market Volume Share (%), by Country 2024 & 2032
- Figure 27: Asia Pacific Lubricants Market Revenue (Million), by Group 2024 & 2032
- Figure 28: Asia Pacific Lubricants Market Volume (Billion), by Group 2024 & 2032
- Figure 29: Asia Pacific Lubricants Market Revenue Share (%), by Group 2024 & 2032
- Figure 30: Asia Pacific Lubricants Market Volume Share (%), by Group 2024 & 2032
- Figure 31: Asia Pacific Lubricants Market Revenue (Million), by Base Stock 2024 & 2032
- Figure 32: Asia Pacific Lubricants Market Volume (Billion), by Base Stock 2024 & 2032
- Figure 33: Asia Pacific Lubricants Market Revenue Share (%), by Base Stock 2024 & 2032
- Figure 34: Asia Pacific Lubricants Market Volume Share (%), by Base Stock 2024 & 2032
- Figure 35: Asia Pacific Lubricants Market Revenue (Million), by Product Type 2024 & 2032
- Figure 36: Asia Pacific Lubricants Market Volume (Billion), by Product Type 2024 & 2032
- Figure 37: Asia Pacific Lubricants Market Revenue Share (%), by Product Type 2024 & 2032
- Figure 38: Asia Pacific Lubricants Market Volume Share (%), by Product Type 2024 & 2032
- Figure 39: Asia Pacific Lubricants Market Revenue (Million), by End-user Industry 2024 & 2032
- Figure 40: Asia Pacific Lubricants Market Volume (Billion), by End-user Industry 2024 & 2032
- Figure 41: Asia Pacific Lubricants Market Revenue Share (%), by End-user Industry 2024 & 2032
- Figure 42: Asia Pacific Lubricants Market Volume Share (%), by End-user Industry 2024 & 2032
- Figure 43: Asia Pacific Lubricants Market Revenue (Million), by Country 2024 & 2032
- Figure 44: Asia Pacific Lubricants Market Volume (Billion), by Country 2024 & 2032
- Figure 45: Asia Pacific Lubricants Market Revenue Share (%), by Country 2024 & 2032
- Figure 46: Asia Pacific Lubricants Market Volume Share (%), by Country 2024 & 2032
- Figure 47: North America Lubricants Market Revenue (Million), by Group 2024 & 2032
- Figure 48: North America Lubricants Market Volume (Billion), by Group 2024 & 2032
- Figure 49: North America Lubricants Market Revenue Share (%), by Group 2024 & 2032
- Figure 50: North America Lubricants Market Volume Share (%), by Group 2024 & 2032
- Figure 51: North America Lubricants Market Revenue (Million), by Base Stock 2024 & 2032
- Figure 52: North America Lubricants Market Volume (Billion), by Base Stock 2024 & 2032
- Figure 53: North America Lubricants Market Revenue Share (%), by Base Stock 2024 & 2032
- Figure 54: North America Lubricants Market Volume Share (%), by Base Stock 2024 & 2032
- Figure 55: North America Lubricants Market Revenue (Million), by Product Type 2024 & 2032
- Figure 56: North America Lubricants Market Volume (Billion), by Product Type 2024 & 2032
- Figure 57: North America Lubricants Market Revenue Share (%), by Product Type 2024 & 2032
- Figure 58: North America Lubricants Market Volume Share (%), by Product Type 2024 & 2032
- Figure 59: North America Lubricants Market Revenue (Million), by End-user Industry 2024 & 2032
- Figure 60: North America Lubricants Market Volume (Billion), by End-user Industry 2024 & 2032
- Figure 61: North America Lubricants Market Revenue Share (%), by End-user Industry 2024 & 2032
- Figure 62: North America Lubricants Market Volume Share (%), by End-user Industry 2024 & 2032
- Figure 63: North America Lubricants Market Revenue (Million), by Country 2024 & 2032
- Figure 64: North America Lubricants Market Volume (Billion), by Country 2024 & 2032
- Figure 65: North America Lubricants Market Revenue Share (%), by Country 2024 & 2032
- Figure 66: North America Lubricants Market Volume Share (%), by Country 2024 & 2032
- Figure 67: Europe Lubricants Market Revenue (Million), by Group 2024 & 2032
- Figure 68: Europe Lubricants Market Volume (Billion), by Group 2024 & 2032
- Figure 69: Europe Lubricants Market Revenue Share (%), by Group 2024 & 2032
- Figure 70: Europe Lubricants Market Volume Share (%), by Group 2024 & 2032
- Figure 71: Europe Lubricants Market Revenue (Million), by Base Stock 2024 & 2032
- Figure 72: Europe Lubricants Market Volume (Billion), by Base Stock 2024 & 2032
- Figure 73: Europe Lubricants Market Revenue Share (%), by Base Stock 2024 & 2032
- Figure 74: Europe Lubricants Market Volume Share (%), by Base Stock 2024 & 2032
- Figure 75: Europe Lubricants Market Revenue (Million), by Product Type 2024 & 2032
- Figure 76: Europe Lubricants Market Volume (Billion), by Product Type 2024 & 2032
- Figure 77: Europe Lubricants Market Revenue Share (%), by Product Type 2024 & 2032
- Figure 78: Europe Lubricants Market Volume Share (%), by Product Type 2024 & 2032
- Figure 79: Europe Lubricants Market Revenue (Million), by End-user Industry 2024 & 2032
- Figure 80: Europe Lubricants Market Volume (Billion), by End-user Industry 2024 & 2032
- Figure 81: Europe Lubricants Market Revenue Share (%), by End-user Industry 2024 & 2032
- Figure 82: Europe Lubricants Market Volume Share (%), by End-user Industry 2024 & 2032
- Figure 83: Europe Lubricants Market Revenue (Million), by Country 2024 & 2032
- Figure 84: Europe Lubricants Market Volume (Billion), by Country 2024 & 2032
- Figure 85: Europe Lubricants Market Revenue Share (%), by Country 2024 & 2032
- Figure 86: Europe Lubricants Market Volume Share (%), by Country 2024 & 2032
- Figure 87: South America Lubricants Market Revenue (Million), by Group 2024 & 2032
- Figure 88: South America Lubricants Market Volume (Billion), by Group 2024 & 2032
- Figure 89: South America Lubricants Market Revenue Share (%), by Group 2024 & 2032
- Figure 90: South America Lubricants Market Volume Share (%), by Group 2024 & 2032
- Figure 91: South America Lubricants Market Revenue (Million), by Base Stock 2024 & 2032
- Figure 92: South America Lubricants Market Volume (Billion), by Base Stock 2024 & 2032
- Figure 93: South America Lubricants Market Revenue Share (%), by Base Stock 2024 & 2032
- Figure 94: South America Lubricants Market Volume Share (%), by Base Stock 2024 & 2032
- Figure 95: South America Lubricants Market Revenue (Million), by Product Type 2024 & 2032
- Figure 96: South America Lubricants Market Volume (Billion), by Product Type 2024 & 2032
- Figure 97: South America Lubricants Market Revenue Share (%), by Product Type 2024 & 2032
- Figure 98: South America Lubricants Market Volume Share (%), by Product Type 2024 & 2032
- Figure 99: South America Lubricants Market Revenue (Million), by End-user Industry 2024 & 2032
- Figure 100: South America Lubricants Market Volume (Billion), by End-user Industry 2024 & 2032
- Figure 101: South America Lubricants Market Revenue Share (%), by End-user Industry 2024 & 2032
- Figure 102: South America Lubricants Market Volume Share (%), by End-user Industry 2024 & 2032
- Figure 103: South America Lubricants Market Revenue (Million), by Country 2024 & 2032
- Figure 104: South America Lubricants Market Volume (Billion), by Country 2024 & 2032
- Figure 105: South America Lubricants Market Revenue Share (%), by Country 2024 & 2032
- Figure 106: South America Lubricants Market Volume Share (%), by Country 2024 & 2032
- Figure 107: Middle East Lubricants Market Revenue (Million), by Group 2024 & 2032
- Figure 108: Middle East Lubricants Market Volume (Billion), by Group 2024 & 2032
- Figure 109: Middle East Lubricants Market Revenue Share (%), by Group 2024 & 2032
- Figure 110: Middle East Lubricants Market Volume Share (%), by Group 2024 & 2032
- Figure 111: Middle East Lubricants Market Revenue (Million), by Base Stock 2024 & 2032
- Figure 112: Middle East Lubricants Market Volume (Billion), by Base Stock 2024 & 2032
- Figure 113: Middle East Lubricants Market Revenue Share (%), by Base Stock 2024 & 2032
- Figure 114: Middle East Lubricants Market Volume Share (%), by Base Stock 2024 & 2032
- Figure 115: Middle East Lubricants Market Revenue (Million), by Product Type 2024 & 2032
- Figure 116: Middle East Lubricants Market Volume (Billion), by Product Type 2024 & 2032
- Figure 117: Middle East Lubricants Market Revenue Share (%), by Product Type 2024 & 2032
- Figure 118: Middle East Lubricants Market Volume Share (%), by Product Type 2024 & 2032
- Figure 119: Middle East Lubricants Market Revenue (Million), by End-user Industry 2024 & 2032
- Figure 120: Middle East Lubricants Market Volume (Billion), by End-user Industry 2024 & 2032
- Figure 121: Middle East Lubricants Market Revenue Share (%), by End-user Industry 2024 & 2032
- Figure 122: Middle East Lubricants Market Volume Share (%), by End-user Industry 2024 & 2032
- Figure 123: Middle East Lubricants Market Revenue (Million), by Country 2024 & 2032
- Figure 124: Middle East Lubricants Market Volume (Billion), by Country 2024 & 2032
- Figure 125: Middle East Lubricants Market Revenue Share (%), by Country 2024 & 2032
- Figure 126: Middle East Lubricants Market Volume Share (%), by Country 2024 & 2032
- Figure 127: Africa Lubricants Market Revenue (Million), by Group 2024 & 2032
- Figure 128: Africa Lubricants Market Volume (Billion), by Group 2024 & 2032
- Figure 129: Africa Lubricants Market Revenue Share (%), by Group 2024 & 2032
- Figure 130: Africa Lubricants Market Volume Share (%), by Group 2024 & 2032
- Figure 131: Africa Lubricants Market Revenue (Million), by Base Stock 2024 & 2032
- Figure 132: Africa Lubricants Market Volume (Billion), by Base Stock 2024 & 2032
- Figure 133: Africa Lubricants Market Revenue Share (%), by Base Stock 2024 & 2032
- Figure 134: Africa Lubricants Market Volume Share (%), by Base Stock 2024 & 2032
- Figure 135: Africa Lubricants Market Revenue (Million), by Product Type 2024 & 2032
- Figure 136: Africa Lubricants Market Volume (Billion), by Product Type 2024 & 2032
- Figure 137: Africa Lubricants Market Revenue Share (%), by Product Type 2024 & 2032
- Figure 138: Africa Lubricants Market Volume Share (%), by Product Type 2024 & 2032
- Figure 139: Africa Lubricants Market Revenue (Million), by End-user Industry 2024 & 2032
- Figure 140: Africa Lubricants Market Volume (Billion), by End-user Industry 2024 & 2032
- Figure 141: Africa Lubricants Market Revenue Share (%), by End-user Industry 2024 & 2032
- Figure 142: Africa Lubricants Market Volume Share (%), by End-user Industry 2024 & 2032
- Figure 143: Africa Lubricants Market Revenue (Million), by Country 2024 & 2032
- Figure 144: Africa Lubricants Market Volume (Billion), by Country 2024 & 2032
- Figure 145: Africa Lubricants Market Revenue Share (%), by Country 2024 & 2032
- Figure 146: Africa Lubricants Market Volume Share (%), by Country 2024 & 2032
List of Tables
- Table 1: Global Lubricants Market Revenue Million Forecast, by Region 2019 & 2032
- Table 2: Global Lubricants Market Volume Billion Forecast, by Region 2019 & 2032
- Table 3: Global Lubricants Market Revenue Million Forecast, by Group 2019 & 2032
- Table 4: Global Lubricants Market Volume Billion Forecast, by Group 2019 & 2032
- Table 5: Global Lubricants Market Revenue Million Forecast, by Base Stock 2019 & 2032
- Table 6: Global Lubricants Market Volume Billion Forecast, by Base Stock 2019 & 2032
- Table 7: Global Lubricants Market Revenue Million Forecast, by Product Type 2019 & 2032
- Table 8: Global Lubricants Market Volume Billion Forecast, by Product Type 2019 & 2032
- Table 9: Global Lubricants Market Revenue Million Forecast, by End-user Industry 2019 & 2032
- Table 10: Global Lubricants Market Volume Billion Forecast, by End-user Industry 2019 & 2032
- Table 11: Global Lubricants Market Revenue Million Forecast, by Region 2019 & 2032
- Table 12: Global Lubricants Market Volume Billion Forecast, by Region 2019 & 2032
- Table 13: Global Lubricants Market Revenue Million Forecast, by Country 2019 & 2032
- Table 14: Global Lubricants Market Volume Billion Forecast, by Country 2019 & 2032
- Table 15: United States Lubricants Market Revenue (Million) Forecast, by Application 2019 & 2032
- Table 16: United States Lubricants Market Volume (Billion) Forecast, by Application 2019 & 2032
- Table 17: Canada Lubricants Market Revenue (Million) Forecast, by Application 2019 & 2032
- Table 18: Canada Lubricants Market Volume (Billion) Forecast, by Application 2019 & 2032
- Table 19: Mexico Lubricants Market Revenue (Million) Forecast, by Application 2019 & 2032
- Table 20: Mexico Lubricants Market Volume (Billion) Forecast, by Application 2019 & 2032
- Table 21: Global Lubricants Market Revenue Million Forecast, by Country 2019 & 2032
- Table 22: Global Lubricants Market Volume Billion Forecast, by Country 2019 & 2032
- Table 23: Germany Lubricants Market Revenue (Million) Forecast, by Application 2019 & 2032
- Table 24: Germany Lubricants Market Volume (Billion) Forecast, by Application 2019 & 2032
- Table 25: United Kingdom Lubricants Market Revenue (Million) Forecast, by Application 2019 & 2032
- Table 26: United Kingdom Lubricants Market Volume (Billion) Forecast, by Application 2019 & 2032
- Table 27: France Lubricants Market Revenue (Million) Forecast, by Application 2019 & 2032
- Table 28: France Lubricants Market Volume (Billion) Forecast, by Application 2019 & 2032
- Table 29: Spain Lubricants Market Revenue (Million) Forecast, by Application 2019 & 2032
- Table 30: Spain Lubricants Market Volume (Billion) Forecast, by Application 2019 & 2032
- Table 31: Italy Lubricants Market Revenue (Million) Forecast, by Application 2019 & 2032
- Table 32: Italy Lubricants Market Volume (Billion) Forecast, by Application 2019 & 2032
- Table 33: Spain Lubricants Market Revenue (Million) Forecast, by Application 2019 & 2032
- Table 34: Spain Lubricants Market Volume (Billion) Forecast, by Application 2019 & 2032
- Table 35: Belgium Lubricants Market Revenue (Million) Forecast, by Application 2019 & 2032
- Table 36: Belgium Lubricants Market Volume (Billion) Forecast, by Application 2019 & 2032
- Table 37: Netherland Lubricants Market Revenue (Million) Forecast, by Application 2019 & 2032
- Table 38: Netherland Lubricants Market Volume (Billion) Forecast, by Application 2019 & 2032
- Table 39: Nordics Lubricants Market Revenue (Million) Forecast, by Application 2019 & 2032
- Table 40: Nordics Lubricants Market Volume (Billion) Forecast, by Application 2019 & 2032
- Table 41: Rest of Europe Lubricants Market Revenue (Million) Forecast, by Application 2019 & 2032
- Table 42: Rest of Europe Lubricants Market Volume (Billion) Forecast, by Application 2019 & 2032
- Table 43: Global Lubricants Market Revenue Million Forecast, by Country 2019 & 2032
- Table 44: Global Lubricants Market Volume Billion Forecast, by Country 2019 & 2032
- Table 45: China Lubricants Market Revenue (Million) Forecast, by Application 2019 & 2032
- Table 46: China Lubricants Market Volume (Billion) Forecast, by Application 2019 & 2032
- Table 47: Japan Lubricants Market Revenue (Million) Forecast, by Application 2019 & 2032
- Table 48: Japan Lubricants Market Volume (Billion) Forecast, by Application 2019 & 2032
- Table 49: India Lubricants Market Revenue (Million) Forecast, by Application 2019 & 2032
- Table 50: India Lubricants Market Volume (Billion) Forecast, by Application 2019 & 2032
- Table 51: South Korea Lubricants Market Revenue (Million) Forecast, by Application 2019 & 2032
- Table 52: South Korea Lubricants Market Volume (Billion) Forecast, by Application 2019 & 2032
- Table 53: Southeast Asia Lubricants Market Revenue (Million) Forecast, by Application 2019 & 2032
- Table 54: Southeast Asia Lubricants Market Volume (Billion) Forecast, by Application 2019 & 2032
- Table 55: Australia Lubricants Market Revenue (Million) Forecast, by Application 2019 & 2032
- Table 56: Australia Lubricants Market Volume (Billion) Forecast, by Application 2019 & 2032
- Table 57: Indonesia Lubricants Market Revenue (Million) Forecast, by Application 2019 & 2032
- Table 58: Indonesia Lubricants Market Volume (Billion) Forecast, by Application 2019 & 2032
- Table 59: Phillipes Lubricants Market Revenue (Million) Forecast, by Application 2019 & 2032
- Table 60: Phillipes Lubricants Market Volume (Billion) Forecast, by Application 2019 & 2032
- Table 61: Singapore Lubricants Market Revenue (Million) Forecast, by Application 2019 & 2032
- Table 62: Singapore Lubricants Market Volume (Billion) Forecast, by Application 2019 & 2032
- Table 63: Thailandc Lubricants Market Revenue (Million) Forecast, by Application 2019 & 2032
- Table 64: Thailandc Lubricants Market Volume (Billion) Forecast, by Application 2019 & 2032
- Table 65: Rest of Asia Pacific Lubricants Market Revenue (Million) Forecast, by Application 2019 & 2032
- Table 66: Rest of Asia Pacific Lubricants Market Volume (Billion) Forecast, by Application 2019 & 2032
- Table 67: Global Lubricants Market Revenue Million Forecast, by Country 2019 & 2032
- Table 68: Global Lubricants Market Volume Billion Forecast, by Country 2019 & 2032
- Table 69: Brazil Lubricants Market Revenue (Million) Forecast, by Application 2019 & 2032
- Table 70: Brazil Lubricants Market Volume (Billion) Forecast, by Application 2019 & 2032
- Table 71: Argentina Lubricants Market Revenue (Million) Forecast, by Application 2019 & 2032
- Table 72: Argentina Lubricants Market Volume (Billion) Forecast, by Application 2019 & 2032
- Table 73: Peru Lubricants Market Revenue (Million) Forecast, by Application 2019 & 2032
- Table 74: Peru Lubricants Market Volume (Billion) Forecast, by Application 2019 & 2032
- Table 75: Chile Lubricants Market Revenue (Million) Forecast, by Application 2019 & 2032
- Table 76: Chile Lubricants Market Volume (Billion) Forecast, by Application 2019 & 2032
- Table 77: Colombia Lubricants Market Revenue (Million) Forecast, by Application 2019 & 2032
- Table 78: Colombia Lubricants Market Volume (Billion) Forecast, by Application 2019 & 2032
- Table 79: Ecuador Lubricants Market Revenue (Million) Forecast, by Application 2019 & 2032
- Table 80: Ecuador Lubricants Market Volume (Billion) Forecast, by Application 2019 & 2032
- Table 81: Venezuela Lubricants Market Revenue (Million) Forecast, by Application 2019 & 2032
- Table 82: Venezuela Lubricants Market Volume (Billion) Forecast, by Application 2019 & 2032
- Table 83: Rest of South America Lubricants Market Revenue (Million) Forecast, by Application 2019 & 2032
- Table 84: Rest of South America Lubricants Market Volume (Billion) Forecast, by Application 2019 & 2032
- Table 85: Global Lubricants Market Revenue Million Forecast, by Country 2019 & 2032
- Table 86: Global Lubricants Market Volume Billion Forecast, by Country 2019 & 2032
- Table 87: United States Lubricants Market Revenue (Million) Forecast, by Application 2019 & 2032
- Table 88: United States Lubricants Market Volume (Billion) Forecast, by Application 2019 & 2032
- Table 89: Canada Lubricants Market Revenue (Million) Forecast, by Application 2019 & 2032
- Table 90: Canada Lubricants Market Volume (Billion) Forecast, by Application 2019 & 2032
- Table 91: Mexico Lubricants Market Revenue (Million) Forecast, by Application 2019 & 2032
- Table 92: Mexico Lubricants Market Volume (Billion) Forecast, by Application 2019 & 2032
- Table 93: Global Lubricants Market Revenue Million Forecast, by Country 2019 & 2032
- Table 94: Global Lubricants Market Volume Billion Forecast, by Country 2019 & 2032
- Table 95: United Arab Emirates Lubricants Market Revenue (Million) Forecast, by Application 2019 & 2032
- Table 96: United Arab Emirates Lubricants Market Volume (Billion) Forecast, by Application 2019 & 2032
- Table 97: Saudi Arabia Lubricants Market Revenue (Million) Forecast, by Application 2019 & 2032
- Table 98: Saudi Arabia Lubricants Market Volume (Billion) Forecast, by Application 2019 & 2032
- Table 99: South Africa Lubricants Market Revenue (Million) Forecast, by Application 2019 & 2032
- Table 100: South Africa Lubricants Market Volume (Billion) Forecast, by Application 2019 & 2032
- Table 101: Rest of Middle East and Africa Lubricants Market Revenue (Million) Forecast, by Application 2019 & 2032
- Table 102: Rest of Middle East and Africa Lubricants Market Volume (Billion) Forecast, by Application 2019 & 2032
- Table 103: Global Lubricants Market Revenue Million Forecast, by Group 2019 & 2032
- Table 104: Global Lubricants Market Volume Billion Forecast, by Group 2019 & 2032
- Table 105: Global Lubricants Market Revenue Million Forecast, by Base Stock 2019 & 2032
- Table 106: Global Lubricants Market Volume Billion Forecast, by Base Stock 2019 & 2032
- Table 107: Global Lubricants Market Revenue Million Forecast, by Product Type 2019 & 2032
- Table 108: Global Lubricants Market Volume Billion Forecast, by Product Type 2019 & 2032
- Table 109: Global Lubricants Market Revenue Million Forecast, by End-user Industry 2019 & 2032
- Table 110: Global Lubricants Market Volume Billion Forecast, by End-user Industry 2019 & 2032
- Table 111: Global Lubricants Market Revenue Million Forecast, by Country 2019 & 2032
- Table 112: Global Lubricants Market Volume Billion Forecast, by Country 2019 & 2032
- Table 113: China Lubricants Market Revenue (Million) Forecast, by Application 2019 & 2032
- Table 114: China Lubricants Market Volume (Billion) Forecast, by Application 2019 & 2032
- Table 115: India Lubricants Market Revenue (Million) Forecast, by Application 2019 & 2032
- Table 116: India Lubricants Market Volume (Billion) Forecast, by Application 2019 & 2032
- Table 117: Japan Lubricants Market Revenue (Million) Forecast, by Application 2019 & 2032
- Table 118: Japan Lubricants Market Volume (Billion) Forecast, by Application 2019 & 2032
- Table 119: South Korea Lubricants Market Revenue (Million) Forecast, by Application 2019 & 2032
- Table 120: South Korea Lubricants Market Volume (Billion) Forecast, by Application 2019 & 2032
- Table 121: Philippines Lubricants Market Revenue (Million) Forecast, by Application 2019 & 2032
- Table 122: Philippines Lubricants Market Volume (Billion) Forecast, by Application 2019 & 2032
- Table 123: Indonesia Lubricants Market Revenue (Million) Forecast, by Application 2019 & 2032
- Table 124: Indonesia Lubricants Market Volume (Billion) Forecast, by Application 2019 & 2032
- Table 125: Malaysia Lubricants Market Revenue (Million) Forecast, by Application 2019 & 2032
- Table 126: Malaysia Lubricants Market Volume (Billion) Forecast, by Application 2019 & 2032
- Table 127: Thailand Lubricants Market Revenue (Million) Forecast, by Application 2019 & 2032
- Table 128: Thailand Lubricants Market Volume (Billion) Forecast, by Application 2019 & 2032
- Table 129: Vietnam Lubricants Market Revenue (Million) Forecast, by Application 2019 & 2032
- Table 130: Vietnam Lubricants Market Volume (Billion) Forecast, by Application 2019 & 2032
- Table 131: Rest of Asia Pacific Lubricants Market Revenue (Million) Forecast, by Application 2019 & 2032
- Table 132: Rest of Asia Pacific Lubricants Market Volume (Billion) Forecast, by Application 2019 & 2032
- Table 133: Global Lubricants Market Revenue Million Forecast, by Group 2019 & 2032
- Table 134: Global Lubricants Market Volume Billion Forecast, by Group 2019 & 2032
- Table 135: Global Lubricants Market Revenue Million Forecast, by Base Stock 2019 & 2032
- Table 136: Global Lubricants Market Volume Billion Forecast, by Base Stock 2019 & 2032
- Table 137: Global Lubricants Market Revenue Million Forecast, by Product Type 2019 & 2032
- Table 138: Global Lubricants Market Volume Billion Forecast, by Product Type 2019 & 2032
- Table 139: Global Lubricants Market Revenue Million Forecast, by End-user Industry 2019 & 2032
- Table 140: Global Lubricants Market Volume Billion Forecast, by End-user Industry 2019 & 2032
- Table 141: Global Lubricants Market Revenue Million Forecast, by Country 2019 & 2032
- Table 142: Global Lubricants Market Volume Billion Forecast, by Country 2019 & 2032
- Table 143: United States Lubricants Market Revenue (Million) Forecast, by Application 2019 & 2032
- Table 144: United States Lubricants Market Volume (Billion) Forecast, by Application 2019 & 2032
- Table 145: Canada Lubricants Market Revenue (Million) Forecast, by Application 2019 & 2032
- Table 146: Canada Lubricants Market Volume (Billion) Forecast, by Application 2019 & 2032
- Table 147: Mexico Lubricants Market Revenue (Million) Forecast, by Application 2019 & 2032
- Table 148: Mexico Lubricants Market Volume (Billion) Forecast, by Application 2019 & 2032
- Table 149: Global Lubricants Market Revenue Million Forecast, by Group 2019 & 2032
- Table 150: Global Lubricants Market Volume Billion Forecast, by Group 2019 & 2032
- Table 151: Global Lubricants Market Revenue Million Forecast, by Base Stock 2019 & 2032
- Table 152: Global Lubricants Market Volume Billion Forecast, by Base Stock 2019 & 2032
- Table 153: Global Lubricants Market Revenue Million Forecast, by Product Type 2019 & 2032
- Table 154: Global Lubricants Market Volume Billion Forecast, by Product Type 2019 & 2032
- Table 155: Global Lubricants Market Revenue Million Forecast, by End-user Industry 2019 & 2032
- Table 156: Global Lubricants Market Volume Billion Forecast, by End-user Industry 2019 & 2032
- Table 157: Global Lubricants Market Revenue Million Forecast, by Country 2019 & 2032
- Table 158: Global Lubricants Market Volume Billion Forecast, by Country 2019 & 2032
- Table 159: Germany Lubricants Market Revenue (Million) Forecast, by Application 2019 & 2032
- Table 160: Germany Lubricants Market Volume (Billion) Forecast, by Application 2019 & 2032
- Table 161: United Kingdom Lubricants Market Revenue (Million) Forecast, by Application 2019 & 2032
- Table 162: United Kingdom Lubricants Market Volume (Billion) Forecast, by Application 2019 & 2032
- Table 163: Italy Lubricants Market Revenue (Million) Forecast, by Application 2019 & 2032
- Table 164: Italy Lubricants Market Volume (Billion) Forecast, by Application 2019 & 2032
- Table 165: France Lubricants Market Revenue (Million) Forecast, by Application 2019 & 2032
- Table 166: France Lubricants Market Volume (Billion) Forecast, by Application 2019 & 2032
- Table 167: Russia Lubricants Market Revenue (Million) Forecast, by Application 2019 & 2032
- Table 168: Russia Lubricants Market Volume (Billion) Forecast, by Application 2019 & 2032
- Table 169: Turkey Lubricants Market Revenue (Million) Forecast, by Application 2019 & 2032
- Table 170: Turkey Lubricants Market Volume (Billion) Forecast, by Application 2019 & 2032
- Table 171: Spain Lubricants Market Revenue (Million) Forecast, by Application 2019 & 2032
- Table 172: Spain Lubricants Market Volume (Billion) Forecast, by Application 2019 & 2032
- Table 173: Rest of Europe Lubricants Market Revenue (Million) Forecast, by Application 2019 & 2032
- Table 174: Rest of Europe Lubricants Market Volume (Billion) Forecast, by Application 2019 & 2032
- Table 175: Global Lubricants Market Revenue Million Forecast, by Group 2019 & 2032
- Table 176: Global Lubricants Market Volume Billion Forecast, by Group 2019 & 2032
- Table 177: Global Lubricants Market Revenue Million Forecast, by Base Stock 2019 & 2032
- Table 178: Global Lubricants Market Volume Billion Forecast, by Base Stock 2019 & 2032
- Table 179: Global Lubricants Market Revenue Million Forecast, by Product Type 2019 & 2032
- Table 180: Global Lubricants Market Volume Billion Forecast, by Product Type 2019 & 2032
- Table 181: Global Lubricants Market Revenue Million Forecast, by End-user Industry 2019 & 2032
- Table 182: Global Lubricants Market Volume Billion Forecast, by End-user Industry 2019 & 2032
- Table 183: Global Lubricants Market Revenue Million Forecast, by Country 2019 & 2032
- Table 184: Global Lubricants Market Volume Billion Forecast, by Country 2019 & 2032
- Table 185: Brazil Lubricants Market Revenue (Million) Forecast, by Application 2019 & 2032
- Table 186: Brazil Lubricants Market Volume (Billion) Forecast, by Application 2019 & 2032
- Table 187: Argentina Lubricants Market Revenue (Million) Forecast, by Application 2019 & 2032
- Table 188: Argentina Lubricants Market Volume (Billion) Forecast, by Application 2019 & 2032
- Table 189: Chile Lubricants Market Revenue (Million) Forecast, by Application 2019 & 2032
- Table 190: Chile Lubricants Market Volume (Billion) Forecast, by Application 2019 & 2032
- Table 191: Colombia Lubricants Market Revenue (Million) Forecast, by Application 2019 & 2032
- Table 192: Colombia Lubricants Market Volume (Billion) Forecast, by Application 2019 & 2032
- Table 193: Rest of South America Lubricants Market Revenue (Million) Forecast, by Application 2019 & 2032
- Table 194: Rest of South America Lubricants Market Volume (Billion) Forecast, by Application 2019 & 2032
- Table 195: Global Lubricants Market Revenue Million Forecast, by Group 2019 & 2032
- Table 196: Global Lubricants Market Volume Billion Forecast, by Group 2019 & 2032
- Table 197: Global Lubricants Market Revenue Million Forecast, by Base Stock 2019 & 2032
- Table 198: Global Lubricants Market Volume Billion Forecast, by Base Stock 2019 & 2032
- Table 199: Global Lubricants Market Revenue Million Forecast, by Product Type 2019 & 2032
- Table 200: Global Lubricants Market Volume Billion Forecast, by Product Type 2019 & 2032
- Table 201: Global Lubricants Market Revenue Million Forecast, by End-user Industry 2019 & 2032
- Table 202: Global Lubricants Market Volume Billion Forecast, by End-user Industry 2019 & 2032
- Table 203: Global Lubricants Market Revenue Million Forecast, by Country 2019 & 2032
- Table 204: Global Lubricants Market Volume Billion Forecast, by Country 2019 & 2032
- Table 205: Saudi Arabia Lubricants Market Revenue (Million) Forecast, by Application 2019 & 2032
- Table 206: Saudi Arabia Lubricants Market Volume (Billion) Forecast, by Application 2019 & 2032
- Table 207: Iran Lubricants Market Revenue (Million) Forecast, by Application 2019 & 2032
- Table 208: Iran Lubricants Market Volume (Billion) Forecast, by Application 2019 & 2032
- Table 209: Iraq Lubricants Market Revenue (Million) Forecast, by Application 2019 & 2032
- Table 210: Iraq Lubricants Market Volume (Billion) Forecast, by Application 2019 & 2032
- Table 211: United Arab Emirates Lubricants Market Revenue (Million) Forecast, by Application 2019 & 2032
- Table 212: United Arab Emirates Lubricants Market Volume (Billion) Forecast, by Application 2019 & 2032
- Table 213: Kuwait Lubricants Market Revenue (Million) Forecast, by Application 2019 & 2032
- Table 214: Kuwait Lubricants Market Volume (Billion) Forecast, by Application 2019 & 2032
- Table 215: Rest of the Middle East Lubricants Market Revenue (Million) Forecast, by Application 2019 & 2032
- Table 216: Rest of the Middle East Lubricants Market Volume (Billion) Forecast, by Application 2019 & 2032
- Table 217: Global Lubricants Market Revenue Million Forecast, by Group 2019 & 2032
- Table 218: Global Lubricants Market Volume Billion Forecast, by Group 2019 & 2032
- Table 219: Global Lubricants Market Revenue Million Forecast, by Base Stock 2019 & 2032
- Table 220: Global Lubricants Market Volume Billion Forecast, by Base Stock 2019 & 2032
- Table 221: Global Lubricants Market Revenue Million Forecast, by Product Type 2019 & 2032
- Table 222: Global Lubricants Market Volume Billion Forecast, by Product Type 2019 & 2032
- Table 223: Global Lubricants Market Revenue Million Forecast, by End-user Industry 2019 & 2032
- Table 224: Global Lubricants Market Volume Billion Forecast, by End-user Industry 2019 & 2032
- Table 225: Global Lubricants Market Revenue Million Forecast, by Country 2019 & 2032
- Table 226: Global Lubricants Market Volume Billion Forecast, by Country 2019 & 2032
- Table 227: Egypt Lubricants Market Revenue (Million) Forecast, by Application 2019 & 2032
- Table 228: Egypt Lubricants Market Volume (Billion) Forecast, by Application 2019 & 2032
- Table 229: South Africa Lubricants Market Revenue (Million) Forecast, by Application 2019 & 2032
- Table 230: South Africa Lubricants Market Volume (Billion) Forecast, by Application 2019 & 2032
- Table 231: Nigeria Lubricants Market Revenue (Million) Forecast, by Application 2019 & 2032
- Table 232: Nigeria Lubricants Market Volume (Billion) Forecast, by Application 2019 & 2032
- Table 233: Algeria Lubricants Market Revenue (Million) Forecast, by Application 2019 & 2032
- Table 234: Algeria Lubricants Market Volume (Billion) Forecast, by Application 2019 & 2032
- Table 235: Morocco Lubricants Market Revenue (Million) Forecast, by Application 2019 & 2032
- Table 236: Morocco Lubricants Market Volume (Billion) Forecast, by Application 2019 & 2032
- Table 237: Rest of Africa Lubricants Market Revenue (Million) Forecast, by Application 2019 & 2032
- Table 238: Rest of Africa Lubricants Market Volume (Billion) Forecast, by Application 2019 & 2032
Frequently Asked Questions
1. What is the projected Compound Annual Growth Rate (CAGR) of the Lubricants Market?
The projected CAGR is approximately 3.52%.
2. Which companies are prominent players in the Lubricants Market?
Key companies in the market include Shell plc, PETROFER CHEMIE H R Fischer GmbH + Co KG, Bharat Petroleum Corporation Limited, LUKOIL, Exxon Mobil Corporation, AMSOIL INC, Petromin, Hindustan Petroleum Corporation Limited, PT Pertamina Lubricants, China National Petroleum Corporation (PetroChina), Kluber Lubrication München GmbH & Co KG, ENEOS Corporation, FUCHS, Motul, Petrobras, Repsol, Gazprom Neft PJSC, BASF SE, Illinois Tool Works Inc (ROCOL), Chevron Corporation, Valvoline LLC*List Not Exhaustive, TotalEnergies, Petroliam Nasional Berhad, Idemitsu Kosan Co Ltd, Carl Bechem GmbH, China Petrochemical Corporation (Sinopec), Phillips 66 Company, Eni SpA, SK Lubricants Co Ltd, Veedol International Limited, Indian Oil Corporation Ltd, BP p l c, Blaser Swisslube, Gulf Oil Corporation Limited.
3. What are the main segments of the Lubricants Market?
The market segments include Group, Base Stock, Product Type, End-user Industry.
4. Can you provide details about the market size?
The market size is estimated to be USD XX Million as of 2022.
5. What are some drivers contributing to market growth?
Increasing Usage of High-performance Lubricants; Demand from the Growing Wind Energy Sector; Expansion of the Global Cold Chain Market.
6. What are the notable trends driving market growth?
Automotive and Other Transportation Segment to Dominate the Market.
7. Are there any restraints impacting market growth?
Increasing Drain Intervals in the Automotive and Industrial Sectors; Modest Impact of Electric Vehicles (EVs) in the Future.
8. Can you provide examples of recent developments in the market?
Jan 2024: Shell plc's subsidiary, Shell Lubricants, completes the acquisition of the United Kingdom-based MIDEL and MIVOLT from Manchester-based M&I Materials Ltd. It is to manufacture, distribute, and market the MIDEL and MIVOLT product lines as part of Shell’s global lubricants portfolio.
9. What pricing options are available for accessing the report?
Pricing options include single-user, multi-user, and enterprise licenses priced at USD 4750, USD 5250, and USD 8750 respectively.
10. Is the market size provided in terms of value or volume?
The market size is provided in terms of value, measured in Million and volume, measured in Billion.
11. Are there any specific market keywords associated with the report?
Yes, the market keyword associated with the report is "Lubricants Market," which aids in identifying and referencing the specific market segment covered.
12. How do I determine which pricing option suits my needs best?
The pricing options vary based on user requirements and access needs. Individual users may opt for single-user licenses, while businesses requiring broader access may choose multi-user or enterprise licenses for cost-effective access to the report.
13. Are there any additional resources or data provided in the Lubricants Market report?
While the report offers comprehensive insights, it's advisable to review the specific contents or supplementary materials provided to ascertain if additional resources or data are available.
14. How can I stay updated on further developments or reports in the Lubricants Market?
To stay informed about further developments, trends, and reports in the Lubricants Market, consider subscribing to industry newsletters, following relevant companies and organizations, or regularly checking reputable industry news sources and publications.
Methodology
Step 1 - Identification of Relevant Samples Size from Population Database


Step 2 - Approaches for Defining Global Market Size (Value, Volume* & Price*)

Note*: In applicable scenarios
Step 3 - Data Sources
Primary Research
- Web Analytics
- Survey Reports
- Research Institute
- Latest Research Reports
- Opinion Leaders
Secondary Research
- Annual Reports
- White Paper
- Latest Press Release
- Industry Association
- Paid Database
- Investor Presentations

Step 4 - Data Triangulation
Involves using different sources of information in order to increase the validity of a study
These sources are likely to be stakeholders in a program - participants, other researchers, program staff, other community members, and so on.
Then we put all data in single framework & apply various statistical tools to find out the dynamic on the market.
During the analysis stage, feedback from the stakeholder groups would be compared to determine areas of agreement as well as areas of divergence


