
Key Insights
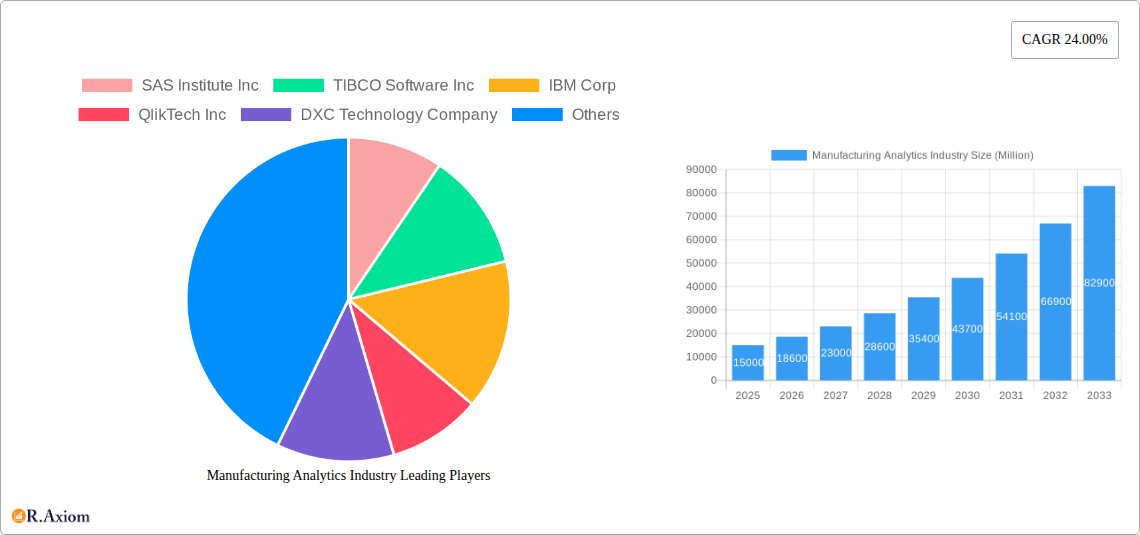
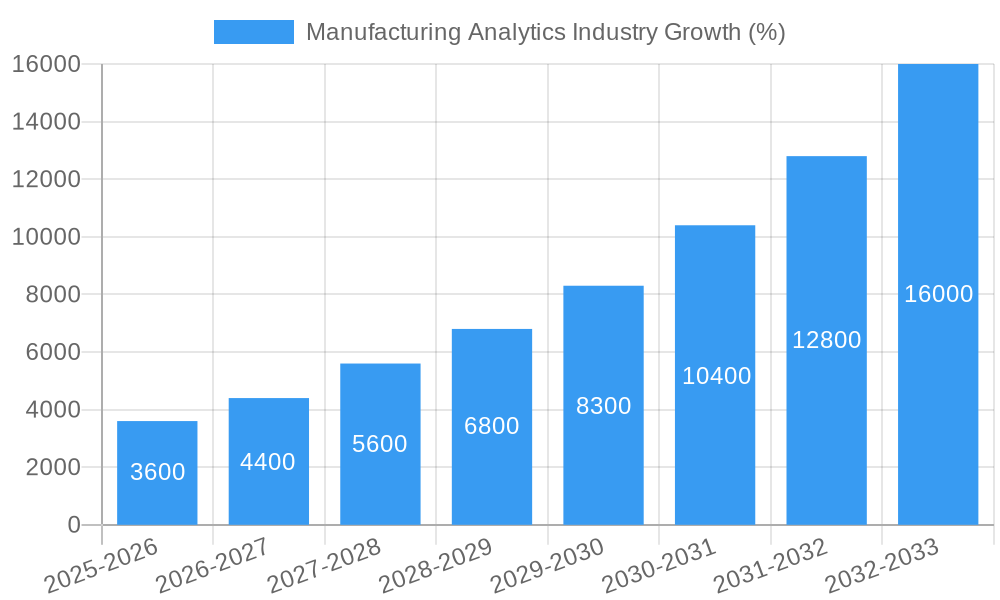
The Manufacturing Analytics market is experiencing robust growth, projected to reach a substantial size by 2033, fueled by a compound annual growth rate (CAGR) of 24%. This expansion is driven by several key factors. Firstly, the increasing adoption of Industry 4.0 technologies, including IoT sensors and cloud computing, provides manufacturers with unprecedented access to real-time data. This data, when analyzed effectively through manufacturing analytics solutions, enables optimized production processes, improved quality control, and reduced operational costs. Secondly, the growing demand for predictive maintenance capabilities is a major catalyst. By leveraging analytics to anticipate equipment failures, manufacturers can minimize downtime, reduce maintenance expenses, and extend the lifespan of their assets. Furthermore, the rising pressure to enhance supply chain efficiency and resilience, especially in the wake of recent global disruptions, is driving the adoption of sophisticated analytics solutions for inventory management and supply chain optimization. This trend is particularly prominent across diverse sectors including electronics, automotive, and pharmaceuticals.
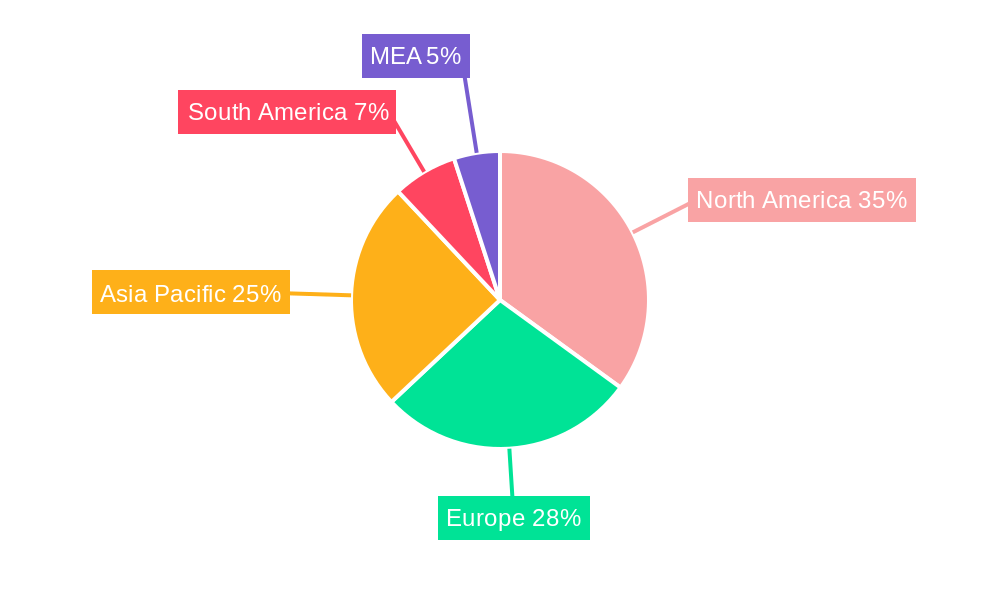
The market is segmented by deployment (cloud-based and on-premise), application (inventory management, supply chain optimization, predictive maintenance, and others), and end-user industry. Cloud-based solutions are gaining traction due to their scalability, accessibility, and cost-effectiveness. The dominance of specific applications will vary depending on industry needs; for instance, predictive maintenance is crucial in capital-intensive industries like Oil & Gas, while inventory management is paramount for efficient operations in the Food & Beverage sector. Leading players like SAS Institute, IBM, and SAP are actively investing in research and development, expanding their product portfolios, and forging strategic partnerships to capitalize on this expanding market. Competition is intense, pushing innovation and resulting in a wider range of sophisticated, user-friendly analytical tools becoming available to manufacturers of all sizes. Geographic growth is expected across all regions, with North America and Asia-Pacific anticipated to retain their leading positions due to established technological infrastructure and substantial manufacturing bases.
Manufacturing Analytics Industry: A Comprehensive Market Report (2019-2033)
This comprehensive report provides an in-depth analysis of the Manufacturing Analytics industry, covering market size, growth drivers, challenges, and opportunities from 2019 to 2033. The study period spans 2019-2033, with 2025 serving as the base and estimated year. The forecast period extends from 2025 to 2033, encompassing historical data from 2019-2024. Key players like SAS Institute Inc, TIBCO Software Inc, IBM Corp, QlikTech Inc, DXC Technology Company, Wipro Limited, Northwest Analytics Inc, Alteryx Inc, Salesforce com Inc (Tableau Software Inc), Oracle Corp, Sisense Inc, General Electric Company, and SAP SE are analyzed in detail. The market is segmented by deployment (cloud-based, on-premise), application (inventory management, supply chain optimization, predictive maintenance, other applications), and end-user industry (electronics, oil & gas, automotive, pharmaceutical, food & beverage, other end-user industries). The report projects a market value exceeding $XX Million by 2033, showcasing substantial growth potential.
Manufacturing Analytics Industry Market Concentration & Innovation
The Manufacturing Analytics market exhibits a moderately concentrated landscape, with a few major players holding significant market share. The estimated combined market share of the top five players (SAS, IBM, TIBCO, Oracle, and SAP) in 2025 is approximately 45%. However, the market also displays considerable innovation, driven by advancements in AI, machine learning, and IoT technologies. These advancements are leading to the development of sophisticated analytics solutions for predictive maintenance, supply chain optimization, and quality control. Regulatory frameworks, such as data privacy regulations (GDPR, CCPA), are influencing market dynamics, while the increasing adoption of cloud-based solutions presents a significant opportunity for growth. Product substitutes, such as traditional manual data analysis methods, are gradually being replaced by more efficient analytics solutions. End-user trends, particularly the increasing focus on Industry 4.0 principles and digital transformation initiatives, are fuelling demand. M&A activities are common, with deal values exceeding $XX Million in recent years, indicating consolidation and expansion within the sector.
- Market Share (2025 Estimate): Top 5 Players: 45%; Others: 55%
- M&A Deal Value (2019-2024): >$XX Million
- Key Innovation Drivers: AI, Machine Learning, IoT
Manufacturing Analytics Industry Industry Trends & Insights
The Manufacturing Analytics market is experiencing robust growth, driven by the rising adoption of smart manufacturing practices and the need for data-driven decision-making. The Compound Annual Growth Rate (CAGR) during the forecast period (2025-2033) is estimated to be XX%, indicating substantial market expansion. Technological disruptions, such as the proliferation of edge computing and the increased availability of real-time data, are transforming the industry. Consumer preferences are shifting towards advanced analytics solutions that provide actionable insights and improve operational efficiency. The competitive landscape is characterized by intense competition among established players and emerging startups, prompting continuous innovation and the development of new product offerings. Market penetration is steadily increasing across various industries, with manufacturers in sectors such as automotive and electronics adopting analytics solutions at a rapid pace. This growth is further propelled by factors such as increasing operational costs and the need for improved process efficiency. The market penetration rate is projected to reach XX% by 2033.
Dominant Markets & Segments in Manufacturing Analytics Industry
North America currently holds the dominant position in the Manufacturing Analytics market, driven by strong technological advancements and the presence of major technology vendors. Within the segments, cloud-based deployment is experiencing the fastest growth, propelled by its scalability and cost-effectiveness. Supply chain optimization applications constitute a significant portion of the market, followed by predictive maintenance. The automotive and electronics industries are the largest end-user segments, owing to their strong focus on automation and efficiency improvements.
- Dominant Region: North America
- Fastest Growing Segment (Deployment): Cloud-based
- Largest Application Segment: Supply Chain Optimization
- Largest End-User Industry: Automotive
Key Drivers (by Segment):
- Cloud-based: Reduced IT infrastructure costs, scalability, accessibility.
- Supply Chain Optimization: Increased focus on efficiency, reduced inventory costs, improved delivery times.
- Automotive: High levels of automation, need for real-time data analytics for improved production efficiency.
Manufacturing Analytics Industry Product Developments
Recent product innovations in the Manufacturing Analytics industry focus on integrating advanced AI and machine learning algorithms to provide real-time insights and predictive capabilities. This has led to the development of more user-friendly interfaces and enhanced visualization tools, making complex data analysis more accessible to manufacturing professionals. Solutions that combine IoT data with analytics are gaining traction, as are specialized platforms designed for specific manufacturing processes. This allows companies to obtain accurate, timely insights for improved decision-making and process optimization. The competitive advantage lies in the ability to provide accurate and timely insights, coupled with user-friendly tools that can be easily integrated into existing workflows.
Report Scope & Segmentation Analysis
This report comprehensively segments the Manufacturing Analytics market by deployment (cloud-based and on-premise), application (inventory management, supply chain optimization, predictive maintenance, and other applications), and end-user industry (electronics, oil & gas, automotive, pharmaceutical, food & beverage, and other industries). Each segment's growth projections, market size, and competitive dynamics are thoroughly analyzed, providing a granular understanding of the market's structure and evolution. The cloud-based segment displays the highest growth potential. Supply chain optimization is the most significant application, followed by predictive maintenance. The automotive and electronics sectors are anticipated to dominate the end-user landscape.
Key Drivers of Manufacturing Analytics Growth
Several factors fuel the growth of the Manufacturing Analytics industry. Technological advancements, particularly in AI and machine learning, enhance the analytical capabilities and predictive power of existing systems. The increasing need for operational efficiency and cost reduction is a major driver, prompting companies to invest in data-driven decision-making. Government regulations promoting Industry 4.0 and digital transformation also contribute, alongside a growing awareness of the value of data analytics in improving manufacturing processes.
Challenges in the Manufacturing Analytics Industry Sector
The Manufacturing Analytics industry faces significant challenges. Data security and privacy concerns necessitate stringent data governance practices. Integrating analytics solutions with legacy systems can be complex and costly. The shortage of skilled data scientists and analysts hampers the effective implementation of analytics solutions. Competition among established players and new entrants is fierce. These challenges, if not addressed effectively, could impede the market's growth trajectory. The estimated impact of these challenges on market growth in 2025 is a reduction of approximately XX%.
Emerging Opportunities in Manufacturing Analytics Industry
The rise of edge computing and 5G technologies presents significant opportunities for the Manufacturing Analytics market. The increasing demand for predictive maintenance and real-time analytics is driving innovation in this space. The development of advanced analytics solutions specifically tailored for niche manufacturing segments presents an opportunity for market expansion. Increased investment in digital transformation initiatives by manufacturers is a key driver for growth, creating significant demand for these products.
Leading Players in the Manufacturing Analytics Industry Market
- SAS Institute Inc
- TIBCO Software Inc
- IBM Corp
- QlikTech Inc
- DXC Technology Company
- Wipro Limited
- Northwest Analytics Inc
- Alteryx Inc
- Salesforce com Inc (Tableau Software Inc)
- Oracle Corp
- Sisense Inc
- General Electric Company
- SAP SE
Key Developments in Manufacturing Analytics Industry
- Jan 2023: SAS Institute Inc. launched a new AI-powered analytics platform for manufacturing.
- Mar 2022: TIBCO Software Inc. acquired a predictive maintenance startup.
- June 2021: IBM Corp. announced a strategic partnership with a major automotive manufacturer to implement a comprehensive manufacturing analytics solution.
- (Further developments to be added based on available data)
Strategic Outlook for Manufacturing Analytics Industry Market
The Manufacturing Analytics market is poised for continued growth, driven by technological innovation and the increasing adoption of Industry 4.0 principles. The market is expected to witness significant expansion in emerging economies, with increased investment in digital transformation projects, fueled by a rise in data volume and the need for process optimization. Focus on specialized solutions tailored to specific industry needs and enhanced data security features will drive future growth and market penetration.
Manufacturing Analytics Industry Segmentation
-
1. Deployment
- 1.1. Cloud-based
- 1.2. On-premise
-
2. Appllication
- 2.1. Inventory Management
- 2.2. Supply Chain Optimization
- 2.3. Predictive Maintenance
- 2.4. Other Applications
-
3. End-user Industry
- 3.1. Electronics
- 3.2. Oil & Gas
- 3.3. Automotive
- 3.4. Pharmaceutical
- 3.5. Food & Beverage
- 3.6. Other End-user Industries
Manufacturing Analytics Industry Segmentation By Geography
- 1. North America
- 2. Europe
- 3. Asia Pacific
- 4. Latin America
- 5. Middle East
Manufacturing Analytics Industry REPORT HIGHLIGHTS
| Aspects | Details |
|---|---|
| Study Period | 2019-2033 |
| Base Year | 2024 |
| Estimated Year | 2025 |
| Forecast Period | 2025-2033 |
| Historical Period | 2019-2024 |
| Growth Rate | CAGR of 24.00% from 2019-2033 |
| Segmentation |
|
Table of Contents
- 1. Introduction
- 1.1. Research Scope
- 1.2. Market Segmentation
- 1.3. Research Methodology
- 1.4. Definitions and Assumptions
- 2. Executive Summary
- 2.1. Introduction
- 3. Market Dynamics
- 3.1. Introduction
- 3.2. Market Drivers
- 3.2.1. ; Adoption of BI and Advanced Data Management Strategies in Manufacturing Applications; Increasing Application of Industry 4.0 Across Various Segments of Manufacturing Industries
- 3.3. Market Restrains
- 3.3.1. ; High Initial Investment in the Transation of IIoT Across Industrial Region
- 3.4. Market Trends
- 3.4.1. Automotive Sector is Expected to Grow at a Significant Rate
- 4. Market Factor Analysis
- 4.1. Porters Five Forces
- 4.2. Supply/Value Chain
- 4.3. PESTEL analysis
- 4.4. Market Entropy
- 4.5. Patent/Trademark Analysis
- 5. Global Manufacturing Analytics Industry Analysis, Insights and Forecast, 2019-2031
- 5.1. Market Analysis, Insights and Forecast - by Deployment
- 5.1.1. Cloud-based
- 5.1.2. On-premise
- 5.2. Market Analysis, Insights and Forecast - by Appllication
- 5.2.1. Inventory Management
- 5.2.2. Supply Chain Optimization
- 5.2.3. Predictive Maintenance
- 5.2.4. Other Applications
- 5.3. Market Analysis, Insights and Forecast - by End-user Industry
- 5.3.1. Electronics
- 5.3.2. Oil & Gas
- 5.3.3. Automotive
- 5.3.4. Pharmaceutical
- 5.3.5. Food & Beverage
- 5.3.6. Other End-user Industries
- 5.4. Market Analysis, Insights and Forecast - by Region
- 5.4.1. North America
- 5.4.2. Europe
- 5.4.3. Asia Pacific
- 5.4.4. Latin America
- 5.4.5. Middle East
- 5.1. Market Analysis, Insights and Forecast - by Deployment
- 6. North America Manufacturing Analytics Industry Analysis, Insights and Forecast, 2019-2031
- 6.1. Market Analysis, Insights and Forecast - by Deployment
- 6.1.1. Cloud-based
- 6.1.2. On-premise
- 6.2. Market Analysis, Insights and Forecast - by Appllication
- 6.2.1. Inventory Management
- 6.2.2. Supply Chain Optimization
- 6.2.3. Predictive Maintenance
- 6.2.4. Other Applications
- 6.3. Market Analysis, Insights and Forecast - by End-user Industry
- 6.3.1. Electronics
- 6.3.2. Oil & Gas
- 6.3.3. Automotive
- 6.3.4. Pharmaceutical
- 6.3.5. Food & Beverage
- 6.3.6. Other End-user Industries
- 6.1. Market Analysis, Insights and Forecast - by Deployment
- 7. Europe Manufacturing Analytics Industry Analysis, Insights and Forecast, 2019-2031
- 7.1. Market Analysis, Insights and Forecast - by Deployment
- 7.1.1. Cloud-based
- 7.1.2. On-premise
- 7.2. Market Analysis, Insights and Forecast - by Appllication
- 7.2.1. Inventory Management
- 7.2.2. Supply Chain Optimization
- 7.2.3. Predictive Maintenance
- 7.2.4. Other Applications
- 7.3. Market Analysis, Insights and Forecast - by End-user Industry
- 7.3.1. Electronics
- 7.3.2. Oil & Gas
- 7.3.3. Automotive
- 7.3.4. Pharmaceutical
- 7.3.5. Food & Beverage
- 7.3.6. Other End-user Industries
- 7.1. Market Analysis, Insights and Forecast - by Deployment
- 8. Asia Pacific Manufacturing Analytics Industry Analysis, Insights and Forecast, 2019-2031
- 8.1. Market Analysis, Insights and Forecast - by Deployment
- 8.1.1. Cloud-based
- 8.1.2. On-premise
- 8.2. Market Analysis, Insights and Forecast - by Appllication
- 8.2.1. Inventory Management
- 8.2.2. Supply Chain Optimization
- 8.2.3. Predictive Maintenance
- 8.2.4. Other Applications
- 8.3. Market Analysis, Insights and Forecast - by End-user Industry
- 8.3.1. Electronics
- 8.3.2. Oil & Gas
- 8.3.3. Automotive
- 8.3.4. Pharmaceutical
- 8.3.5. Food & Beverage
- 8.3.6. Other End-user Industries
- 8.1. Market Analysis, Insights and Forecast - by Deployment
- 9. Latin America Manufacturing Analytics Industry Analysis, Insights and Forecast, 2019-2031
- 9.1. Market Analysis, Insights and Forecast - by Deployment
- 9.1.1. Cloud-based
- 9.1.2. On-premise
- 9.2. Market Analysis, Insights and Forecast - by Appllication
- 9.2.1. Inventory Management
- 9.2.2. Supply Chain Optimization
- 9.2.3. Predictive Maintenance
- 9.2.4. Other Applications
- 9.3. Market Analysis, Insights and Forecast - by End-user Industry
- 9.3.1. Electronics
- 9.3.2. Oil & Gas
- 9.3.3. Automotive
- 9.3.4. Pharmaceutical
- 9.3.5. Food & Beverage
- 9.3.6. Other End-user Industries
- 9.1. Market Analysis, Insights and Forecast - by Deployment
- 10. Middle East Manufacturing Analytics Industry Analysis, Insights and Forecast, 2019-2031
- 10.1. Market Analysis, Insights and Forecast - by Deployment
- 10.1.1. Cloud-based
- 10.1.2. On-premise
- 10.2. Market Analysis, Insights and Forecast - by Appllication
- 10.2.1. Inventory Management
- 10.2.2. Supply Chain Optimization
- 10.2.3. Predictive Maintenance
- 10.2.4. Other Applications
- 10.3. Market Analysis, Insights and Forecast - by End-user Industry
- 10.3.1. Electronics
- 10.3.2. Oil & Gas
- 10.3.3. Automotive
- 10.3.4. Pharmaceutical
- 10.3.5. Food & Beverage
- 10.3.6. Other End-user Industries
- 10.1. Market Analysis, Insights and Forecast - by Deployment
- 11. North America Manufacturing Analytics Industry Analysis, Insights and Forecast, 2019-2031
- 11.1. Market Analysis, Insights and Forecast - By Country/Sub-region
- 11.1.1 United States
- 11.1.2 Canada
- 11.1.3 Mexico
- 12. Europe Manufacturing Analytics Industry Analysis, Insights and Forecast, 2019-2031
- 12.1. Market Analysis, Insights and Forecast - By Country/Sub-region
- 12.1.1 Germany
- 12.1.2 United Kingdom
- 12.1.3 France
- 12.1.4 Spain
- 12.1.5 Italy
- 12.1.6 Spain
- 12.1.7 Belgium
- 12.1.8 Netherland
- 12.1.9 Nordics
- 12.1.10 Rest of Europe
- 13. Asia Pacific Manufacturing Analytics Industry Analysis, Insights and Forecast, 2019-2031
- 13.1. Market Analysis, Insights and Forecast - By Country/Sub-region
- 13.1.1 China
- 13.1.2 Japan
- 13.1.3 India
- 13.1.4 South Korea
- 13.1.5 Southeast Asia
- 13.1.6 Australia
- 13.1.7 Indonesia
- 13.1.8 Phillipes
- 13.1.9 Singapore
- 13.1.10 Thailandc
- 13.1.11 Rest of Asia Pacific
- 14. South America Manufacturing Analytics Industry Analysis, Insights and Forecast, 2019-2031
- 14.1. Market Analysis, Insights and Forecast - By Country/Sub-region
- 14.1.1 Brazil
- 14.1.2 Argentina
- 14.1.3 Peru
- 14.1.4 Chile
- 14.1.5 Colombia
- 14.1.6 Ecuador
- 14.1.7 Venezuela
- 14.1.8 Rest of South America
- 15. North America Manufacturing Analytics Industry Analysis, Insights and Forecast, 2019-2031
- 15.1. Market Analysis, Insights and Forecast - By Country/Sub-region
- 15.1.1 United States
- 15.1.2 Canada
- 15.1.3 Mexico
- 16. MEA Manufacturing Analytics Industry Analysis, Insights and Forecast, 2019-2031
- 16.1. Market Analysis, Insights and Forecast - By Country/Sub-region
- 16.1.1 United Arab Emirates
- 16.1.2 Saudi Arabia
- 16.1.3 South Africa
- 16.1.4 Rest of Middle East and Africa
- 17. Competitive Analysis
- 17.1. Global Market Share Analysis 2024
- 17.2. Company Profiles
- 17.2.1 SAS Institute Inc
- 17.2.1.1. Overview
- 17.2.1.2. Products
- 17.2.1.3. SWOT Analysis
- 17.2.1.4. Recent Developments
- 17.2.1.5. Financials (Based on Availability)
- 17.2.2 TIBCO Software Inc
- 17.2.2.1. Overview
- 17.2.2.2. Products
- 17.2.2.3. SWOT Analysis
- 17.2.2.4. Recent Developments
- 17.2.2.5. Financials (Based on Availability)
- 17.2.3 IBM Corp
- 17.2.3.1. Overview
- 17.2.3.2. Products
- 17.2.3.3. SWOT Analysis
- 17.2.3.4. Recent Developments
- 17.2.3.5. Financials (Based on Availability)
- 17.2.4 QlikTech Inc
- 17.2.4.1. Overview
- 17.2.4.2. Products
- 17.2.4.3. SWOT Analysis
- 17.2.4.4. Recent Developments
- 17.2.4.5. Financials (Based on Availability)
- 17.2.5 DXC Technology Company
- 17.2.5.1. Overview
- 17.2.5.2. Products
- 17.2.5.3. SWOT Analysis
- 17.2.5.4. Recent Developments
- 17.2.5.5. Financials (Based on Availability)
- 17.2.6 Wipro Limited
- 17.2.6.1. Overview
- 17.2.6.2. Products
- 17.2.6.3. SWOT Analysis
- 17.2.6.4. Recent Developments
- 17.2.6.5. Financials (Based on Availability)
- 17.2.7 Northwest Analytics Inc
- 17.2.7.1. Overview
- 17.2.7.2. Products
- 17.2.7.3. SWOT Analysis
- 17.2.7.4. Recent Developments
- 17.2.7.5. Financials (Based on Availability)
- 17.2.8 Alteryx Inc
- 17.2.8.1. Overview
- 17.2.8.2. Products
- 17.2.8.3. SWOT Analysis
- 17.2.8.4. Recent Developments
- 17.2.8.5. Financials (Based on Availability)
- 17.2.9 Salesforce com Inc (Tableau Software Inc )
- 17.2.9.1. Overview
- 17.2.9.2. Products
- 17.2.9.3. SWOT Analysis
- 17.2.9.4. Recent Developments
- 17.2.9.5. Financials (Based on Availability)
- 17.2.10 Oracle Corp
- 17.2.10.1. Overview
- 17.2.10.2. Products
- 17.2.10.3. SWOT Analysis
- 17.2.10.4. Recent Developments
- 17.2.10.5. Financials (Based on Availability)
- 17.2.11 Sisense Inc
- 17.2.11.1. Overview
- 17.2.11.2. Products
- 17.2.11.3. SWOT Analysis
- 17.2.11.4. Recent Developments
- 17.2.11.5. Financials (Based on Availability)
- 17.2.12 General Electric Company
- 17.2.12.1. Overview
- 17.2.12.2. Products
- 17.2.12.3. SWOT Analysis
- 17.2.12.4. Recent Developments
- 17.2.12.5. Financials (Based on Availability)
- 17.2.13 SAP SE
- 17.2.13.1. Overview
- 17.2.13.2. Products
- 17.2.13.3. SWOT Analysis
- 17.2.13.4. Recent Developments
- 17.2.13.5. Financials (Based on Availability)
- 17.2.1 SAS Institute Inc
List of Figures
- Figure 1: Global Manufacturing Analytics Industry Revenue Breakdown (Million, %) by Region 2024 & 2032
- Figure 2: Global Manufacturing Analytics Industry Volume Breakdown (K Unit, %) by Region 2024 & 2032
- Figure 3: North America Manufacturing Analytics Industry Revenue (Million), by Country 2024 & 2032
- Figure 4: North America Manufacturing Analytics Industry Volume (K Unit), by Country 2024 & 2032
- Figure 5: North America Manufacturing Analytics Industry Revenue Share (%), by Country 2024 & 2032
- Figure 6: North America Manufacturing Analytics Industry Volume Share (%), by Country 2024 & 2032
- Figure 7: Europe Manufacturing Analytics Industry Revenue (Million), by Country 2024 & 2032
- Figure 8: Europe Manufacturing Analytics Industry Volume (K Unit), by Country 2024 & 2032
- Figure 9: Europe Manufacturing Analytics Industry Revenue Share (%), by Country 2024 & 2032
- Figure 10: Europe Manufacturing Analytics Industry Volume Share (%), by Country 2024 & 2032
- Figure 11: Asia Pacific Manufacturing Analytics Industry Revenue (Million), by Country 2024 & 2032
- Figure 12: Asia Pacific Manufacturing Analytics Industry Volume (K Unit), by Country 2024 & 2032
- Figure 13: Asia Pacific Manufacturing Analytics Industry Revenue Share (%), by Country 2024 & 2032
- Figure 14: Asia Pacific Manufacturing Analytics Industry Volume Share (%), by Country 2024 & 2032
- Figure 15: South America Manufacturing Analytics Industry Revenue (Million), by Country 2024 & 2032
- Figure 16: South America Manufacturing Analytics Industry Volume (K Unit), by Country 2024 & 2032
- Figure 17: South America Manufacturing Analytics Industry Revenue Share (%), by Country 2024 & 2032
- Figure 18: South America Manufacturing Analytics Industry Volume Share (%), by Country 2024 & 2032
- Figure 19: North America Manufacturing Analytics Industry Revenue (Million), by Country 2024 & 2032
- Figure 20: North America Manufacturing Analytics Industry Volume (K Unit), by Country 2024 & 2032
- Figure 21: North America Manufacturing Analytics Industry Revenue Share (%), by Country 2024 & 2032
- Figure 22: North America Manufacturing Analytics Industry Volume Share (%), by Country 2024 & 2032
- Figure 23: MEA Manufacturing Analytics Industry Revenue (Million), by Country 2024 & 2032
- Figure 24: MEA Manufacturing Analytics Industry Volume (K Unit), by Country 2024 & 2032
- Figure 25: MEA Manufacturing Analytics Industry Revenue Share (%), by Country 2024 & 2032
- Figure 26: MEA Manufacturing Analytics Industry Volume Share (%), by Country 2024 & 2032
- Figure 27: North America Manufacturing Analytics Industry Revenue (Million), by Deployment 2024 & 2032
- Figure 28: North America Manufacturing Analytics Industry Volume (K Unit), by Deployment 2024 & 2032
- Figure 29: North America Manufacturing Analytics Industry Revenue Share (%), by Deployment 2024 & 2032
- Figure 30: North America Manufacturing Analytics Industry Volume Share (%), by Deployment 2024 & 2032
- Figure 31: North America Manufacturing Analytics Industry Revenue (Million), by Appllication 2024 & 2032
- Figure 32: North America Manufacturing Analytics Industry Volume (K Unit), by Appllication 2024 & 2032
- Figure 33: North America Manufacturing Analytics Industry Revenue Share (%), by Appllication 2024 & 2032
- Figure 34: North America Manufacturing Analytics Industry Volume Share (%), by Appllication 2024 & 2032
- Figure 35: North America Manufacturing Analytics Industry Revenue (Million), by End-user Industry 2024 & 2032
- Figure 36: North America Manufacturing Analytics Industry Volume (K Unit), by End-user Industry 2024 & 2032
- Figure 37: North America Manufacturing Analytics Industry Revenue Share (%), by End-user Industry 2024 & 2032
- Figure 38: North America Manufacturing Analytics Industry Volume Share (%), by End-user Industry 2024 & 2032
- Figure 39: North America Manufacturing Analytics Industry Revenue (Million), by Country 2024 & 2032
- Figure 40: North America Manufacturing Analytics Industry Volume (K Unit), by Country 2024 & 2032
- Figure 41: North America Manufacturing Analytics Industry Revenue Share (%), by Country 2024 & 2032
- Figure 42: North America Manufacturing Analytics Industry Volume Share (%), by Country 2024 & 2032
- Figure 43: Europe Manufacturing Analytics Industry Revenue (Million), by Deployment 2024 & 2032
- Figure 44: Europe Manufacturing Analytics Industry Volume (K Unit), by Deployment 2024 & 2032
- Figure 45: Europe Manufacturing Analytics Industry Revenue Share (%), by Deployment 2024 & 2032
- Figure 46: Europe Manufacturing Analytics Industry Volume Share (%), by Deployment 2024 & 2032
- Figure 47: Europe Manufacturing Analytics Industry Revenue (Million), by Appllication 2024 & 2032
- Figure 48: Europe Manufacturing Analytics Industry Volume (K Unit), by Appllication 2024 & 2032
- Figure 49: Europe Manufacturing Analytics Industry Revenue Share (%), by Appllication 2024 & 2032
- Figure 50: Europe Manufacturing Analytics Industry Volume Share (%), by Appllication 2024 & 2032
- Figure 51: Europe Manufacturing Analytics Industry Revenue (Million), by End-user Industry 2024 & 2032
- Figure 52: Europe Manufacturing Analytics Industry Volume (K Unit), by End-user Industry 2024 & 2032
- Figure 53: Europe Manufacturing Analytics Industry Revenue Share (%), by End-user Industry 2024 & 2032
- Figure 54: Europe Manufacturing Analytics Industry Volume Share (%), by End-user Industry 2024 & 2032
- Figure 55: Europe Manufacturing Analytics Industry Revenue (Million), by Country 2024 & 2032
- Figure 56: Europe Manufacturing Analytics Industry Volume (K Unit), by Country 2024 & 2032
- Figure 57: Europe Manufacturing Analytics Industry Revenue Share (%), by Country 2024 & 2032
- Figure 58: Europe Manufacturing Analytics Industry Volume Share (%), by Country 2024 & 2032
- Figure 59: Asia Pacific Manufacturing Analytics Industry Revenue (Million), by Deployment 2024 & 2032
- Figure 60: Asia Pacific Manufacturing Analytics Industry Volume (K Unit), by Deployment 2024 & 2032
- Figure 61: Asia Pacific Manufacturing Analytics Industry Revenue Share (%), by Deployment 2024 & 2032
- Figure 62: Asia Pacific Manufacturing Analytics Industry Volume Share (%), by Deployment 2024 & 2032
- Figure 63: Asia Pacific Manufacturing Analytics Industry Revenue (Million), by Appllication 2024 & 2032
- Figure 64: Asia Pacific Manufacturing Analytics Industry Volume (K Unit), by Appllication 2024 & 2032
- Figure 65: Asia Pacific Manufacturing Analytics Industry Revenue Share (%), by Appllication 2024 & 2032
- Figure 66: Asia Pacific Manufacturing Analytics Industry Volume Share (%), by Appllication 2024 & 2032
- Figure 67: Asia Pacific Manufacturing Analytics Industry Revenue (Million), by End-user Industry 2024 & 2032
- Figure 68: Asia Pacific Manufacturing Analytics Industry Volume (K Unit), by End-user Industry 2024 & 2032
- Figure 69: Asia Pacific Manufacturing Analytics Industry Revenue Share (%), by End-user Industry 2024 & 2032
- Figure 70: Asia Pacific Manufacturing Analytics Industry Volume Share (%), by End-user Industry 2024 & 2032
- Figure 71: Asia Pacific Manufacturing Analytics Industry Revenue (Million), by Country 2024 & 2032
- Figure 72: Asia Pacific Manufacturing Analytics Industry Volume (K Unit), by Country 2024 & 2032
- Figure 73: Asia Pacific Manufacturing Analytics Industry Revenue Share (%), by Country 2024 & 2032
- Figure 74: Asia Pacific Manufacturing Analytics Industry Volume Share (%), by Country 2024 & 2032
- Figure 75: Latin America Manufacturing Analytics Industry Revenue (Million), by Deployment 2024 & 2032
- Figure 76: Latin America Manufacturing Analytics Industry Volume (K Unit), by Deployment 2024 & 2032
- Figure 77: Latin America Manufacturing Analytics Industry Revenue Share (%), by Deployment 2024 & 2032
- Figure 78: Latin America Manufacturing Analytics Industry Volume Share (%), by Deployment 2024 & 2032
- Figure 79: Latin America Manufacturing Analytics Industry Revenue (Million), by Appllication 2024 & 2032
- Figure 80: Latin America Manufacturing Analytics Industry Volume (K Unit), by Appllication 2024 & 2032
- Figure 81: Latin America Manufacturing Analytics Industry Revenue Share (%), by Appllication 2024 & 2032
- Figure 82: Latin America Manufacturing Analytics Industry Volume Share (%), by Appllication 2024 & 2032
- Figure 83: Latin America Manufacturing Analytics Industry Revenue (Million), by End-user Industry 2024 & 2032
- Figure 84: Latin America Manufacturing Analytics Industry Volume (K Unit), by End-user Industry 2024 & 2032
- Figure 85: Latin America Manufacturing Analytics Industry Revenue Share (%), by End-user Industry 2024 & 2032
- Figure 86: Latin America Manufacturing Analytics Industry Volume Share (%), by End-user Industry 2024 & 2032
- Figure 87: Latin America Manufacturing Analytics Industry Revenue (Million), by Country 2024 & 2032
- Figure 88: Latin America Manufacturing Analytics Industry Volume (K Unit), by Country 2024 & 2032
- Figure 89: Latin America Manufacturing Analytics Industry Revenue Share (%), by Country 2024 & 2032
- Figure 90: Latin America Manufacturing Analytics Industry Volume Share (%), by Country 2024 & 2032
- Figure 91: Middle East Manufacturing Analytics Industry Revenue (Million), by Deployment 2024 & 2032
- Figure 92: Middle East Manufacturing Analytics Industry Volume (K Unit), by Deployment 2024 & 2032
- Figure 93: Middle East Manufacturing Analytics Industry Revenue Share (%), by Deployment 2024 & 2032
- Figure 94: Middle East Manufacturing Analytics Industry Volume Share (%), by Deployment 2024 & 2032
- Figure 95: Middle East Manufacturing Analytics Industry Revenue (Million), by Appllication 2024 & 2032
- Figure 96: Middle East Manufacturing Analytics Industry Volume (K Unit), by Appllication 2024 & 2032
- Figure 97: Middle East Manufacturing Analytics Industry Revenue Share (%), by Appllication 2024 & 2032
- Figure 98: Middle East Manufacturing Analytics Industry Volume Share (%), by Appllication 2024 & 2032
- Figure 99: Middle East Manufacturing Analytics Industry Revenue (Million), by End-user Industry 2024 & 2032
- Figure 100: Middle East Manufacturing Analytics Industry Volume (K Unit), by End-user Industry 2024 & 2032
- Figure 101: Middle East Manufacturing Analytics Industry Revenue Share (%), by End-user Industry 2024 & 2032
- Figure 102: Middle East Manufacturing Analytics Industry Volume Share (%), by End-user Industry 2024 & 2032
- Figure 103: Middle East Manufacturing Analytics Industry Revenue (Million), by Country 2024 & 2032
- Figure 104: Middle East Manufacturing Analytics Industry Volume (K Unit), by Country 2024 & 2032
- Figure 105: Middle East Manufacturing Analytics Industry Revenue Share (%), by Country 2024 & 2032
- Figure 106: Middle East Manufacturing Analytics Industry Volume Share (%), by Country 2024 & 2032
List of Tables
- Table 1: Global Manufacturing Analytics Industry Revenue Million Forecast, by Region 2019 & 2032
- Table 2: Global Manufacturing Analytics Industry Volume K Unit Forecast, by Region 2019 & 2032
- Table 3: Global Manufacturing Analytics Industry Revenue Million Forecast, by Deployment 2019 & 2032
- Table 4: Global Manufacturing Analytics Industry Volume K Unit Forecast, by Deployment 2019 & 2032
- Table 5: Global Manufacturing Analytics Industry Revenue Million Forecast, by Appllication 2019 & 2032
- Table 6: Global Manufacturing Analytics Industry Volume K Unit Forecast, by Appllication 2019 & 2032
- Table 7: Global Manufacturing Analytics Industry Revenue Million Forecast, by End-user Industry 2019 & 2032
- Table 8: Global Manufacturing Analytics Industry Volume K Unit Forecast, by End-user Industry 2019 & 2032
- Table 9: Global Manufacturing Analytics Industry Revenue Million Forecast, by Region 2019 & 2032
- Table 10: Global Manufacturing Analytics Industry Volume K Unit Forecast, by Region 2019 & 2032
- Table 11: Global Manufacturing Analytics Industry Revenue Million Forecast, by Country 2019 & 2032
- Table 12: Global Manufacturing Analytics Industry Volume K Unit Forecast, by Country 2019 & 2032
- Table 13: United States Manufacturing Analytics Industry Revenue (Million) Forecast, by Application 2019 & 2032
- Table 14: United States Manufacturing Analytics Industry Volume (K Unit) Forecast, by Application 2019 & 2032
- Table 15: Canada Manufacturing Analytics Industry Revenue (Million) Forecast, by Application 2019 & 2032
- Table 16: Canada Manufacturing Analytics Industry Volume (K Unit) Forecast, by Application 2019 & 2032
- Table 17: Mexico Manufacturing Analytics Industry Revenue (Million) Forecast, by Application 2019 & 2032
- Table 18: Mexico Manufacturing Analytics Industry Volume (K Unit) Forecast, by Application 2019 & 2032
- Table 19: Global Manufacturing Analytics Industry Revenue Million Forecast, by Country 2019 & 2032
- Table 20: Global Manufacturing Analytics Industry Volume K Unit Forecast, by Country 2019 & 2032
- Table 21: Germany Manufacturing Analytics Industry Revenue (Million) Forecast, by Application 2019 & 2032
- Table 22: Germany Manufacturing Analytics Industry Volume (K Unit) Forecast, by Application 2019 & 2032
- Table 23: United Kingdom Manufacturing Analytics Industry Revenue (Million) Forecast, by Application 2019 & 2032
- Table 24: United Kingdom Manufacturing Analytics Industry Volume (K Unit) Forecast, by Application 2019 & 2032
- Table 25: France Manufacturing Analytics Industry Revenue (Million) Forecast, by Application 2019 & 2032
- Table 26: France Manufacturing Analytics Industry Volume (K Unit) Forecast, by Application 2019 & 2032
- Table 27: Spain Manufacturing Analytics Industry Revenue (Million) Forecast, by Application 2019 & 2032
- Table 28: Spain Manufacturing Analytics Industry Volume (K Unit) Forecast, by Application 2019 & 2032
- Table 29: Italy Manufacturing Analytics Industry Revenue (Million) Forecast, by Application 2019 & 2032
- Table 30: Italy Manufacturing Analytics Industry Volume (K Unit) Forecast, by Application 2019 & 2032
- Table 31: Spain Manufacturing Analytics Industry Revenue (Million) Forecast, by Application 2019 & 2032
- Table 32: Spain Manufacturing Analytics Industry Volume (K Unit) Forecast, by Application 2019 & 2032
- Table 33: Belgium Manufacturing Analytics Industry Revenue (Million) Forecast, by Application 2019 & 2032
- Table 34: Belgium Manufacturing Analytics Industry Volume (K Unit) Forecast, by Application 2019 & 2032
- Table 35: Netherland Manufacturing Analytics Industry Revenue (Million) Forecast, by Application 2019 & 2032
- Table 36: Netherland Manufacturing Analytics Industry Volume (K Unit) Forecast, by Application 2019 & 2032
- Table 37: Nordics Manufacturing Analytics Industry Revenue (Million) Forecast, by Application 2019 & 2032
- Table 38: Nordics Manufacturing Analytics Industry Volume (K Unit) Forecast, by Application 2019 & 2032
- Table 39: Rest of Europe Manufacturing Analytics Industry Revenue (Million) Forecast, by Application 2019 & 2032
- Table 40: Rest of Europe Manufacturing Analytics Industry Volume (K Unit) Forecast, by Application 2019 & 2032
- Table 41: Global Manufacturing Analytics Industry Revenue Million Forecast, by Country 2019 & 2032
- Table 42: Global Manufacturing Analytics Industry Volume K Unit Forecast, by Country 2019 & 2032
- Table 43: China Manufacturing Analytics Industry Revenue (Million) Forecast, by Application 2019 & 2032
- Table 44: China Manufacturing Analytics Industry Volume (K Unit) Forecast, by Application 2019 & 2032
- Table 45: Japan Manufacturing Analytics Industry Revenue (Million) Forecast, by Application 2019 & 2032
- Table 46: Japan Manufacturing Analytics Industry Volume (K Unit) Forecast, by Application 2019 & 2032
- Table 47: India Manufacturing Analytics Industry Revenue (Million) Forecast, by Application 2019 & 2032
- Table 48: India Manufacturing Analytics Industry Volume (K Unit) Forecast, by Application 2019 & 2032
- Table 49: South Korea Manufacturing Analytics Industry Revenue (Million) Forecast, by Application 2019 & 2032
- Table 50: South Korea Manufacturing Analytics Industry Volume (K Unit) Forecast, by Application 2019 & 2032
- Table 51: Southeast Asia Manufacturing Analytics Industry Revenue (Million) Forecast, by Application 2019 & 2032
- Table 52: Southeast Asia Manufacturing Analytics Industry Volume (K Unit) Forecast, by Application 2019 & 2032
- Table 53: Australia Manufacturing Analytics Industry Revenue (Million) Forecast, by Application 2019 & 2032
- Table 54: Australia Manufacturing Analytics Industry Volume (K Unit) Forecast, by Application 2019 & 2032
- Table 55: Indonesia Manufacturing Analytics Industry Revenue (Million) Forecast, by Application 2019 & 2032
- Table 56: Indonesia Manufacturing Analytics Industry Volume (K Unit) Forecast, by Application 2019 & 2032
- Table 57: Phillipes Manufacturing Analytics Industry Revenue (Million) Forecast, by Application 2019 & 2032
- Table 58: Phillipes Manufacturing Analytics Industry Volume (K Unit) Forecast, by Application 2019 & 2032
- Table 59: Singapore Manufacturing Analytics Industry Revenue (Million) Forecast, by Application 2019 & 2032
- Table 60: Singapore Manufacturing Analytics Industry Volume (K Unit) Forecast, by Application 2019 & 2032
- Table 61: Thailandc Manufacturing Analytics Industry Revenue (Million) Forecast, by Application 2019 & 2032
- Table 62: Thailandc Manufacturing Analytics Industry Volume (K Unit) Forecast, by Application 2019 & 2032
- Table 63: Rest of Asia Pacific Manufacturing Analytics Industry Revenue (Million) Forecast, by Application 2019 & 2032
- Table 64: Rest of Asia Pacific Manufacturing Analytics Industry Volume (K Unit) Forecast, by Application 2019 & 2032
- Table 65: Global Manufacturing Analytics Industry Revenue Million Forecast, by Country 2019 & 2032
- Table 66: Global Manufacturing Analytics Industry Volume K Unit Forecast, by Country 2019 & 2032
- Table 67: Brazil Manufacturing Analytics Industry Revenue (Million) Forecast, by Application 2019 & 2032
- Table 68: Brazil Manufacturing Analytics Industry Volume (K Unit) Forecast, by Application 2019 & 2032
- Table 69: Argentina Manufacturing Analytics Industry Revenue (Million) Forecast, by Application 2019 & 2032
- Table 70: Argentina Manufacturing Analytics Industry Volume (K Unit) Forecast, by Application 2019 & 2032
- Table 71: Peru Manufacturing Analytics Industry Revenue (Million) Forecast, by Application 2019 & 2032
- Table 72: Peru Manufacturing Analytics Industry Volume (K Unit) Forecast, by Application 2019 & 2032
- Table 73: Chile Manufacturing Analytics Industry Revenue (Million) Forecast, by Application 2019 & 2032
- Table 74: Chile Manufacturing Analytics Industry Volume (K Unit) Forecast, by Application 2019 & 2032
- Table 75: Colombia Manufacturing Analytics Industry Revenue (Million) Forecast, by Application 2019 & 2032
- Table 76: Colombia Manufacturing Analytics Industry Volume (K Unit) Forecast, by Application 2019 & 2032
- Table 77: Ecuador Manufacturing Analytics Industry Revenue (Million) Forecast, by Application 2019 & 2032
- Table 78: Ecuador Manufacturing Analytics Industry Volume (K Unit) Forecast, by Application 2019 & 2032
- Table 79: Venezuela Manufacturing Analytics Industry Revenue (Million) Forecast, by Application 2019 & 2032
- Table 80: Venezuela Manufacturing Analytics Industry Volume (K Unit) Forecast, by Application 2019 & 2032
- Table 81: Rest of South America Manufacturing Analytics Industry Revenue (Million) Forecast, by Application 2019 & 2032
- Table 82: Rest of South America Manufacturing Analytics Industry Volume (K Unit) Forecast, by Application 2019 & 2032
- Table 83: Global Manufacturing Analytics Industry Revenue Million Forecast, by Country 2019 & 2032
- Table 84: Global Manufacturing Analytics Industry Volume K Unit Forecast, by Country 2019 & 2032
- Table 85: United States Manufacturing Analytics Industry Revenue (Million) Forecast, by Application 2019 & 2032
- Table 86: United States Manufacturing Analytics Industry Volume (K Unit) Forecast, by Application 2019 & 2032
- Table 87: Canada Manufacturing Analytics Industry Revenue (Million) Forecast, by Application 2019 & 2032
- Table 88: Canada Manufacturing Analytics Industry Volume (K Unit) Forecast, by Application 2019 & 2032
- Table 89: Mexico Manufacturing Analytics Industry Revenue (Million) Forecast, by Application 2019 & 2032
- Table 90: Mexico Manufacturing Analytics Industry Volume (K Unit) Forecast, by Application 2019 & 2032
- Table 91: Global Manufacturing Analytics Industry Revenue Million Forecast, by Country 2019 & 2032
- Table 92: Global Manufacturing Analytics Industry Volume K Unit Forecast, by Country 2019 & 2032
- Table 93: United Arab Emirates Manufacturing Analytics Industry Revenue (Million) Forecast, by Application 2019 & 2032
- Table 94: United Arab Emirates Manufacturing Analytics Industry Volume (K Unit) Forecast, by Application 2019 & 2032
- Table 95: Saudi Arabia Manufacturing Analytics Industry Revenue (Million) Forecast, by Application 2019 & 2032
- Table 96: Saudi Arabia Manufacturing Analytics Industry Volume (K Unit) Forecast, by Application 2019 & 2032
- Table 97: South Africa Manufacturing Analytics Industry Revenue (Million) Forecast, by Application 2019 & 2032
- Table 98: South Africa Manufacturing Analytics Industry Volume (K Unit) Forecast, by Application 2019 & 2032
- Table 99: Rest of Middle East and Africa Manufacturing Analytics Industry Revenue (Million) Forecast, by Application 2019 & 2032
- Table 100: Rest of Middle East and Africa Manufacturing Analytics Industry Volume (K Unit) Forecast, by Application 2019 & 2032
- Table 101: Global Manufacturing Analytics Industry Revenue Million Forecast, by Deployment 2019 & 2032
- Table 102: Global Manufacturing Analytics Industry Volume K Unit Forecast, by Deployment 2019 & 2032
- Table 103: Global Manufacturing Analytics Industry Revenue Million Forecast, by Appllication 2019 & 2032
- Table 104: Global Manufacturing Analytics Industry Volume K Unit Forecast, by Appllication 2019 & 2032
- Table 105: Global Manufacturing Analytics Industry Revenue Million Forecast, by End-user Industry 2019 & 2032
- Table 106: Global Manufacturing Analytics Industry Volume K Unit Forecast, by End-user Industry 2019 & 2032
- Table 107: Global Manufacturing Analytics Industry Revenue Million Forecast, by Country 2019 & 2032
- Table 108: Global Manufacturing Analytics Industry Volume K Unit Forecast, by Country 2019 & 2032
- Table 109: Global Manufacturing Analytics Industry Revenue Million Forecast, by Deployment 2019 & 2032
- Table 110: Global Manufacturing Analytics Industry Volume K Unit Forecast, by Deployment 2019 & 2032
- Table 111: Global Manufacturing Analytics Industry Revenue Million Forecast, by Appllication 2019 & 2032
- Table 112: Global Manufacturing Analytics Industry Volume K Unit Forecast, by Appllication 2019 & 2032
- Table 113: Global Manufacturing Analytics Industry Revenue Million Forecast, by End-user Industry 2019 & 2032
- Table 114: Global Manufacturing Analytics Industry Volume K Unit Forecast, by End-user Industry 2019 & 2032
- Table 115: Global Manufacturing Analytics Industry Revenue Million Forecast, by Country 2019 & 2032
- Table 116: Global Manufacturing Analytics Industry Volume K Unit Forecast, by Country 2019 & 2032
- Table 117: Global Manufacturing Analytics Industry Revenue Million Forecast, by Deployment 2019 & 2032
- Table 118: Global Manufacturing Analytics Industry Volume K Unit Forecast, by Deployment 2019 & 2032
- Table 119: Global Manufacturing Analytics Industry Revenue Million Forecast, by Appllication 2019 & 2032
- Table 120: Global Manufacturing Analytics Industry Volume K Unit Forecast, by Appllication 2019 & 2032
- Table 121: Global Manufacturing Analytics Industry Revenue Million Forecast, by End-user Industry 2019 & 2032
- Table 122: Global Manufacturing Analytics Industry Volume K Unit Forecast, by End-user Industry 2019 & 2032
- Table 123: Global Manufacturing Analytics Industry Revenue Million Forecast, by Country 2019 & 2032
- Table 124: Global Manufacturing Analytics Industry Volume K Unit Forecast, by Country 2019 & 2032
- Table 125: Global Manufacturing Analytics Industry Revenue Million Forecast, by Deployment 2019 & 2032
- Table 126: Global Manufacturing Analytics Industry Volume K Unit Forecast, by Deployment 2019 & 2032
- Table 127: Global Manufacturing Analytics Industry Revenue Million Forecast, by Appllication 2019 & 2032
- Table 128: Global Manufacturing Analytics Industry Volume K Unit Forecast, by Appllication 2019 & 2032
- Table 129: Global Manufacturing Analytics Industry Revenue Million Forecast, by End-user Industry 2019 & 2032
- Table 130: Global Manufacturing Analytics Industry Volume K Unit Forecast, by End-user Industry 2019 & 2032
- Table 131: Global Manufacturing Analytics Industry Revenue Million Forecast, by Country 2019 & 2032
- Table 132: Global Manufacturing Analytics Industry Volume K Unit Forecast, by Country 2019 & 2032
- Table 133: Global Manufacturing Analytics Industry Revenue Million Forecast, by Deployment 2019 & 2032
- Table 134: Global Manufacturing Analytics Industry Volume K Unit Forecast, by Deployment 2019 & 2032
- Table 135: Global Manufacturing Analytics Industry Revenue Million Forecast, by Appllication 2019 & 2032
- Table 136: Global Manufacturing Analytics Industry Volume K Unit Forecast, by Appllication 2019 & 2032
- Table 137: Global Manufacturing Analytics Industry Revenue Million Forecast, by End-user Industry 2019 & 2032
- Table 138: Global Manufacturing Analytics Industry Volume K Unit Forecast, by End-user Industry 2019 & 2032
- Table 139: Global Manufacturing Analytics Industry Revenue Million Forecast, by Country 2019 & 2032
- Table 140: Global Manufacturing Analytics Industry Volume K Unit Forecast, by Country 2019 & 2032
Frequently Asked Questions
1. What is the projected Compound Annual Growth Rate (CAGR) of the Manufacturing Analytics Industry?
The projected CAGR is approximately 24.00%.
2. Which companies are prominent players in the Manufacturing Analytics Industry?
Key companies in the market include SAS Institute Inc, TIBCO Software Inc, IBM Corp, QlikTech Inc, DXC Technology Company, Wipro Limited, Northwest Analytics Inc, Alteryx Inc, Salesforce com Inc (Tableau Software Inc ), Oracle Corp, Sisense Inc, General Electric Company, SAP SE.
3. What are the main segments of the Manufacturing Analytics Industry?
The market segments include Deployment, Appllication, End-user Industry.
4. Can you provide details about the market size?
The market size is estimated to be USD XX Million as of 2022.
5. What are some drivers contributing to market growth?
; Adoption of BI and Advanced Data Management Strategies in Manufacturing Applications; Increasing Application of Industry 4.0 Across Various Segments of Manufacturing Industries.
6. What are the notable trends driving market growth?
Automotive Sector is Expected to Grow at a Significant Rate.
7. Are there any restraints impacting market growth?
; High Initial Investment in the Transation of IIoT Across Industrial Region.
8. Can you provide examples of recent developments in the market?
N/A
9. What pricing options are available for accessing the report?
Pricing options include single-user, multi-user, and enterprise licenses priced at USD 4750, USD 5250, and USD 8750 respectively.
10. Is the market size provided in terms of value or volume?
The market size is provided in terms of value, measured in Million and volume, measured in K Unit.
11. Are there any specific market keywords associated with the report?
Yes, the market keyword associated with the report is "Manufacturing Analytics Industry," which aids in identifying and referencing the specific market segment covered.
12. How do I determine which pricing option suits my needs best?
The pricing options vary based on user requirements and access needs. Individual users may opt for single-user licenses, while businesses requiring broader access may choose multi-user or enterprise licenses for cost-effective access to the report.
13. Are there any additional resources or data provided in the Manufacturing Analytics Industry report?
While the report offers comprehensive insights, it's advisable to review the specific contents or supplementary materials provided to ascertain if additional resources or data are available.
14. How can I stay updated on further developments or reports in the Manufacturing Analytics Industry?
To stay informed about further developments, trends, and reports in the Manufacturing Analytics Industry, consider subscribing to industry newsletters, following relevant companies and organizations, or regularly checking reputable industry news sources and publications.
Methodology
Step 1 - Identification of Relevant Samples Size from Population Database


Step 2 - Approaches for Defining Global Market Size (Value, Volume* & Price*)

Note*: In applicable scenarios
Step 3 - Data Sources
Primary Research
- Web Analytics
- Survey Reports
- Research Institute
- Latest Research Reports
- Opinion Leaders
Secondary Research
- Annual Reports
- White Paper
- Latest Press Release
- Industry Association
- Paid Database
- Investor Presentations

Step 4 - Data Triangulation
Involves using different sources of information in order to increase the validity of a study
These sources are likely to be stakeholders in a program - participants, other researchers, program staff, other community members, and so on.
Then we put all data in single framework & apply various statistical tools to find out the dynamic on the market.
During the analysis stage, feedback from the stakeholder groups would be compared to determine areas of agreement as well as areas of divergence


