
Key Insights
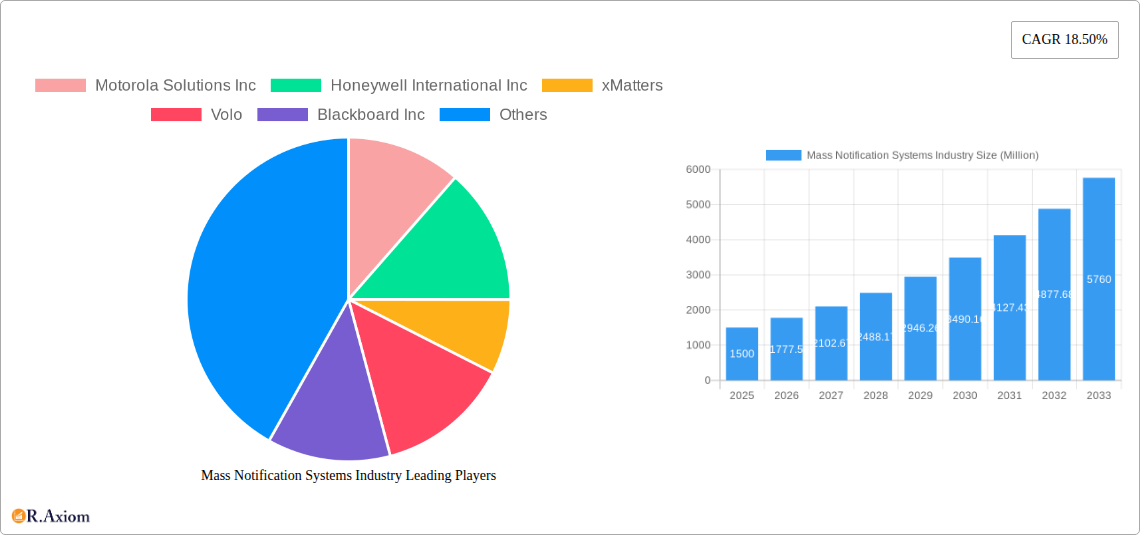
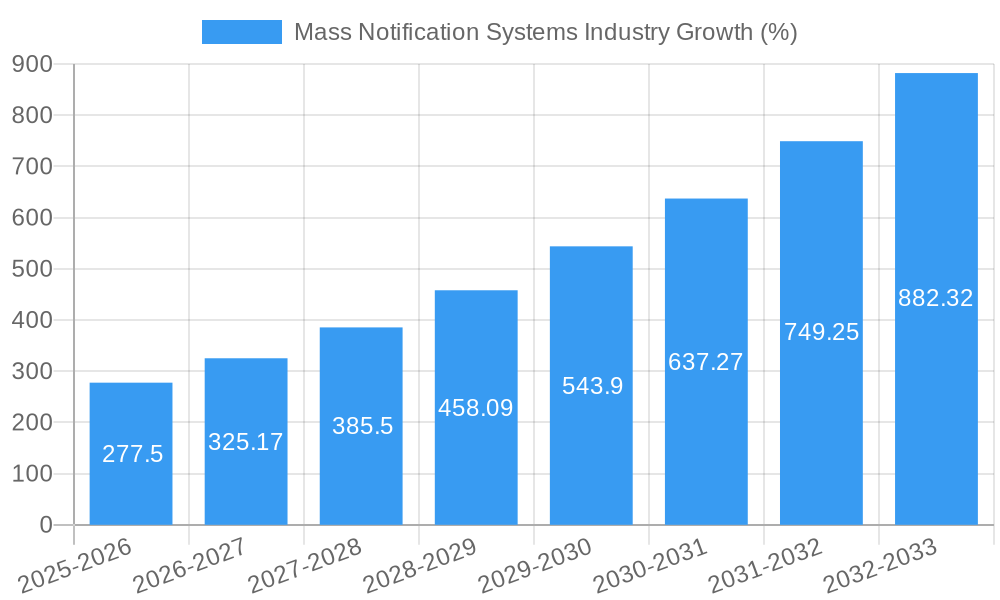
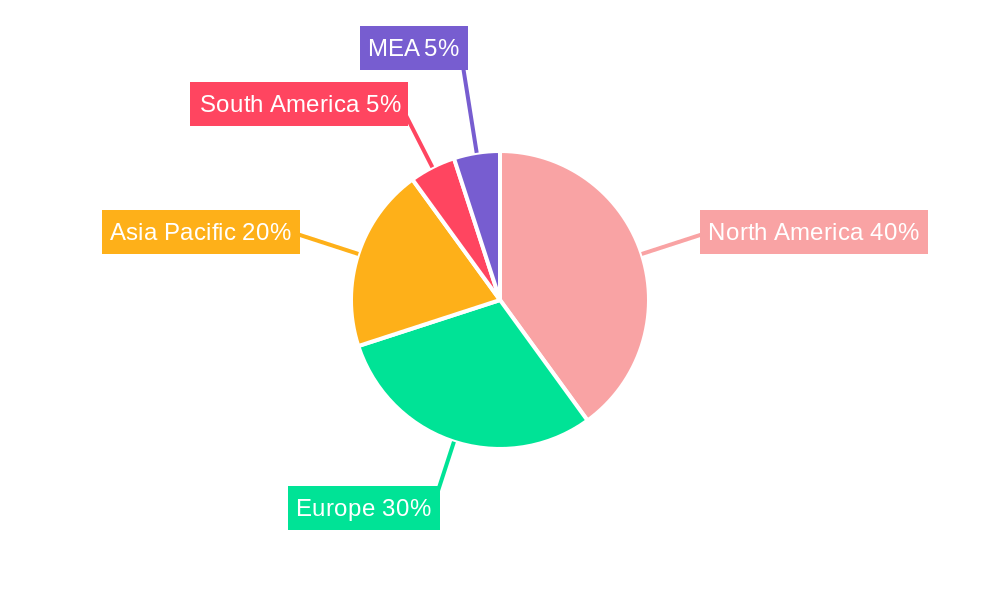
The Mass Notification Systems market is experiencing robust growth, projected to reach a significant value by 2033. A Compound Annual Growth Rate (CAGR) of 18.50% from 2025 to 2033 indicates a rapidly expanding market driven by several key factors. Increasing concerns surrounding business continuity and disaster recovery, coupled with the rising need for efficient integrated public alert and warning systems, are primary growth catalysts. The adoption of cloud-based solutions is further fueling market expansion, offering scalability, cost-effectiveness, and enhanced accessibility compared to on-premise systems. Government regulations mandating improved emergency communication, particularly in critical sectors like healthcare and energy, are also contributing significantly to market growth. Segmentation analysis reveals that the cloud deployment model and solutions-focused components currently dominate, with robust growth anticipated across all application areas including in-building, wide-area, and distributed recipient notification systems. North America and Europe currently hold the largest market shares, driven by early adoption and established technological infrastructure. However, Asia-Pacific is poised for substantial growth in the coming years, fueled by increasing digitalization and rising infrastructure investments.
Despite the significant growth opportunities, the market faces certain restraints. High initial investment costs for implementing sophisticated mass notification systems, especially for smaller organizations, can hinder adoption. Furthermore, ensuring interoperability and seamless integration with existing communication platforms presents a challenge. Data security and privacy concerns also require careful consideration, particularly given the sensitive nature of the information conveyed through these systems. Nevertheless, ongoing technological advancements, including improved analytics and AI-powered features, are expected to address some of these challenges, paving the way for further market expansion. The competitive landscape is dynamic, with established players like Motorola Solutions and Honeywell alongside emerging technology providers vying for market share. Strategic partnerships, acquisitions, and product innovation will likely play crucial roles in shaping the future of the mass notification systems market.
This detailed report provides a comprehensive analysis of the Mass Notification Systems (MNS) industry, offering actionable insights for stakeholders across the value chain. The report covers market size, segmentation, growth drivers, challenges, key players, and future trends, using data from the historical period (2019-2024), the base year (2025), and the forecast period (2025-2033). The total market size is projected to reach xx Million by 2033.
Mass Notification Systems Industry Market Concentration & Innovation
The Mass Notification Systems market exhibits a moderately concentrated landscape, with several major players holding significant market share. Motorola Solutions Inc, Honeywell International Inc, and Everbridge Inc are among the leading companies, each commanding a substantial portion of the market (exact figures vary depending on the segment). However, the presence of numerous smaller, specialized vendors fosters innovation and competition, particularly in niche segments.
Market share dynamics are influenced by several factors, including:
- Technological innovation: Continuous advancements in communication technologies, such as cloud-based platforms and AI-powered analytics, are driving innovation and reshaping market leadership.
- Strategic acquisitions & mergers (M&A): The M&A landscape has seen significant activity, with larger companies acquiring smaller players to expand their product portfolios and market reach. Deal values have ranged from xx Million to xx Million in recent years, further consolidating the market. For example, the acquisition of [Company X] by [Company Y] in [Year] significantly impacted the market share distribution in the [Segment] segment.
- Regulatory frameworks: Government regulations concerning emergency communication and data privacy influence market dynamics by creating both opportunities and constraints for vendors.
- Product substitutes: Although direct substitutes are limited, alternative communication channels (e.g., social media) can partially fulfill the functions of MNS, impacting market penetration.
- End-user trends: Growing awareness of the importance of business continuity and disaster preparedness is driving increased adoption of MNS across diverse industries.
Mass Notification Systems Industry Industry Trends & Insights
The Mass Notification Systems market is experiencing robust growth, driven by several key factors. The Compound Annual Growth Rate (CAGR) is estimated at xx% during the forecast period (2025-2033). Market penetration is increasing across various sectors, particularly in regions with well-developed infrastructure and a high awareness of emergency preparedness.
Key trends shaping the market include:
- Increasing demand for cloud-based solutions: Cloud deployment offers scalability, cost-effectiveness, and enhanced accessibility, making it a preferred choice for many organizations.
- Integration with other security systems: MNS is increasingly integrated with other security systems, such as video surveillance and access control, to create comprehensive security solutions.
- Advancements in AI and machine learning: AI-powered features, such as automated threat detection and intelligent routing, are improving the efficiency and effectiveness of MNS.
- Growing adoption of multi-channel communication: Businesses are increasingly using multiple communication channels (e.g., SMS, email, voice calls) to ensure wider reach and reliable message delivery.
- Stringent data privacy regulations: Compliance with data privacy regulations (e.g., GDPR) is becoming increasingly important for MNS vendors.
Dominant Markets & Segments in Mass Notification Systems Industry
The North American region currently dominates the Mass Notification Systems market, driven by high technological adoption, robust infrastructure, and a strong focus on business continuity and disaster preparedness. However, Asia-Pacific is expected to exhibit significant growth in the coming years due to increasing urbanization and industrialization.
Dominant Segments:
- By Component: The Solution segment currently holds the largest market share, followed by Services.
- By Deployment: Cloud deployment is rapidly gaining traction and is projected to surpass on-premise deployment in the coming years.
- By Application: Wide-area notification systems are most widely deployed, addressing large geographical areas. However, the In-Building segment shows promising growth potential.
- By Purpose of Deployment: Business Continuity and Disaster Recovery is the largest segment, followed by Integrated Public Alert and Warning.
- By End-User Vertical: The Government and Healthcare sectors are currently the leading end-users, with Commercial and Education sectors exhibiting substantial growth potential.
Key Drivers for Dominant Segments:
- Government initiatives: Government regulations and funding for emergency communication infrastructure are significant drivers, particularly in the Public Alert and Warning segment.
- Economic growth: Economic development and increased investments in infrastructure are fostering growth across various segments and regions.
- Technological advancements: Innovations in communication technologies are driving market expansion.
Mass Notification Systems Industry Product Developments
Recent product innovations highlight a trend toward greater integration, enhanced usability, and improved communication capabilities. Next-generation MNS platforms now incorporate AI-powered features, multi-channel communication, and advanced analytics for improved decision-making during critical events. This focus on comprehensive solutions that address the evolving needs of various end-users is driving market growth. Examples include the launch of Acoustic Technology, Inc.'s next-generation MNS product line and Evolv Technology's integration of mass notification with weapons screening systems.
Report Scope & Segmentation Analysis
This report segments the Mass Notification Systems market by component (Solution, Services), deployment (Cloud, On-premise), application (In-Building, Wide-Area, Distributed Recipient), purpose of deployment (Business Continuity and Disaster Recovery, Integrated Public Alert and Warning, Interoperable Emergency Communication), and end-user vertical (Energy and Utilities, Healthcare, Commercial, Government, Education, Other). Each segment’s growth projections, market sizes, and competitive dynamics are analyzed in detail within the full report.
Key Drivers of Mass Notification Systems Industry Growth
The Mass Notification Systems market is driven by several factors:
- Growing need for business continuity: Businesses are increasingly investing in MNS to minimize disruptions caused by emergencies or disasters.
- Increased government regulations: Stringent regulations mandating emergency communication systems are driving market growth.
- Technological advancements: Innovations in communication technologies are leading to more efficient and effective MNS solutions.
- Rising awareness of security threats: Growing concerns over security threats, such as cyberattacks and natural disasters, are fueling the demand for advanced MNS.
Challenges in the Mass Notification Systems Industry Sector
The MNS market faces several challenges:
- High initial investment costs: The implementation of MNS can be expensive, particularly for large organizations.
- Integration complexities: Integrating MNS with existing security systems can be challenging.
- Maintaining data security: Protecting sensitive data transmitted through MNS is crucial and requires robust security measures.
- Competition from alternative communication channels: Social media and other communication platforms pose some competitive pressure.
Emerging Opportunities in Mass Notification Systems Industry
Emerging opportunities include:
- Expansion into developing markets: Significant growth potential exists in developing countries with limited MNS infrastructure.
- Integration with IoT devices: Connecting MNS with IoT devices can enable real-time situational awareness and improve emergency response.
- Development of AI-powered features: AI can enhance the efficiency and effectiveness of MNS.
- Focus on niche applications: Specialised MNS solutions for specific industries (e.g., healthcare, education) represent a growing opportunity.
Leading Players in the Mass Notification Systems Industry Market
- Motorola Solutions Inc
- Honeywell International Inc
- xMatters
- Volo
- Blackboard Inc
- Alertus Technologies LLC
- Rave Mobile Safety
- HipLink Software
- Prepari
- Siemens AG
- BlackBerry AtHoc Inc
- RefFlag (Pocketstop LLC)
- Everbridge Inc
- Singlewire Software LLC
- Alert Media Inc
- F24 AG
- Signal Communications Corporation
- Regroup Mass Notification
- OnSolve LLC
- HipLink
- Eaton Corporation
Key Developments in Mass Notification Systems Industry Industry
- August 2022: Acoustic Technology, Inc. launched its next-generation Mass Notification System product line, incorporating several enhancements.
- February 2022: Evolv Technology enhanced Evolv Express, integrating it with Milestone Video Management System and Titan HST mass notification system.
Strategic Outlook for Mass Notification Systems Industry Market
The Mass Notification Systems market is poised for continued growth, driven by technological advancements, increasing awareness of security threats, and government regulations. The market will witness further consolidation through M&A activities and the emergence of new, innovative solutions. Companies focused on providing integrated, AI-powered, and cloud-based MNS platforms are expected to gain a competitive advantage. The focus on multi-channel communication and enhanced data security will remain paramount.
Mass Notification Systems Industry Segmentation
-
1. Component
- 1.1. Solution
- 1.2. Services
-
2. Deployment
- 2.1. Cloud
- 2.2. On-premise
-
3. Application
- 3.1. In-Building
- 3.2. Wide-Area
- 3.3. Distributed Recipient
-
4. Purpose of Deployment
- 4.1. Business Continuity and Disaster Recovery
- 4.2. Integrated Public Alert and Warning
- 4.3. Interoperable Emergency Communication
-
5. End-User Vertical
- 5.1. Energy and Utilities
- 5.2. Healthcare
- 5.3. Commercial
- 5.4. Government
- 5.5. Education
- 5.6. Other End User Verticals
Mass Notification Systems Industry Segmentation By Geography
- 1. North America
- 2. Europe
- 3. Asia Pacific
- 4. Latin America
- 5. Middle East and Africa
Mass Notification Systems Industry REPORT HIGHLIGHTS
| Aspects | Details |
|---|---|
| Study Period | 2019-2033 |
| Base Year | 2024 |
| Estimated Year | 2025 |
| Forecast Period | 2025-2033 |
| Historical Period | 2019-2024 |
| Growth Rate | CAGR of 18.50% from 2019-2033 |
| Segmentation |
|
Table of Contents
- 1. Introduction
- 1.1. Research Scope
- 1.2. Market Segmentation
- 1.3. Research Methodology
- 1.4. Definitions and Assumptions
- 2. Executive Summary
- 2.1. Introduction
- 3. Market Dynamics
- 3.1. Introduction
- 3.2. Market Drivers
- 3.2.1. Growing Adoption of Internet Protocol Based Notification Devices; Increasing Concerns About Public Safety; Increasing Adoption of MNS in Healthcare Sector
- 3.3. Market Restrains
- 3.3.1. Intense Competition in the Market
- 3.4. Market Trends
- 3.4.1. Increasing Adoption of MNS in Healthcare Sector
- 4. Market Factor Analysis
- 4.1. Porters Five Forces
- 4.2. Supply/Value Chain
- 4.3. PESTEL analysis
- 4.4. Market Entropy
- 4.5. Patent/Trademark Analysis
- 5. Global Mass Notification Systems Industry Analysis, Insights and Forecast, 2019-2031
- 5.1. Market Analysis, Insights and Forecast - by Component
- 5.1.1. Solution
- 5.1.2. Services
- 5.2. Market Analysis, Insights and Forecast - by Deployment
- 5.2.1. Cloud
- 5.2.2. On-premise
- 5.3. Market Analysis, Insights and Forecast - by Application
- 5.3.1. In-Building
- 5.3.2. Wide-Area
- 5.3.3. Distributed Recipient
- 5.4. Market Analysis, Insights and Forecast - by Purpose of Deployment
- 5.4.1. Business Continuity and Disaster Recovery
- 5.4.2. Integrated Public Alert and Warning
- 5.4.3. Interoperable Emergency Communication
- 5.5. Market Analysis, Insights and Forecast - by End-User Vertical
- 5.5.1. Energy and Utilities
- 5.5.2. Healthcare
- 5.5.3. Commercial
- 5.5.4. Government
- 5.5.5. Education
- 5.5.6. Other End User Verticals
- 5.6. Market Analysis, Insights and Forecast - by Region
- 5.6.1. North America
- 5.6.2. Europe
- 5.6.3. Asia Pacific
- 5.6.4. Latin America
- 5.6.5. Middle East and Africa
- 5.1. Market Analysis, Insights and Forecast - by Component
- 6. North America Mass Notification Systems Industry Analysis, Insights and Forecast, 2019-2031
- 6.1. Market Analysis, Insights and Forecast - by Component
- 6.1.1. Solution
- 6.1.2. Services
- 6.2. Market Analysis, Insights and Forecast - by Deployment
- 6.2.1. Cloud
- 6.2.2. On-premise
- 6.3. Market Analysis, Insights and Forecast - by Application
- 6.3.1. In-Building
- 6.3.2. Wide-Area
- 6.3.3. Distributed Recipient
- 6.4. Market Analysis, Insights and Forecast - by Purpose of Deployment
- 6.4.1. Business Continuity and Disaster Recovery
- 6.4.2. Integrated Public Alert and Warning
- 6.4.3. Interoperable Emergency Communication
- 6.5. Market Analysis, Insights and Forecast - by End-User Vertical
- 6.5.1. Energy and Utilities
- 6.5.2. Healthcare
- 6.5.3. Commercial
- 6.5.4. Government
- 6.5.5. Education
- 6.5.6. Other End User Verticals
- 6.1. Market Analysis, Insights and Forecast - by Component
- 7. Europe Mass Notification Systems Industry Analysis, Insights and Forecast, 2019-2031
- 7.1. Market Analysis, Insights and Forecast - by Component
- 7.1.1. Solution
- 7.1.2. Services
- 7.2. Market Analysis, Insights and Forecast - by Deployment
- 7.2.1. Cloud
- 7.2.2. On-premise
- 7.3. Market Analysis, Insights and Forecast - by Application
- 7.3.1. In-Building
- 7.3.2. Wide-Area
- 7.3.3. Distributed Recipient
- 7.4. Market Analysis, Insights and Forecast - by Purpose of Deployment
- 7.4.1. Business Continuity and Disaster Recovery
- 7.4.2. Integrated Public Alert and Warning
- 7.4.3. Interoperable Emergency Communication
- 7.5. Market Analysis, Insights and Forecast - by End-User Vertical
- 7.5.1. Energy and Utilities
- 7.5.2. Healthcare
- 7.5.3. Commercial
- 7.5.4. Government
- 7.5.5. Education
- 7.5.6. Other End User Verticals
- 7.1. Market Analysis, Insights and Forecast - by Component
- 8. Asia Pacific Mass Notification Systems Industry Analysis, Insights and Forecast, 2019-2031
- 8.1. Market Analysis, Insights and Forecast - by Component
- 8.1.1. Solution
- 8.1.2. Services
- 8.2. Market Analysis, Insights and Forecast - by Deployment
- 8.2.1. Cloud
- 8.2.2. On-premise
- 8.3. Market Analysis, Insights and Forecast - by Application
- 8.3.1. In-Building
- 8.3.2. Wide-Area
- 8.3.3. Distributed Recipient
- 8.4. Market Analysis, Insights and Forecast - by Purpose of Deployment
- 8.4.1. Business Continuity and Disaster Recovery
- 8.4.2. Integrated Public Alert and Warning
- 8.4.3. Interoperable Emergency Communication
- 8.5. Market Analysis, Insights and Forecast - by End-User Vertical
- 8.5.1. Energy and Utilities
- 8.5.2. Healthcare
- 8.5.3. Commercial
- 8.5.4. Government
- 8.5.5. Education
- 8.5.6. Other End User Verticals
- 8.1. Market Analysis, Insights and Forecast - by Component
- 9. Latin America Mass Notification Systems Industry Analysis, Insights and Forecast, 2019-2031
- 9.1. Market Analysis, Insights and Forecast - by Component
- 9.1.1. Solution
- 9.1.2. Services
- 9.2. Market Analysis, Insights and Forecast - by Deployment
- 9.2.1. Cloud
- 9.2.2. On-premise
- 9.3. Market Analysis, Insights and Forecast - by Application
- 9.3.1. In-Building
- 9.3.2. Wide-Area
- 9.3.3. Distributed Recipient
- 9.4. Market Analysis, Insights and Forecast - by Purpose of Deployment
- 9.4.1. Business Continuity and Disaster Recovery
- 9.4.2. Integrated Public Alert and Warning
- 9.4.3. Interoperable Emergency Communication
- 9.5. Market Analysis, Insights and Forecast - by End-User Vertical
- 9.5.1. Energy and Utilities
- 9.5.2. Healthcare
- 9.5.3. Commercial
- 9.5.4. Government
- 9.5.5. Education
- 9.5.6. Other End User Verticals
- 9.1. Market Analysis, Insights and Forecast - by Component
- 10. Middle East and Africa Mass Notification Systems Industry Analysis, Insights and Forecast, 2019-2031
- 10.1. Market Analysis, Insights and Forecast - by Component
- 10.1.1. Solution
- 10.1.2. Services
- 10.2. Market Analysis, Insights and Forecast - by Deployment
- 10.2.1. Cloud
- 10.2.2. On-premise
- 10.3. Market Analysis, Insights and Forecast - by Application
- 10.3.1. In-Building
- 10.3.2. Wide-Area
- 10.3.3. Distributed Recipient
- 10.4. Market Analysis, Insights and Forecast - by Purpose of Deployment
- 10.4.1. Business Continuity and Disaster Recovery
- 10.4.2. Integrated Public Alert and Warning
- 10.4.3. Interoperable Emergency Communication
- 10.5. Market Analysis, Insights and Forecast - by End-User Vertical
- 10.5.1. Energy and Utilities
- 10.5.2. Healthcare
- 10.5.3. Commercial
- 10.5.4. Government
- 10.5.5. Education
- 10.5.6. Other End User Verticals
- 10.1. Market Analysis, Insights and Forecast - by Component
- 11. North America Mass Notification Systems Industry Analysis, Insights and Forecast, 2019-2031
- 11.1. Market Analysis, Insights and Forecast - By Country/Sub-region
- 11.1.1 United States
- 11.1.2 Canada
- 11.1.3 Mexico
- 12. Europe Mass Notification Systems Industry Analysis, Insights and Forecast, 2019-2031
- 12.1. Market Analysis, Insights and Forecast - By Country/Sub-region
- 12.1.1 Germany
- 12.1.2 United Kingdom
- 12.1.3 France
- 12.1.4 Spain
- 12.1.5 Italy
- 12.1.6 Spain
- 12.1.7 Belgium
- 12.1.8 Netherland
- 12.1.9 Nordics
- 12.1.10 Rest of Europe
- 13. Asia Pacific Mass Notification Systems Industry Analysis, Insights and Forecast, 2019-2031
- 13.1. Market Analysis, Insights and Forecast - By Country/Sub-region
- 13.1.1 China
- 13.1.2 Japan
- 13.1.3 India
- 13.1.4 South Korea
- 13.1.5 Southeast Asia
- 13.1.6 Australia
- 13.1.7 Indonesia
- 13.1.8 Phillipes
- 13.1.9 Singapore
- 13.1.10 Thailandc
- 13.1.11 Rest of Asia Pacific
- 14. South America Mass Notification Systems Industry Analysis, Insights and Forecast, 2019-2031
- 14.1. Market Analysis, Insights and Forecast - By Country/Sub-region
- 14.1.1 Brazil
- 14.1.2 Argentina
- 14.1.3 Peru
- 14.1.4 Chile
- 14.1.5 Colombia
- 14.1.6 Ecuador
- 14.1.7 Venezuela
- 14.1.8 Rest of South America
- 15. North America Mass Notification Systems Industry Analysis, Insights and Forecast, 2019-2031
- 15.1. Market Analysis, Insights and Forecast - By Country/Sub-region
- 15.1.1 United States
- 15.1.2 Canada
- 15.1.3 Mexico
- 16. MEA Mass Notification Systems Industry Analysis, Insights and Forecast, 2019-2031
- 16.1. Market Analysis, Insights and Forecast - By Country/Sub-region
- 16.1.1 United Arab Emirates
- 16.1.2 Saudi Arabia
- 16.1.3 South Africa
- 16.1.4 Rest of Middle East and Africa
- 17. Competitive Analysis
- 17.1. Global Market Share Analysis 2024
- 17.2. Company Profiles
- 17.2.1 Motorola Solutions Inc
- 17.2.1.1. Overview
- 17.2.1.2. Products
- 17.2.1.3. SWOT Analysis
- 17.2.1.4. Recent Developments
- 17.2.1.5. Financials (Based on Availability)
- 17.2.2 Honeywell International Inc
- 17.2.2.1. Overview
- 17.2.2.2. Products
- 17.2.2.3. SWOT Analysis
- 17.2.2.4. Recent Developments
- 17.2.2.5. Financials (Based on Availability)
- 17.2.3 xMatters
- 17.2.3.1. Overview
- 17.2.3.2. Products
- 17.2.3.3. SWOT Analysis
- 17.2.3.4. Recent Developments
- 17.2.3.5. Financials (Based on Availability)
- 17.2.4 Volo
- 17.2.4.1. Overview
- 17.2.4.2. Products
- 17.2.4.3. SWOT Analysis
- 17.2.4.4. Recent Developments
- 17.2.4.5. Financials (Based on Availability)
- 17.2.5 Blackboard Inc
- 17.2.5.1. Overview
- 17.2.5.2. Products
- 17.2.5.3. SWOT Analysis
- 17.2.5.4. Recent Developments
- 17.2.5.5. Financials (Based on Availability)
- 17.2.6 Alertus Technologies LLC
- 17.2.6.1. Overview
- 17.2.6.2. Products
- 17.2.6.3. SWOT Analysis
- 17.2.6.4. Recent Developments
- 17.2.6.5. Financials (Based on Availability)
- 17.2.7 Rave Mobile Safety
- 17.2.7.1. Overview
- 17.2.7.2. Products
- 17.2.7.3. SWOT Analysis
- 17.2.7.4. Recent Developments
- 17.2.7.5. Financials (Based on Availability)
- 17.2.8 HipLink Software
- 17.2.8.1. Overview
- 17.2.8.2. Products
- 17.2.8.3. SWOT Analysis
- 17.2.8.4. Recent Developments
- 17.2.8.5. Financials (Based on Availability)
- 17.2.9 Prepari
- 17.2.9.1. Overview
- 17.2.9.2. Products
- 17.2.9.3. SWOT Analysis
- 17.2.9.4. Recent Developments
- 17.2.9.5. Financials (Based on Availability)
- 17.2.10 Siemens AG
- 17.2.10.1. Overview
- 17.2.10.2. Products
- 17.2.10.3. SWOT Analysis
- 17.2.10.4. Recent Developments
- 17.2.10.5. Financials (Based on Availability)
- 17.2.11 BlackBerry AtHoc Inc
- 17.2.11.1. Overview
- 17.2.11.2. Products
- 17.2.11.3. SWOT Analysis
- 17.2.11.4. Recent Developments
- 17.2.11.5. Financials (Based on Availability)
- 17.2.12 RefFlag(Pocketstop LLC )
- 17.2.12.1. Overview
- 17.2.12.2. Products
- 17.2.12.3. SWOT Analysis
- 17.2.12.4. Recent Developments
- 17.2.12.5. Financials (Based on Availability)
- 17.2.13 Everbridge Inc
- 17.2.13.1. Overview
- 17.2.13.2. Products
- 17.2.13.3. SWOT Analysis
- 17.2.13.4. Recent Developments
- 17.2.13.5. Financials (Based on Availability)
- 17.2.14 Singlewire Software LLC
- 17.2.14.1. Overview
- 17.2.14.2. Products
- 17.2.14.3. SWOT Analysis
- 17.2.14.4. Recent Developments
- 17.2.14.5. Financials (Based on Availability)
- 17.2.15 Alert Media Inc
- 17.2.15.1. Overview
- 17.2.15.2. Products
- 17.2.15.3. SWOT Analysis
- 17.2.15.4. Recent Developments
- 17.2.15.5. Financials (Based on Availability)
- 17.2.16 F24 AG
- 17.2.16.1. Overview
- 17.2.16.2. Products
- 17.2.16.3. SWOT Analysis
- 17.2.16.4. Recent Developments
- 17.2.16.5. Financials (Based on Availability)
- 17.2.17 Signal Communications Corporation
- 17.2.17.1. Overview
- 17.2.17.2. Products
- 17.2.17.3. SWOT Analysis
- 17.2.17.4. Recent Developments
- 17.2.17.5. Financials (Based on Availability)
- 17.2.18 Regroup Mass Notification
- 17.2.18.1. Overview
- 17.2.18.2. Products
- 17.2.18.3. SWOT Analysis
- 17.2.18.4. Recent Developments
- 17.2.18.5. Financials (Based on Availability)
- 17.2.19 OnSolve LLC
- 17.2.19.1. Overview
- 17.2.19.2. Products
- 17.2.19.3. SWOT Analysis
- 17.2.19.4. Recent Developments
- 17.2.19.5. Financials (Based on Availability)
- 17.2.20 HipLink
- 17.2.20.1. Overview
- 17.2.20.2. Products
- 17.2.20.3. SWOT Analysis
- 17.2.20.4. Recent Developments
- 17.2.20.5. Financials (Based on Availability)
- 17.2.21 Eaton Corporation
- 17.2.21.1. Overview
- 17.2.21.2. Products
- 17.2.21.3. SWOT Analysis
- 17.2.21.4. Recent Developments
- 17.2.21.5. Financials (Based on Availability)
- 17.2.1 Motorola Solutions Inc
List of Figures
- Figure 1: Global Mass Notification Systems Industry Revenue Breakdown (Million, %) by Region 2024 & 2032
- Figure 2: North America Mass Notification Systems Industry Revenue (Million), by Country 2024 & 2032
- Figure 3: North America Mass Notification Systems Industry Revenue Share (%), by Country 2024 & 2032
- Figure 4: Europe Mass Notification Systems Industry Revenue (Million), by Country 2024 & 2032
- Figure 5: Europe Mass Notification Systems Industry Revenue Share (%), by Country 2024 & 2032
- Figure 6: Asia Pacific Mass Notification Systems Industry Revenue (Million), by Country 2024 & 2032
- Figure 7: Asia Pacific Mass Notification Systems Industry Revenue Share (%), by Country 2024 & 2032
- Figure 8: South America Mass Notification Systems Industry Revenue (Million), by Country 2024 & 2032
- Figure 9: South America Mass Notification Systems Industry Revenue Share (%), by Country 2024 & 2032
- Figure 10: North America Mass Notification Systems Industry Revenue (Million), by Country 2024 & 2032
- Figure 11: North America Mass Notification Systems Industry Revenue Share (%), by Country 2024 & 2032
- Figure 12: MEA Mass Notification Systems Industry Revenue (Million), by Country 2024 & 2032
- Figure 13: MEA Mass Notification Systems Industry Revenue Share (%), by Country 2024 & 2032
- Figure 14: North America Mass Notification Systems Industry Revenue (Million), by Component 2024 & 2032
- Figure 15: North America Mass Notification Systems Industry Revenue Share (%), by Component 2024 & 2032
- Figure 16: North America Mass Notification Systems Industry Revenue (Million), by Deployment 2024 & 2032
- Figure 17: North America Mass Notification Systems Industry Revenue Share (%), by Deployment 2024 & 2032
- Figure 18: North America Mass Notification Systems Industry Revenue (Million), by Application 2024 & 2032
- Figure 19: North America Mass Notification Systems Industry Revenue Share (%), by Application 2024 & 2032
- Figure 20: North America Mass Notification Systems Industry Revenue (Million), by Purpose of Deployment 2024 & 2032
- Figure 21: North America Mass Notification Systems Industry Revenue Share (%), by Purpose of Deployment 2024 & 2032
- Figure 22: North America Mass Notification Systems Industry Revenue (Million), by End-User Vertical 2024 & 2032
- Figure 23: North America Mass Notification Systems Industry Revenue Share (%), by End-User Vertical 2024 & 2032
- Figure 24: North America Mass Notification Systems Industry Revenue (Million), by Country 2024 & 2032
- Figure 25: North America Mass Notification Systems Industry Revenue Share (%), by Country 2024 & 2032
- Figure 26: Europe Mass Notification Systems Industry Revenue (Million), by Component 2024 & 2032
- Figure 27: Europe Mass Notification Systems Industry Revenue Share (%), by Component 2024 & 2032
- Figure 28: Europe Mass Notification Systems Industry Revenue (Million), by Deployment 2024 & 2032
- Figure 29: Europe Mass Notification Systems Industry Revenue Share (%), by Deployment 2024 & 2032
- Figure 30: Europe Mass Notification Systems Industry Revenue (Million), by Application 2024 & 2032
- Figure 31: Europe Mass Notification Systems Industry Revenue Share (%), by Application 2024 & 2032
- Figure 32: Europe Mass Notification Systems Industry Revenue (Million), by Purpose of Deployment 2024 & 2032
- Figure 33: Europe Mass Notification Systems Industry Revenue Share (%), by Purpose of Deployment 2024 & 2032
- Figure 34: Europe Mass Notification Systems Industry Revenue (Million), by End-User Vertical 2024 & 2032
- Figure 35: Europe Mass Notification Systems Industry Revenue Share (%), by End-User Vertical 2024 & 2032
- Figure 36: Europe Mass Notification Systems Industry Revenue (Million), by Country 2024 & 2032
- Figure 37: Europe Mass Notification Systems Industry Revenue Share (%), by Country 2024 & 2032
- Figure 38: Asia Pacific Mass Notification Systems Industry Revenue (Million), by Component 2024 & 2032
- Figure 39: Asia Pacific Mass Notification Systems Industry Revenue Share (%), by Component 2024 & 2032
- Figure 40: Asia Pacific Mass Notification Systems Industry Revenue (Million), by Deployment 2024 & 2032
- Figure 41: Asia Pacific Mass Notification Systems Industry Revenue Share (%), by Deployment 2024 & 2032
- Figure 42: Asia Pacific Mass Notification Systems Industry Revenue (Million), by Application 2024 & 2032
- Figure 43: Asia Pacific Mass Notification Systems Industry Revenue Share (%), by Application 2024 & 2032
- Figure 44: Asia Pacific Mass Notification Systems Industry Revenue (Million), by Purpose of Deployment 2024 & 2032
- Figure 45: Asia Pacific Mass Notification Systems Industry Revenue Share (%), by Purpose of Deployment 2024 & 2032
- Figure 46: Asia Pacific Mass Notification Systems Industry Revenue (Million), by End-User Vertical 2024 & 2032
- Figure 47: Asia Pacific Mass Notification Systems Industry Revenue Share (%), by End-User Vertical 2024 & 2032
- Figure 48: Asia Pacific Mass Notification Systems Industry Revenue (Million), by Country 2024 & 2032
- Figure 49: Asia Pacific Mass Notification Systems Industry Revenue Share (%), by Country 2024 & 2032
- Figure 50: Latin America Mass Notification Systems Industry Revenue (Million), by Component 2024 & 2032
- Figure 51: Latin America Mass Notification Systems Industry Revenue Share (%), by Component 2024 & 2032
- Figure 52: Latin America Mass Notification Systems Industry Revenue (Million), by Deployment 2024 & 2032
- Figure 53: Latin America Mass Notification Systems Industry Revenue Share (%), by Deployment 2024 & 2032
- Figure 54: Latin America Mass Notification Systems Industry Revenue (Million), by Application 2024 & 2032
- Figure 55: Latin America Mass Notification Systems Industry Revenue Share (%), by Application 2024 & 2032
- Figure 56: Latin America Mass Notification Systems Industry Revenue (Million), by Purpose of Deployment 2024 & 2032
- Figure 57: Latin America Mass Notification Systems Industry Revenue Share (%), by Purpose of Deployment 2024 & 2032
- Figure 58: Latin America Mass Notification Systems Industry Revenue (Million), by End-User Vertical 2024 & 2032
- Figure 59: Latin America Mass Notification Systems Industry Revenue Share (%), by End-User Vertical 2024 & 2032
- Figure 60: Latin America Mass Notification Systems Industry Revenue (Million), by Country 2024 & 2032
- Figure 61: Latin America Mass Notification Systems Industry Revenue Share (%), by Country 2024 & 2032
- Figure 62: Middle East and Africa Mass Notification Systems Industry Revenue (Million), by Component 2024 & 2032
- Figure 63: Middle East and Africa Mass Notification Systems Industry Revenue Share (%), by Component 2024 & 2032
- Figure 64: Middle East and Africa Mass Notification Systems Industry Revenue (Million), by Deployment 2024 & 2032
- Figure 65: Middle East and Africa Mass Notification Systems Industry Revenue Share (%), by Deployment 2024 & 2032
- Figure 66: Middle East and Africa Mass Notification Systems Industry Revenue (Million), by Application 2024 & 2032
- Figure 67: Middle East and Africa Mass Notification Systems Industry Revenue Share (%), by Application 2024 & 2032
- Figure 68: Middle East and Africa Mass Notification Systems Industry Revenue (Million), by Purpose of Deployment 2024 & 2032
- Figure 69: Middle East and Africa Mass Notification Systems Industry Revenue Share (%), by Purpose of Deployment 2024 & 2032
- Figure 70: Middle East and Africa Mass Notification Systems Industry Revenue (Million), by End-User Vertical 2024 & 2032
- Figure 71: Middle East and Africa Mass Notification Systems Industry Revenue Share (%), by End-User Vertical 2024 & 2032
- Figure 72: Middle East and Africa Mass Notification Systems Industry Revenue (Million), by Country 2024 & 2032
- Figure 73: Middle East and Africa Mass Notification Systems Industry Revenue Share (%), by Country 2024 & 2032
List of Tables
- Table 1: Global Mass Notification Systems Industry Revenue Million Forecast, by Region 2019 & 2032
- Table 2: Global Mass Notification Systems Industry Revenue Million Forecast, by Component 2019 & 2032
- Table 3: Global Mass Notification Systems Industry Revenue Million Forecast, by Deployment 2019 & 2032
- Table 4: Global Mass Notification Systems Industry Revenue Million Forecast, by Application 2019 & 2032
- Table 5: Global Mass Notification Systems Industry Revenue Million Forecast, by Purpose of Deployment 2019 & 2032
- Table 6: Global Mass Notification Systems Industry Revenue Million Forecast, by End-User Vertical 2019 & 2032
- Table 7: Global Mass Notification Systems Industry Revenue Million Forecast, by Region 2019 & 2032
- Table 8: Global Mass Notification Systems Industry Revenue Million Forecast, by Country 2019 & 2032
- Table 9: United States Mass Notification Systems Industry Revenue (Million) Forecast, by Application 2019 & 2032
- Table 10: Canada Mass Notification Systems Industry Revenue (Million) Forecast, by Application 2019 & 2032
- Table 11: Mexico Mass Notification Systems Industry Revenue (Million) Forecast, by Application 2019 & 2032
- Table 12: Global Mass Notification Systems Industry Revenue Million Forecast, by Country 2019 & 2032
- Table 13: Germany Mass Notification Systems Industry Revenue (Million) Forecast, by Application 2019 & 2032
- Table 14: United Kingdom Mass Notification Systems Industry Revenue (Million) Forecast, by Application 2019 & 2032
- Table 15: France Mass Notification Systems Industry Revenue (Million) Forecast, by Application 2019 & 2032
- Table 16: Spain Mass Notification Systems Industry Revenue (Million) Forecast, by Application 2019 & 2032
- Table 17: Italy Mass Notification Systems Industry Revenue (Million) Forecast, by Application 2019 & 2032
- Table 18: Spain Mass Notification Systems Industry Revenue (Million) Forecast, by Application 2019 & 2032
- Table 19: Belgium Mass Notification Systems Industry Revenue (Million) Forecast, by Application 2019 & 2032
- Table 20: Netherland Mass Notification Systems Industry Revenue (Million) Forecast, by Application 2019 & 2032
- Table 21: Nordics Mass Notification Systems Industry Revenue (Million) Forecast, by Application 2019 & 2032
- Table 22: Rest of Europe Mass Notification Systems Industry Revenue (Million) Forecast, by Application 2019 & 2032
- Table 23: Global Mass Notification Systems Industry Revenue Million Forecast, by Country 2019 & 2032
- Table 24: China Mass Notification Systems Industry Revenue (Million) Forecast, by Application 2019 & 2032
- Table 25: Japan Mass Notification Systems Industry Revenue (Million) Forecast, by Application 2019 & 2032
- Table 26: India Mass Notification Systems Industry Revenue (Million) Forecast, by Application 2019 & 2032
- Table 27: South Korea Mass Notification Systems Industry Revenue (Million) Forecast, by Application 2019 & 2032
- Table 28: Southeast Asia Mass Notification Systems Industry Revenue (Million) Forecast, by Application 2019 & 2032
- Table 29: Australia Mass Notification Systems Industry Revenue (Million) Forecast, by Application 2019 & 2032
- Table 30: Indonesia Mass Notification Systems Industry Revenue (Million) Forecast, by Application 2019 & 2032
- Table 31: Phillipes Mass Notification Systems Industry Revenue (Million) Forecast, by Application 2019 & 2032
- Table 32: Singapore Mass Notification Systems Industry Revenue (Million) Forecast, by Application 2019 & 2032
- Table 33: Thailandc Mass Notification Systems Industry Revenue (Million) Forecast, by Application 2019 & 2032
- Table 34: Rest of Asia Pacific Mass Notification Systems Industry Revenue (Million) Forecast, by Application 2019 & 2032
- Table 35: Global Mass Notification Systems Industry Revenue Million Forecast, by Country 2019 & 2032
- Table 36: Brazil Mass Notification Systems Industry Revenue (Million) Forecast, by Application 2019 & 2032
- Table 37: Argentina Mass Notification Systems Industry Revenue (Million) Forecast, by Application 2019 & 2032
- Table 38: Peru Mass Notification Systems Industry Revenue (Million) Forecast, by Application 2019 & 2032
- Table 39: Chile Mass Notification Systems Industry Revenue (Million) Forecast, by Application 2019 & 2032
- Table 40: Colombia Mass Notification Systems Industry Revenue (Million) Forecast, by Application 2019 & 2032
- Table 41: Ecuador Mass Notification Systems Industry Revenue (Million) Forecast, by Application 2019 & 2032
- Table 42: Venezuela Mass Notification Systems Industry Revenue (Million) Forecast, by Application 2019 & 2032
- Table 43: Rest of South America Mass Notification Systems Industry Revenue (Million) Forecast, by Application 2019 & 2032
- Table 44: Global Mass Notification Systems Industry Revenue Million Forecast, by Country 2019 & 2032
- Table 45: United States Mass Notification Systems Industry Revenue (Million) Forecast, by Application 2019 & 2032
- Table 46: Canada Mass Notification Systems Industry Revenue (Million) Forecast, by Application 2019 & 2032
- Table 47: Mexico Mass Notification Systems Industry Revenue (Million) Forecast, by Application 2019 & 2032
- Table 48: Global Mass Notification Systems Industry Revenue Million Forecast, by Country 2019 & 2032
- Table 49: United Arab Emirates Mass Notification Systems Industry Revenue (Million) Forecast, by Application 2019 & 2032
- Table 50: Saudi Arabia Mass Notification Systems Industry Revenue (Million) Forecast, by Application 2019 & 2032
- Table 51: South Africa Mass Notification Systems Industry Revenue (Million) Forecast, by Application 2019 & 2032
- Table 52: Rest of Middle East and Africa Mass Notification Systems Industry Revenue (Million) Forecast, by Application 2019 & 2032
- Table 53: Global Mass Notification Systems Industry Revenue Million Forecast, by Component 2019 & 2032
- Table 54: Global Mass Notification Systems Industry Revenue Million Forecast, by Deployment 2019 & 2032
- Table 55: Global Mass Notification Systems Industry Revenue Million Forecast, by Application 2019 & 2032
- Table 56: Global Mass Notification Systems Industry Revenue Million Forecast, by Purpose of Deployment 2019 & 2032
- Table 57: Global Mass Notification Systems Industry Revenue Million Forecast, by End-User Vertical 2019 & 2032
- Table 58: Global Mass Notification Systems Industry Revenue Million Forecast, by Country 2019 & 2032
- Table 59: Global Mass Notification Systems Industry Revenue Million Forecast, by Component 2019 & 2032
- Table 60: Global Mass Notification Systems Industry Revenue Million Forecast, by Deployment 2019 & 2032
- Table 61: Global Mass Notification Systems Industry Revenue Million Forecast, by Application 2019 & 2032
- Table 62: Global Mass Notification Systems Industry Revenue Million Forecast, by Purpose of Deployment 2019 & 2032
- Table 63: Global Mass Notification Systems Industry Revenue Million Forecast, by End-User Vertical 2019 & 2032
- Table 64: Global Mass Notification Systems Industry Revenue Million Forecast, by Country 2019 & 2032
- Table 65: Global Mass Notification Systems Industry Revenue Million Forecast, by Component 2019 & 2032
- Table 66: Global Mass Notification Systems Industry Revenue Million Forecast, by Deployment 2019 & 2032
- Table 67: Global Mass Notification Systems Industry Revenue Million Forecast, by Application 2019 & 2032
- Table 68: Global Mass Notification Systems Industry Revenue Million Forecast, by Purpose of Deployment 2019 & 2032
- Table 69: Global Mass Notification Systems Industry Revenue Million Forecast, by End-User Vertical 2019 & 2032
- Table 70: Global Mass Notification Systems Industry Revenue Million Forecast, by Country 2019 & 2032
- Table 71: Global Mass Notification Systems Industry Revenue Million Forecast, by Component 2019 & 2032
- Table 72: Global Mass Notification Systems Industry Revenue Million Forecast, by Deployment 2019 & 2032
- Table 73: Global Mass Notification Systems Industry Revenue Million Forecast, by Application 2019 & 2032
- Table 74: Global Mass Notification Systems Industry Revenue Million Forecast, by Purpose of Deployment 2019 & 2032
- Table 75: Global Mass Notification Systems Industry Revenue Million Forecast, by End-User Vertical 2019 & 2032
- Table 76: Global Mass Notification Systems Industry Revenue Million Forecast, by Country 2019 & 2032
- Table 77: Global Mass Notification Systems Industry Revenue Million Forecast, by Component 2019 & 2032
- Table 78: Global Mass Notification Systems Industry Revenue Million Forecast, by Deployment 2019 & 2032
- Table 79: Global Mass Notification Systems Industry Revenue Million Forecast, by Application 2019 & 2032
- Table 80: Global Mass Notification Systems Industry Revenue Million Forecast, by Purpose of Deployment 2019 & 2032
- Table 81: Global Mass Notification Systems Industry Revenue Million Forecast, by End-User Vertical 2019 & 2032
- Table 82: Global Mass Notification Systems Industry Revenue Million Forecast, by Country 2019 & 2032
Frequently Asked Questions
1. What is the projected Compound Annual Growth Rate (CAGR) of the Mass Notification Systems Industry?
The projected CAGR is approximately 18.50%.
2. Which companies are prominent players in the Mass Notification Systems Industry?
Key companies in the market include Motorola Solutions Inc, Honeywell International Inc, xMatters, Volo, Blackboard Inc, Alertus Technologies LLC, Rave Mobile Safety, HipLink Software, Prepari, Siemens AG, BlackBerry AtHoc Inc, RefFlag(Pocketstop LLC ), Everbridge Inc, Singlewire Software LLC, Alert Media Inc, F24 AG, Signal Communications Corporation, Regroup Mass Notification, OnSolve LLC, HipLink, Eaton Corporation.
3. What are the main segments of the Mass Notification Systems Industry?
The market segments include Component, Deployment, Application, Purpose of Deployment, End-User Vertical.
4. Can you provide details about the market size?
The market size is estimated to be USD XX Million as of 2022.
5. What are some drivers contributing to market growth?
Growing Adoption of Internet Protocol Based Notification Devices; Increasing Concerns About Public Safety; Increasing Adoption of MNS in Healthcare Sector.
6. What are the notable trends driving market growth?
Increasing Adoption of MNS in Healthcare Sector.
7. Are there any restraints impacting market growth?
Intense Competition in the Market.
8. Can you provide examples of recent developments in the market?
August 2022 - Acoustic Technology, Inc. announced the launch of its next generation for the entire ATI's MNS Product line. The next generation of the Mass Notification System product line combines the field-proven features with several vital enhancements delivering the most advanced solution on the market to date.
9. What pricing options are available for accessing the report?
Pricing options include single-user, multi-user, and enterprise licenses priced at USD 4750, USD 5250, and USD 8750 respectively.
10. Is the market size provided in terms of value or volume?
The market size is provided in terms of value, measured in Million.
11. Are there any specific market keywords associated with the report?
Yes, the market keyword associated with the report is "Mass Notification Systems Industry," which aids in identifying and referencing the specific market segment covered.
12. How do I determine which pricing option suits my needs best?
The pricing options vary based on user requirements and access needs. Individual users may opt for single-user licenses, while businesses requiring broader access may choose multi-user or enterprise licenses for cost-effective access to the report.
13. Are there any additional resources or data provided in the Mass Notification Systems Industry report?
While the report offers comprehensive insights, it's advisable to review the specific contents or supplementary materials provided to ascertain if additional resources or data are available.
14. How can I stay updated on further developments or reports in the Mass Notification Systems Industry?
To stay informed about further developments, trends, and reports in the Mass Notification Systems Industry, consider subscribing to industry newsletters, following relevant companies and organizations, or regularly checking reputable industry news sources and publications.
Methodology
Step 1 - Identification of Relevant Samples Size from Population Database


Step 2 - Approaches for Defining Global Market Size (Value, Volume* & Price*)

Note*: In applicable scenarios
Step 3 - Data Sources
Primary Research
- Web Analytics
- Survey Reports
- Research Institute
- Latest Research Reports
- Opinion Leaders
Secondary Research
- Annual Reports
- White Paper
- Latest Press Release
- Industry Association
- Paid Database
- Investor Presentations

Step 4 - Data Triangulation
Involves using different sources of information in order to increase the validity of a study
These sources are likely to be stakeholders in a program - participants, other researchers, program staff, other community members, and so on.
Then we put all data in single framework & apply various statistical tools to find out the dynamic on the market.
During the analysis stage, feedback from the stakeholder groups would be compared to determine areas of agreement as well as areas of divergence


