
Key Insights
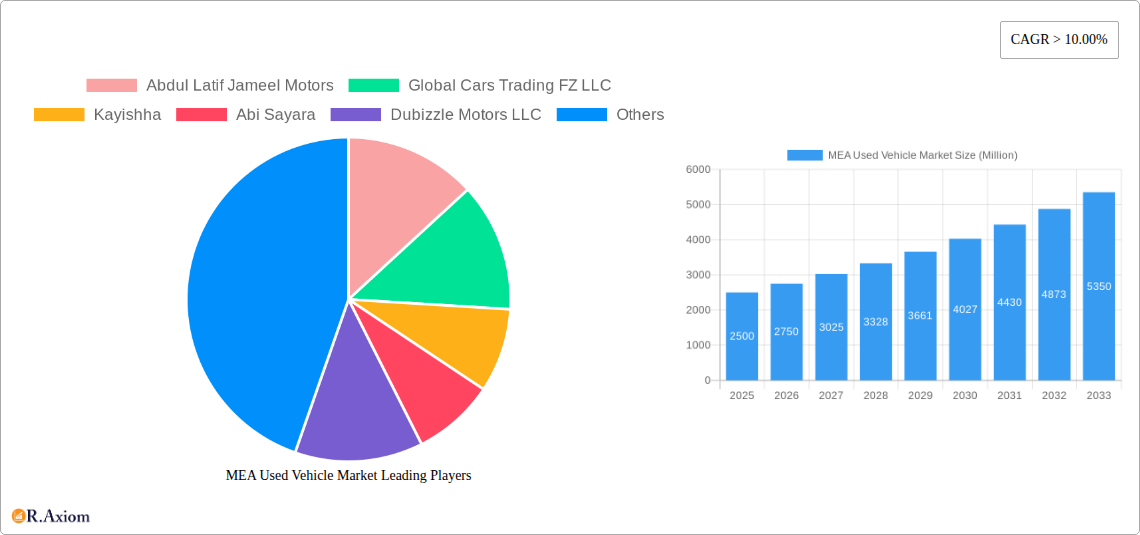
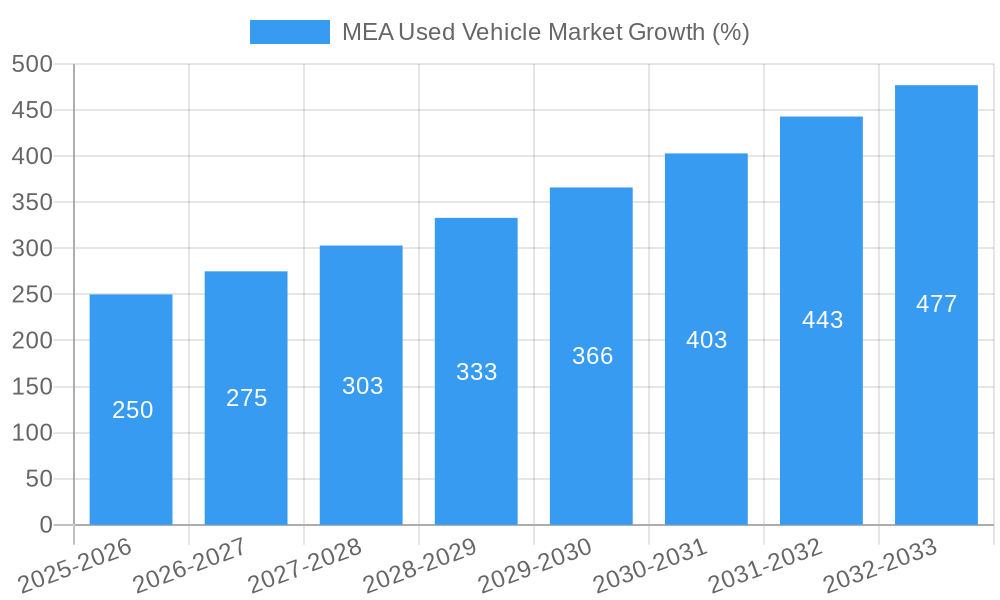
The Middle East and Africa (MEA) used vehicle market is experiencing robust growth, driven by factors such as increasing vehicle ownership, particularly in rapidly urbanizing areas, and the affordability of used vehicles compared to new ones. A Compound Annual Growth Rate (CAGR) exceeding 10% indicates a significant expansion of this market, projected to continue through 2033. The market is segmented by vehicle type (hatchbacks, sedans, SUVs), vendor type (organized and unorganized dealerships, online platforms), and country (with the UAE, Saudi Arabia, and Egypt representing key markets). The dominance of SUVs reflects shifting consumer preferences towards larger vehicles, suitable for families and diverse terrains. The organized sector, characterized by established dealerships and online marketplaces like Dubizzle Motors LLC and Yallamotor, is expected to witness faster growth due to enhanced consumer trust and structured processes. However, the unorganized sector, comprising individual sellers, still holds a substantial market share due to its price competitiveness. Restrictive government regulations on vehicle imports or age limits on used vehicle sales could pose challenges to the market's expansion.
The competitive landscape features both international and local players, with companies like Abdul Latif Jameel Motors and Al-Futtaim Group holding significant market positions. Growth is fueled by increasing disposable incomes, evolving consumer preferences, and the expansion of online platforms facilitating used vehicle transactions. While the market faces constraints like fluctuating fuel prices and economic uncertainties, the long-term outlook remains positive. The market's diversification across various countries in the MEA region, coupled with its potential for further growth in emerging economies like Kenya, positions it for continued expansion in the coming years. Continued infrastructure development and rising middle-class populations will further stimulate demand for used vehicles.
MEA Used Vehicle Market: A Comprehensive Report (2019-2033)
This in-depth report provides a comprehensive analysis of the Middle East and Africa (MEA) used vehicle market, offering invaluable insights for industry stakeholders, investors, and businesses seeking to navigate this dynamic sector. The study covers the period from 2019 to 2033, with a focus on the forecast period of 2025-2033 and a base year of 2025. The report analyzes key market trends, competitive landscapes, and growth opportunities across various segments, including vehicle types (Hatchbacks, Sedans, SUVs), vendor types (Organized, Unorganized), and countries (United Arab Emirates, Saudi Arabia, Egypt, Kenya, and the Rest of MEA). The report also includes a detailed look at leading players such as Abdul Latif Jameel Motors, Global Cars Trading FZ LLC, Kayishha, Abi Sayara, Dubizzle Motors LLC, Al-Futtaim Group, Yallamotor, and Bavaria Motors (list not exhaustive). Expected market value is xx Million.
MEA Used Vehicle Market Market Concentration & Innovation
The MEA used vehicle market exhibits a moderately concentrated structure, with a few large players holding significant market share, alongside numerous smaller, independent dealers. Market share data for key players in 2024 is estimated at: Abdul Latif Jameel Motors (15%), Al-Futtaim Group (12%), Global Cars Trading FZ LLC (8%), with remaining share distributed across numerous smaller players. Innovation in this sector is driven by the increasing adoption of online platforms and digital technologies, improving transparency and enhancing the customer experience. The regulatory framework varies across countries, impacting market dynamics. Product substitutes, such as ride-hailing services, pose a degree of competition, particularly in urban areas. End-user trends show a preference for fuel-efficient and technologically advanced vehicles. M&A activity in the MEA used vehicle market has been relatively moderate in recent years, with deal values estimated at xx Million in 2024.
- Market Concentration: Moderately concentrated, dominated by a few major players.
- Innovation Drivers: Digitalization, online marketplaces, and technological advancements in vehicle inspection and valuation.
- Regulatory Frameworks: Vary significantly across countries, impacting market access and operations.
- Product Substitutes: Ride-hailing services, public transportation.
- End-User Trends: Demand for fuel-efficient vehicles and advanced safety features.
- M&A Activity: Relatively moderate, with estimated deal values at xx Million in 2024.
MEA Used Vehicle Market Industry Trends & Insights
The MEA used vehicle market is experiencing significant growth, driven by factors such as rising disposable incomes, increasing urbanization, and a preference for used vehicles over new ones due to affordability and cost-effectiveness. Technological disruptions, particularly the emergence of online marketplaces, are reshaping the market landscape. Consumer preferences are shifting towards fuel-efficient and technologically advanced vehicles, with features such as safety systems and infotainment becoming increasingly important. Competitive dynamics are intense, with established players facing competition from both online marketplaces and smaller, independent dealers. The market is projected to experience a CAGR of xx% during the forecast period (2025-2033), with market penetration reaching xx% by 2033.
Dominant Markets & Segments in MEA Used Vehicle Market
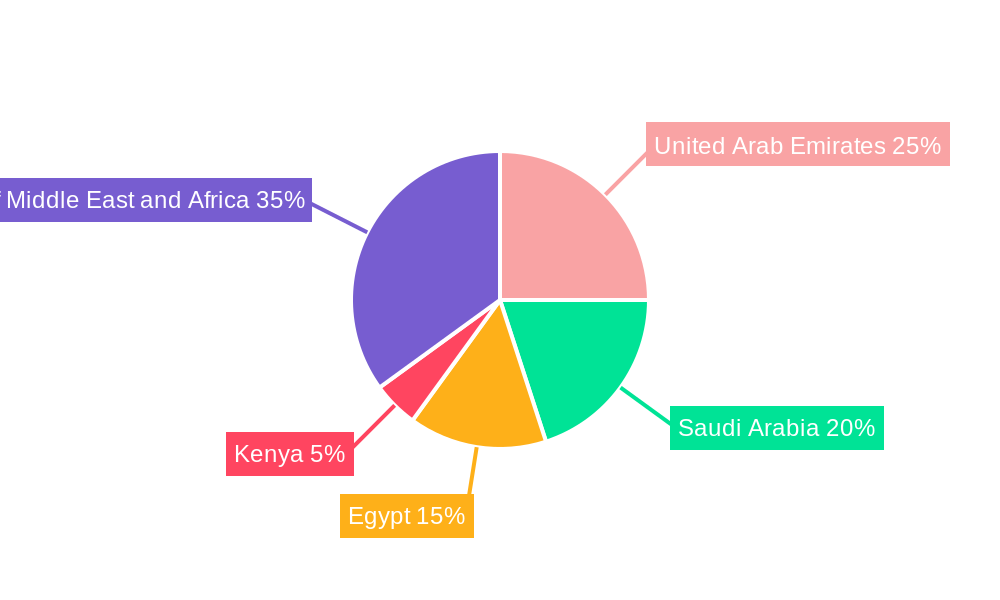
The UAE currently holds the largest share of the MEA used vehicle market, driven by strong economic growth, high vehicle ownership rates, and well-developed infrastructure. Saudi Arabia and Egypt are also significant markets, but their growth rates are expected to slightly trail the UAE's over the forecast period.
- Leading Region: United Arab Emirates
- Key Drivers for UAE Dominance:
- Strong economic growth
- High vehicle ownership rates
- Well-developed infrastructure
- Established dealer network
- Favorable regulatory environment
- Segment Dominance: SUVs and Sedans are the most dominant vehicle types, followed by Hatchbacks. The organized vendor segment holds a larger market share than the unorganized segment.
The unorganized sector dominates in countries with limited regulatory oversight, while organized players are more prominent in countries with robust regulatory frameworks.
MEA Used Vehicle Market Product Developments
Recent product innovations in the MEA used vehicle market include the integration of online platforms for vehicle listings, virtual inspections, and financing options. These developments enhance customer experience and streamline the purchasing process. The key competitive advantages are centered around providing better value, transparency, and convenience to buyers. Technological trends such as AI-powered vehicle valuation and condition assessment are gaining traction. The adoption of these innovations is expected to increase steadily during the forecast period.
Report Scope & Segmentation Analysis
This report segments the MEA used vehicle market by vehicle type (Hatchbacks, Sedans, SUVs), vendor type (Organized, Unorganized), and country (UAE, Saudi Arabia, Egypt, Kenya, Rest of MEA). Each segment is analyzed in detail, providing insights into market size, growth projections, and competitive dynamics. Growth rates vary among segments, with SUVs and organized vendors anticipated to grow at a faster pace compared to other segments due to their increasing popularity and rising consumer preference for transparency and trust. The competitive landscape varies across segments and countries, with different levels of consolidation and market concentration.
Key Drivers of MEA Used Vehicle Market Growth
Several factors are driving growth in the MEA used vehicle market. Rising disposable incomes in many MEA countries are leading to increased demand for personal vehicles. Urbanization is driving a need for personal transportation in rapidly growing cities. The affordability of used vehicles compared to new ones makes them an attractive option for a wider segment of the population. Government initiatives to improve infrastructure, such as road networks and public transportation, also contribute to higher demand. Moreover, the rise of digital platforms providing easier access to inventory and financing options is fueling market expansion.
Challenges in the MEA Used Vehicle Market Sector
Several challenges hinder the growth of the MEA used vehicle market. Inconsistent regulatory frameworks across different countries create complexities for businesses operating regionally. The lack of standardized vehicle inspection and valuation processes can lead to uncertainty and lack of transparency. Supply chain disruptions, particularly in the post-pandemic era, can affect vehicle availability and pricing. Intense competition from both established and emerging players can squeeze profit margins. These factors contribute to significant challenges for companies operating in the sector.
Emerging Opportunities in MEA Used Vehicle Market
The MEA used vehicle market presents several emerging opportunities. The expansion of digital platforms offers a chance to reach wider customer bases and streamline operations. The growing adoption of used electric vehicles is an opportunity for companies to cater to environmentally conscious consumers. The development of innovative financing options, such as leasing and subscription services, can attract new customer segments. Furthermore, market expansion into underserved regions and countries with growing vehicle ownership rates offer opportunities for significant growth.
Leading Players in the MEA Used Vehicle Market Market
- Abdul Latif Jameel Motors
- Global Cars Trading FZ LLC
- Kayishha
- Abi Sayara
- Dubizzle Motors LLC
- Al-Futtaim Group
- Yallamotor
- Bavaria Motors
Key Developments in MEA Used Vehicle Market Industry
- March 2022: ADIB (Abu Dhabi Islamic Bank) launched the emirates' largest digital car marketplace, offering a one-stop shop for car search, test drives, insurance quotes, and financing. This initiative significantly enhanced the customer experience and improved market transparency. The impact has been a noticeable increase in online transactions and a greater level of convenience for buyers.
Strategic Outlook for MEA Used Vehicle Market Market
The MEA used vehicle market is poised for continued growth, driven by a confluence of factors including rising disposable incomes, urbanization, and technological advancements. The ongoing adoption of digital platforms will further transform the market dynamics, improving transparency and efficiency. The emergence of innovative financing options and the expansion into new markets present significant opportunities for growth and market share gains for businesses that adapt to these changing market conditions. Continued focus on providing customer value and convenient purchasing processes will likely be key success factors for businesses in this sector.
MEA Used Vehicle Market Segmentation
-
1. Vehicle Type
- 1.1. Hachbacks
- 1.2. Sedan
- 1.3. Sports Utility vehicles (SUV)
-
2. Vendor Type
- 2.1. Organized
- 2.2. Unorganized
MEA Used Vehicle Market Segmentation By Geography
-
1. North America
- 1.1. United States
- 1.2. Canada
- 1.3. Mexico
-
2. South America
- 2.1. Brazil
- 2.2. Argentina
- 2.3. Rest of South America
-
3. Europe
- 3.1. United Kingdom
- 3.2. Germany
- 3.3. France
- 3.4. Italy
- 3.5. Spain
- 3.6. Russia
- 3.7. Benelux
- 3.8. Nordics
- 3.9. Rest of Europe
-
4. Middle East & Africa
- 4.1. Turkey
- 4.2. Israel
- 4.3. GCC
- 4.4. North Africa
- 4.5. South Africa
- 4.6. Rest of Middle East & Africa
-
5. Asia Pacific
- 5.1. China
- 5.2. India
- 5.3. Japan
- 5.4. South Korea
- 5.5. ASEAN
- 5.6. Oceania
- 5.7. Rest of Asia Pacific
MEA Used Vehicle Market REPORT HIGHLIGHTS
| Aspects | Details |
|---|---|
| Study Period | 2019-2033 |
| Base Year | 2024 |
| Estimated Year | 2025 |
| Forecast Period | 2025-2033 |
| Historical Period | 2019-2024 |
| Growth Rate | CAGR of > 10.00% from 2019-2033 |
| Segmentation |
|
Table of Contents
- 1. Introduction
- 1.1. Research Scope
- 1.2. Market Segmentation
- 1.3. Research Methodology
- 1.4. Definitions and Assumptions
- 2. Executive Summary
- 2.1. Introduction
- 3. Market Dynamics
- 3.1. Introduction
- 3.2. Market Drivers
- 3.2.1. The Increasing Demand for Luxury Cars is Anticipated to Boost the Market
- 3.3. Market Restrains
- 3.3.1. Comparatively Limited Market Transparency May Hinder the Market
- 3.4. Market Trends
- 3.4.1. Shift towards Unorganized Vendor to Elevate Used Cars Sales In Middle-East and Africa
- 4. Market Factor Analysis
- 4.1. Porters Five Forces
- 4.2. Supply/Value Chain
- 4.3. PESTEL analysis
- 4.4. Market Entropy
- 4.5. Patent/Trademark Analysis
- 5. Global MEA Used Vehicle Market Analysis, Insights and Forecast, 2019-2031
- 5.1. Market Analysis, Insights and Forecast - by Vehicle Type
- 5.1.1. Hachbacks
- 5.1.2. Sedan
- 5.1.3. Sports Utility vehicles (SUV)
- 5.2. Market Analysis, Insights and Forecast - by Vendor Type
- 5.2.1. Organized
- 5.2.2. Unorganized
- 5.3. Market Analysis, Insights and Forecast - by Region
- 5.3.1. North America
- 5.3.2. South America
- 5.3.3. Europe
- 5.3.4. Middle East & Africa
- 5.3.5. Asia Pacific
- 5.1. Market Analysis, Insights and Forecast - by Vehicle Type
- 6. North America MEA Used Vehicle Market Analysis, Insights and Forecast, 2019-2031
- 6.1. Market Analysis, Insights and Forecast - by Vehicle Type
- 6.1.1. Hachbacks
- 6.1.2. Sedan
- 6.1.3. Sports Utility vehicles (SUV)
- 6.2. Market Analysis, Insights and Forecast - by Vendor Type
- 6.2.1. Organized
- 6.2.2. Unorganized
- 6.1. Market Analysis, Insights and Forecast - by Vehicle Type
- 7. South America MEA Used Vehicle Market Analysis, Insights and Forecast, 2019-2031
- 7.1. Market Analysis, Insights and Forecast - by Vehicle Type
- 7.1.1. Hachbacks
- 7.1.2. Sedan
- 7.1.3. Sports Utility vehicles (SUV)
- 7.2. Market Analysis, Insights and Forecast - by Vendor Type
- 7.2.1. Organized
- 7.2.2. Unorganized
- 7.1. Market Analysis, Insights and Forecast - by Vehicle Type
- 8. Europe MEA Used Vehicle Market Analysis, Insights and Forecast, 2019-2031
- 8.1. Market Analysis, Insights and Forecast - by Vehicle Type
- 8.1.1. Hachbacks
- 8.1.2. Sedan
- 8.1.3. Sports Utility vehicles (SUV)
- 8.2. Market Analysis, Insights and Forecast - by Vendor Type
- 8.2.1. Organized
- 8.2.2. Unorganized
- 8.1. Market Analysis, Insights and Forecast - by Vehicle Type
- 9. Middle East & Africa MEA Used Vehicle Market Analysis, Insights and Forecast, 2019-2031
- 9.1. Market Analysis, Insights and Forecast - by Vehicle Type
- 9.1.1. Hachbacks
- 9.1.2. Sedan
- 9.1.3. Sports Utility vehicles (SUV)
- 9.2. Market Analysis, Insights and Forecast - by Vendor Type
- 9.2.1. Organized
- 9.2.2. Unorganized
- 9.1. Market Analysis, Insights and Forecast - by Vehicle Type
- 10. Asia Pacific MEA Used Vehicle Market Analysis, Insights and Forecast, 2019-2031
- 10.1. Market Analysis, Insights and Forecast - by Vehicle Type
- 10.1.1. Hachbacks
- 10.1.2. Sedan
- 10.1.3. Sports Utility vehicles (SUV)
- 10.2. Market Analysis, Insights and Forecast - by Vendor Type
- 10.2.1. Organized
- 10.2.2. Unorganized
- 10.1. Market Analysis, Insights and Forecast - by Vehicle Type
- 11. North America MEA Used Vehicle Market Analysis, Insights and Forecast, 2019-2031
- 11.1. Market Analysis, Insights and Forecast - By Country/Sub-region
- 11.1.1 United States
- 11.1.2 Canada
- 11.1.3 Rest of North America
- 12. Europe MEA Used Vehicle Market Analysis, Insights and Forecast, 2019-2031
- 12.1. Market Analysis, Insights and Forecast - By Country/Sub-region
- 12.1.1 Germany
- 12.1.2 United Kingdom
- 12.1.3 France
- 12.1.4 Spain
- 12.1.5 Rest of Europe
- 13. Asia Pacific MEA Used Vehicle Market Analysis, Insights and Forecast, 2019-2031
- 13.1. Market Analysis, Insights and Forecast - By Country/Sub-region
- 13.1.1 India
- 13.1.2 China
- 13.1.3 Japan
- 13.1.4 Rest of Asia Pacific
- 14. Latin America MEA Used Vehicle Market Analysis, Insights and Forecast, 2019-2031
- 14.1. Market Analysis, Insights and Forecast - By Country/Sub-region
- 14.1.1 Mexico
- 14.1.2 Brazil
- 14.1.3 Argentina
- 15. Middle East and Africa MEA Used Vehicle Market Analysis, Insights and Forecast, 2019-2031
- 15.1. Market Analysis, Insights and Forecast - By Country/Sub-region
- 15.1.1 United Arab Emirates
- 15.1.2 Saudi Arabia
- 15.1.3 Rest of Middle East and Africa
- 16. Competitive Analysis
- 16.1. Global Market Share Analysis 2024
- 16.2. Company Profiles
- 16.2.1 Abdul Latif Jameel Motors
- 16.2.1.1. Overview
- 16.2.1.2. Products
- 16.2.1.3. SWOT Analysis
- 16.2.1.4. Recent Developments
- 16.2.1.5. Financials (Based on Availability)
- 16.2.2 Global Cars Trading FZ LLC
- 16.2.2.1. Overview
- 16.2.2.2. Products
- 16.2.2.3. SWOT Analysis
- 16.2.2.4. Recent Developments
- 16.2.2.5. Financials (Based on Availability)
- 16.2.3 Kayishha
- 16.2.3.1. Overview
- 16.2.3.2. Products
- 16.2.3.3. SWOT Analysis
- 16.2.3.4. Recent Developments
- 16.2.3.5. Financials (Based on Availability)
- 16.2.4 Abi Sayara
- 16.2.4.1. Overview
- 16.2.4.2. Products
- 16.2.4.3. SWOT Analysis
- 16.2.4.4. Recent Developments
- 16.2.4.5. Financials (Based on Availability)
- 16.2.5 Dubizzle Motors LLC
- 16.2.5.1. Overview
- 16.2.5.2. Products
- 16.2.5.3. SWOT Analysis
- 16.2.5.4. Recent Developments
- 16.2.5.5. Financials (Based on Availability)
- 16.2.6 Al-Futtaim Group
- 16.2.6.1. Overview
- 16.2.6.2. Products
- 16.2.6.3. SWOT Analysis
- 16.2.6.4. Recent Developments
- 16.2.6.5. Financials (Based on Availability)
- 16.2.7 Yallamotor
- 16.2.7.1. Overview
- 16.2.7.2. Products
- 16.2.7.3. SWOT Analysis
- 16.2.7.4. Recent Developments
- 16.2.7.5. Financials (Based on Availability)
- 16.2.8 Bavaria Motors*List Not Exhaustive
- 16.2.8.1. Overview
- 16.2.8.2. Products
- 16.2.8.3. SWOT Analysis
- 16.2.8.4. Recent Developments
- 16.2.8.5. Financials (Based on Availability)
- 16.2.1 Abdul Latif Jameel Motors
List of Figures
- Figure 1: Global MEA Used Vehicle Market Revenue Breakdown (Million, %) by Region 2024 & 2032
- Figure 2: North America MEA Used Vehicle Market Revenue (Million), by Country 2024 & 2032
- Figure 3: North America MEA Used Vehicle Market Revenue Share (%), by Country 2024 & 2032
- Figure 4: Europe MEA Used Vehicle Market Revenue (Million), by Country 2024 & 2032
- Figure 5: Europe MEA Used Vehicle Market Revenue Share (%), by Country 2024 & 2032
- Figure 6: Asia Pacific MEA Used Vehicle Market Revenue (Million), by Country 2024 & 2032
- Figure 7: Asia Pacific MEA Used Vehicle Market Revenue Share (%), by Country 2024 & 2032
- Figure 8: Latin America MEA Used Vehicle Market Revenue (Million), by Country 2024 & 2032
- Figure 9: Latin America MEA Used Vehicle Market Revenue Share (%), by Country 2024 & 2032
- Figure 10: Middle East and Africa MEA Used Vehicle Market Revenue (Million), by Country 2024 & 2032
- Figure 11: Middle East and Africa MEA Used Vehicle Market Revenue Share (%), by Country 2024 & 2032
- Figure 12: North America MEA Used Vehicle Market Revenue (Million), by Vehicle Type 2024 & 2032
- Figure 13: North America MEA Used Vehicle Market Revenue Share (%), by Vehicle Type 2024 & 2032
- Figure 14: North America MEA Used Vehicle Market Revenue (Million), by Vendor Type 2024 & 2032
- Figure 15: North America MEA Used Vehicle Market Revenue Share (%), by Vendor Type 2024 & 2032
- Figure 16: North America MEA Used Vehicle Market Revenue (Million), by Country 2024 & 2032
- Figure 17: North America MEA Used Vehicle Market Revenue Share (%), by Country 2024 & 2032
- Figure 18: South America MEA Used Vehicle Market Revenue (Million), by Vehicle Type 2024 & 2032
- Figure 19: South America MEA Used Vehicle Market Revenue Share (%), by Vehicle Type 2024 & 2032
- Figure 20: South America MEA Used Vehicle Market Revenue (Million), by Vendor Type 2024 & 2032
- Figure 21: South America MEA Used Vehicle Market Revenue Share (%), by Vendor Type 2024 & 2032
- Figure 22: South America MEA Used Vehicle Market Revenue (Million), by Country 2024 & 2032
- Figure 23: South America MEA Used Vehicle Market Revenue Share (%), by Country 2024 & 2032
- Figure 24: Europe MEA Used Vehicle Market Revenue (Million), by Vehicle Type 2024 & 2032
- Figure 25: Europe MEA Used Vehicle Market Revenue Share (%), by Vehicle Type 2024 & 2032
- Figure 26: Europe MEA Used Vehicle Market Revenue (Million), by Vendor Type 2024 & 2032
- Figure 27: Europe MEA Used Vehicle Market Revenue Share (%), by Vendor Type 2024 & 2032
- Figure 28: Europe MEA Used Vehicle Market Revenue (Million), by Country 2024 & 2032
- Figure 29: Europe MEA Used Vehicle Market Revenue Share (%), by Country 2024 & 2032
- Figure 30: Middle East & Africa MEA Used Vehicle Market Revenue (Million), by Vehicle Type 2024 & 2032
- Figure 31: Middle East & Africa MEA Used Vehicle Market Revenue Share (%), by Vehicle Type 2024 & 2032
- Figure 32: Middle East & Africa MEA Used Vehicle Market Revenue (Million), by Vendor Type 2024 & 2032
- Figure 33: Middle East & Africa MEA Used Vehicle Market Revenue Share (%), by Vendor Type 2024 & 2032
- Figure 34: Middle East & Africa MEA Used Vehicle Market Revenue (Million), by Country 2024 & 2032
- Figure 35: Middle East & Africa MEA Used Vehicle Market Revenue Share (%), by Country 2024 & 2032
- Figure 36: Asia Pacific MEA Used Vehicle Market Revenue (Million), by Vehicle Type 2024 & 2032
- Figure 37: Asia Pacific MEA Used Vehicle Market Revenue Share (%), by Vehicle Type 2024 & 2032
- Figure 38: Asia Pacific MEA Used Vehicle Market Revenue (Million), by Vendor Type 2024 & 2032
- Figure 39: Asia Pacific MEA Used Vehicle Market Revenue Share (%), by Vendor Type 2024 & 2032
- Figure 40: Asia Pacific MEA Used Vehicle Market Revenue (Million), by Country 2024 & 2032
- Figure 41: Asia Pacific MEA Used Vehicle Market Revenue Share (%), by Country 2024 & 2032
List of Tables
- Table 1: Global MEA Used Vehicle Market Revenue Million Forecast, by Region 2019 & 2032
- Table 2: Global MEA Used Vehicle Market Revenue Million Forecast, by Vehicle Type 2019 & 2032
- Table 3: Global MEA Used Vehicle Market Revenue Million Forecast, by Vendor Type 2019 & 2032
- Table 4: Global MEA Used Vehicle Market Revenue Million Forecast, by Region 2019 & 2032
- Table 5: Global MEA Used Vehicle Market Revenue Million Forecast, by Country 2019 & 2032
- Table 6: United States MEA Used Vehicle Market Revenue (Million) Forecast, by Application 2019 & 2032
- Table 7: Canada MEA Used Vehicle Market Revenue (Million) Forecast, by Application 2019 & 2032
- Table 8: Rest of North America MEA Used Vehicle Market Revenue (Million) Forecast, by Application 2019 & 2032
- Table 9: Global MEA Used Vehicle Market Revenue Million Forecast, by Country 2019 & 2032
- Table 10: Germany MEA Used Vehicle Market Revenue (Million) Forecast, by Application 2019 & 2032
- Table 11: United Kingdom MEA Used Vehicle Market Revenue (Million) Forecast, by Application 2019 & 2032
- Table 12: France MEA Used Vehicle Market Revenue (Million) Forecast, by Application 2019 & 2032
- Table 13: Spain MEA Used Vehicle Market Revenue (Million) Forecast, by Application 2019 & 2032
- Table 14: Rest of Europe MEA Used Vehicle Market Revenue (Million) Forecast, by Application 2019 & 2032
- Table 15: Global MEA Used Vehicle Market Revenue Million Forecast, by Country 2019 & 2032
- Table 16: India MEA Used Vehicle Market Revenue (Million) Forecast, by Application 2019 & 2032
- Table 17: China MEA Used Vehicle Market Revenue (Million) Forecast, by Application 2019 & 2032
- Table 18: Japan MEA Used Vehicle Market Revenue (Million) Forecast, by Application 2019 & 2032
- Table 19: Rest of Asia Pacific MEA Used Vehicle Market Revenue (Million) Forecast, by Application 2019 & 2032
- Table 20: Global MEA Used Vehicle Market Revenue Million Forecast, by Country 2019 & 2032
- Table 21: Mexico MEA Used Vehicle Market Revenue (Million) Forecast, by Application 2019 & 2032
- Table 22: Brazil MEA Used Vehicle Market Revenue (Million) Forecast, by Application 2019 & 2032
- Table 23: Argentina MEA Used Vehicle Market Revenue (Million) Forecast, by Application 2019 & 2032
- Table 24: Global MEA Used Vehicle Market Revenue Million Forecast, by Country 2019 & 2032
- Table 25: United Arab Emirates MEA Used Vehicle Market Revenue (Million) Forecast, by Application 2019 & 2032
- Table 26: Saudi Arabia MEA Used Vehicle Market Revenue (Million) Forecast, by Application 2019 & 2032
- Table 27: Rest of Middle East and Africa MEA Used Vehicle Market Revenue (Million) Forecast, by Application 2019 & 2032
- Table 28: Global MEA Used Vehicle Market Revenue Million Forecast, by Vehicle Type 2019 & 2032
- Table 29: Global MEA Used Vehicle Market Revenue Million Forecast, by Vendor Type 2019 & 2032
- Table 30: Global MEA Used Vehicle Market Revenue Million Forecast, by Country 2019 & 2032
- Table 31: United States MEA Used Vehicle Market Revenue (Million) Forecast, by Application 2019 & 2032
- Table 32: Canada MEA Used Vehicle Market Revenue (Million) Forecast, by Application 2019 & 2032
- Table 33: Mexico MEA Used Vehicle Market Revenue (Million) Forecast, by Application 2019 & 2032
- Table 34: Global MEA Used Vehicle Market Revenue Million Forecast, by Vehicle Type 2019 & 2032
- Table 35: Global MEA Used Vehicle Market Revenue Million Forecast, by Vendor Type 2019 & 2032
- Table 36: Global MEA Used Vehicle Market Revenue Million Forecast, by Country 2019 & 2032
- Table 37: Brazil MEA Used Vehicle Market Revenue (Million) Forecast, by Application 2019 & 2032
- Table 38: Argentina MEA Used Vehicle Market Revenue (Million) Forecast, by Application 2019 & 2032
- Table 39: Rest of South America MEA Used Vehicle Market Revenue (Million) Forecast, by Application 2019 & 2032
- Table 40: Global MEA Used Vehicle Market Revenue Million Forecast, by Vehicle Type 2019 & 2032
- Table 41: Global MEA Used Vehicle Market Revenue Million Forecast, by Vendor Type 2019 & 2032
- Table 42: Global MEA Used Vehicle Market Revenue Million Forecast, by Country 2019 & 2032
- Table 43: United Kingdom MEA Used Vehicle Market Revenue (Million) Forecast, by Application 2019 & 2032
- Table 44: Germany MEA Used Vehicle Market Revenue (Million) Forecast, by Application 2019 & 2032
- Table 45: France MEA Used Vehicle Market Revenue (Million) Forecast, by Application 2019 & 2032
- Table 46: Italy MEA Used Vehicle Market Revenue (Million) Forecast, by Application 2019 & 2032
- Table 47: Spain MEA Used Vehicle Market Revenue (Million) Forecast, by Application 2019 & 2032
- Table 48: Russia MEA Used Vehicle Market Revenue (Million) Forecast, by Application 2019 & 2032
- Table 49: Benelux MEA Used Vehicle Market Revenue (Million) Forecast, by Application 2019 & 2032
- Table 50: Nordics MEA Used Vehicle Market Revenue (Million) Forecast, by Application 2019 & 2032
- Table 51: Rest of Europe MEA Used Vehicle Market Revenue (Million) Forecast, by Application 2019 & 2032
- Table 52: Global MEA Used Vehicle Market Revenue Million Forecast, by Vehicle Type 2019 & 2032
- Table 53: Global MEA Used Vehicle Market Revenue Million Forecast, by Vendor Type 2019 & 2032
- Table 54: Global MEA Used Vehicle Market Revenue Million Forecast, by Country 2019 & 2032
- Table 55: Turkey MEA Used Vehicle Market Revenue (Million) Forecast, by Application 2019 & 2032
- Table 56: Israel MEA Used Vehicle Market Revenue (Million) Forecast, by Application 2019 & 2032
- Table 57: GCC MEA Used Vehicle Market Revenue (Million) Forecast, by Application 2019 & 2032
- Table 58: North Africa MEA Used Vehicle Market Revenue (Million) Forecast, by Application 2019 & 2032
- Table 59: South Africa MEA Used Vehicle Market Revenue (Million) Forecast, by Application 2019 & 2032
- Table 60: Rest of Middle East & Africa MEA Used Vehicle Market Revenue (Million) Forecast, by Application 2019 & 2032
- Table 61: Global MEA Used Vehicle Market Revenue Million Forecast, by Vehicle Type 2019 & 2032
- Table 62: Global MEA Used Vehicle Market Revenue Million Forecast, by Vendor Type 2019 & 2032
- Table 63: Global MEA Used Vehicle Market Revenue Million Forecast, by Country 2019 & 2032
- Table 64: China MEA Used Vehicle Market Revenue (Million) Forecast, by Application 2019 & 2032
- Table 65: India MEA Used Vehicle Market Revenue (Million) Forecast, by Application 2019 & 2032
- Table 66: Japan MEA Used Vehicle Market Revenue (Million) Forecast, by Application 2019 & 2032
- Table 67: South Korea MEA Used Vehicle Market Revenue (Million) Forecast, by Application 2019 & 2032
- Table 68: ASEAN MEA Used Vehicle Market Revenue (Million) Forecast, by Application 2019 & 2032
- Table 69: Oceania MEA Used Vehicle Market Revenue (Million) Forecast, by Application 2019 & 2032
- Table 70: Rest of Asia Pacific MEA Used Vehicle Market Revenue (Million) Forecast, by Application 2019 & 2032
Frequently Asked Questions
1. What is the projected Compound Annual Growth Rate (CAGR) of the MEA Used Vehicle Market?
The projected CAGR is approximately > 10.00%.
2. Which companies are prominent players in the MEA Used Vehicle Market?
Key companies in the market include Abdul Latif Jameel Motors, Global Cars Trading FZ LLC, Kayishha, Abi Sayara, Dubizzle Motors LLC, Al-Futtaim Group, Yallamotor, Bavaria Motors*List Not Exhaustive.
3. What are the main segments of the MEA Used Vehicle Market?
The market segments include Vehicle Type, Vendor Type.
4. Can you provide details about the market size?
The market size is estimated to be USD XX Million as of 2022.
5. What are some drivers contributing to market growth?
The Increasing Demand for Luxury Cars is Anticipated to Boost the Market.
6. What are the notable trends driving market growth?
Shift towards Unorganized Vendor to Elevate Used Cars Sales In Middle-East and Africa.
7. Are there any restraints impacting market growth?
Comparatively Limited Market Transparency May Hinder the Market.
8. Can you provide examples of recent developments in the market?
In March 2022, ADIB (Abu Dhabi Islamic Bank) launched the emirates' largest digital car marketplace. Using this digital marketplace, on a single view, consumers can easily search for cars from a wide network of dealers and distributors, schedule a test drive, obtain an insurance quote for the car, and apply for financing for the same. The company discussed the issue with all 775 car dealers in UAE and finally made this digital portal for ease for buyers so that they can have their car from home itself.
9. What pricing options are available for accessing the report?
Pricing options include single-user, multi-user, and enterprise licenses priced at USD 4750, USD 4950, and USD 6800 respectively.
10. Is the market size provided in terms of value or volume?
The market size is provided in terms of value, measured in Million.
11. Are there any specific market keywords associated with the report?
Yes, the market keyword associated with the report is "MEA Used Vehicle Market," which aids in identifying and referencing the specific market segment covered.
12. How do I determine which pricing option suits my needs best?
The pricing options vary based on user requirements and access needs. Individual users may opt for single-user licenses, while businesses requiring broader access may choose multi-user or enterprise licenses for cost-effective access to the report.
13. Are there any additional resources or data provided in the MEA Used Vehicle Market report?
While the report offers comprehensive insights, it's advisable to review the specific contents or supplementary materials provided to ascertain if additional resources or data are available.
14. How can I stay updated on further developments or reports in the MEA Used Vehicle Market?
To stay informed about further developments, trends, and reports in the MEA Used Vehicle Market, consider subscribing to industry newsletters, following relevant companies and organizations, or regularly checking reputable industry news sources and publications.
Methodology
Step 1 - Identification of Relevant Samples Size from Population Database


Step 2 - Approaches for Defining Global Market Size (Value, Volume* & Price*)

Note*: In applicable scenarios
Step 3 - Data Sources
Primary Research
- Web Analytics
- Survey Reports
- Research Institute
- Latest Research Reports
- Opinion Leaders
Secondary Research
- Annual Reports
- White Paper
- Latest Press Release
- Industry Association
- Paid Database
- Investor Presentations

Step 4 - Data Triangulation
Involves using different sources of information in order to increase the validity of a study
These sources are likely to be stakeholders in a program - participants, other researchers, program staff, other community members, and so on.
Then we put all data in single framework & apply various statistical tools to find out the dynamic on the market.
During the analysis stage, feedback from the stakeholder groups would be compared to determine areas of agreement as well as areas of divergence


