

Key Insights
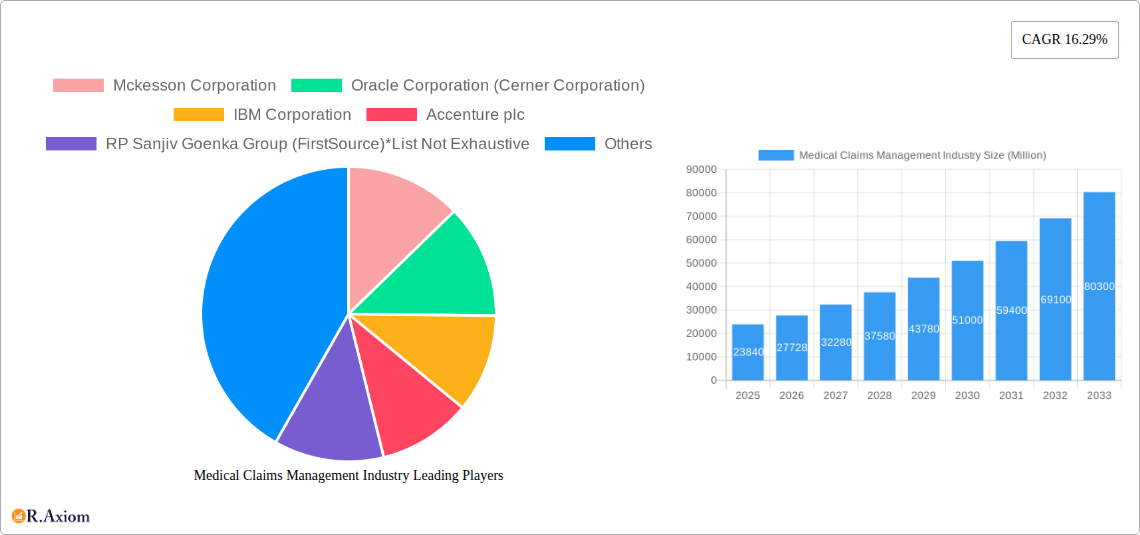
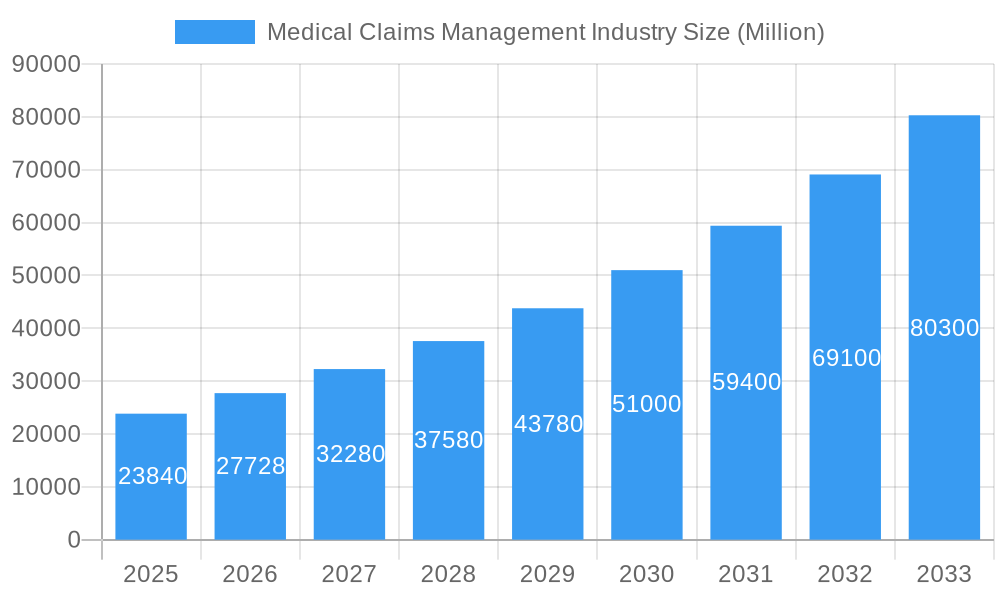
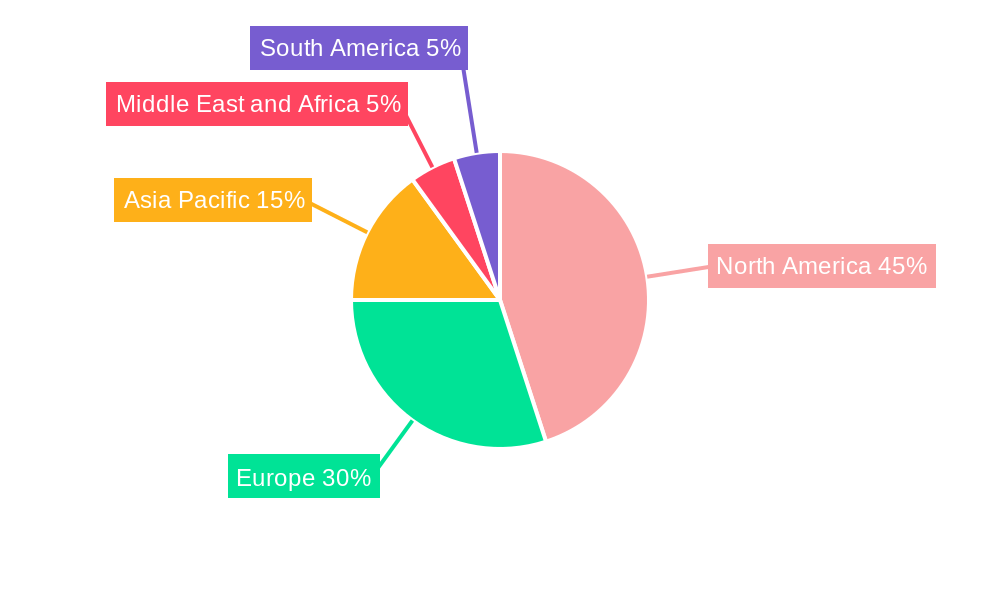
The medical claims management market, valued at $23.84 billion in 2025, is experiencing robust growth, projected to expand at a compound annual growth rate (CAGR) of 16.29% from 2025 to 2033. This expansion is driven by several key factors. The increasing volume of healthcare claims due to aging populations and rising chronic disease prevalence necessitates efficient claims processing solutions. Furthermore, the growing adoption of electronic health records (EHRs) and the increasing emphasis on value-based care are creating opportunities for advanced medical claims management software and services. The shift towards cloud-based solutions offers scalability and cost-effectiveness, fueling market growth. Competition among major players like McKesson, Oracle (Cerner), IBM, and Accenture, alongside specialized providers like Optum and Allscripts, is fostering innovation and driving down costs, benefiting healthcare payers and providers. However, challenges remain, including data security concerns, interoperability issues across different systems, and the need for continuous adaptation to evolving regulatory landscapes. The market is segmented by solution type (integrated vs. standalone), component (software, services), delivery mode (on-premise vs. cloud), and end-user (payers, providers, other). North America currently holds a significant market share, driven by high healthcare spending and technological advancements; however, Asia Pacific is expected to witness substantial growth due to increasing healthcare infrastructure development and rising adoption of digital healthcare technologies.
Medical Claims Management Industry Market Size (In Billion)
The market's future trajectory is strongly linked to technological advancements like artificial intelligence (AI) and machine learning (ML) for automating claims processing, fraud detection, and predictive analytics. Furthermore, increased government initiatives promoting healthcare interoperability and data exchange will play a crucial role. The ongoing evolution of payment models toward value-based care will further fuel demand for sophisticated claims management systems capable of handling complex reimbursement methodologies. Competition will likely intensify as smaller, specialized vendors continue to innovate and challenge established players. The strategic partnerships and acquisitions observed in the market indicate an evolving landscape where collaboration will be key to success. This dynamic market presents significant opportunities for providers capable of adapting to the technological and regulatory changes while offering robust, secure, and efficient claims management solutions.
Medical Claims Management Industry Company Market Share
Medical Claims Management Industry: A Comprehensive Market Report (2019-2033)
This in-depth report provides a comprehensive analysis of the Medical Claims Management industry, offering invaluable insights for stakeholders seeking to understand market dynamics, competitive landscapes, and future growth opportunities. The study period covers 2019-2033, with a focus on 2025 as the base and estimated year. The forecast period extends from 2025-2033, while the historical period analyzed encompasses 2019-2024. The report projects a market value exceeding $XX Million by 2033, with a Compound Annual Growth Rate (CAGR) of XX% during the forecast period.
Medical Claims Management Industry Market Concentration & Innovation
The Medical Claims Management industry is characterized by a moderately concentrated market structure, with key players like McKesson Corporation, Oracle Corporation (Cerner Corporation), IBM Corporation, Accenture plc, Optum Inc, and Conduent Inc (Health Solutions Plus) holding significant market share. However, the presence of numerous smaller players and the continuous emergence of innovative solutions create a dynamic competitive environment. The total market size for 2025 is estimated at $XX Million. M&A activity has been significant, with deal values exceeding $XX Million in the past five years, primarily driven by the need to expand service offerings and geographic reach.
- Market Share: McKesson Corporation holds an estimated XX% market share in 2025, followed by Oracle Corporation (Cerner Corporation) with XX%.
- M&A Activity: The average deal value in the last five years has been approximately $XX Million, reflecting consolidation within the industry.
- Innovation Drivers: Technological advancements, such as AI and Machine Learning, are major innovation drivers, leading to improved accuracy, efficiency, and automation in claims processing. The increasing adoption of cloud-based solutions and the growing focus on interoperability also stimulate innovation. Stringent regulatory frameworks drive compliance-focused innovations.
- Regulatory Landscape: HIPAA compliance and other data privacy regulations significantly influence industry practices and technology choices.
- Product Substitutes: While direct substitutes are limited, the increasing use of self-service portals and automated systems could indirectly influence market dynamics.
- End-User Trends: The shift towards value-based care and increasing demand for improved patient experience is reshaping the demands placed on claims management systems.
Medical Claims Management Industry Industry Trends & Insights
The Medical Claims Management industry is experiencing robust growth, driven by factors such as increasing healthcare spending, rising adoption of electronic health records (EHRs), and the growing need for efficient claims processing. The market penetration of cloud-based solutions continues to increase, with a projected XX% market share by 2033. Technological advancements, like AI and big data analytics, are transforming claims processing, improving accuracy, and reducing operational costs. Consumer preferences are shifting towards seamless and transparent healthcare experiences, which places increased importance on efficient claims management. Competitive dynamics are characterized by a mix of organic growth and strategic acquisitions, leading to consolidation and the emergence of larger, more comprehensive service providers. The increasing adoption of value-based care models is driving demand for sophisticated analytics capabilities within claims management systems. The market is expected to witness increased integration with other healthcare IT systems.
Dominant Markets & Segments in Medical Claims Management Industry
The North American region dominates the Medical Claims Management market, accounting for approximately XX% of the global market in 2025, driven by factors such as high healthcare expenditure, advanced technological infrastructure, and robust regulatory frameworks.
Key Drivers:
- Economic Policies: Favorable government policies supporting healthcare IT infrastructure development and digitalization contribute to market growth.
- Infrastructure: Advanced technological infrastructure enables the adoption of sophisticated claims management solutions.
Dominant Segments:
- Solution Type: Integrated solutions hold the largest market share due to their comprehensive functionalities.
- Component: Services segment leads, driven by the need for specialized expertise in claims processing and management.
- Delivery Mode: Cloud-based solutions are exhibiting rapid growth due to scalability, cost-effectiveness, and accessibility.
- End User: Healthcare payers constitute the largest segment, reflecting their crucial role in managing healthcare reimbursements.
Medical Claims Management Industry Product Developments
Recent product innovations focus on improving automation, accuracy, and efficiency in claims processing through AI-powered tools and predictive analytics. These advancements enhance compliance, reduce manual intervention, and streamline workflows. Integration with EHRs and other healthcare IT systems is a key feature, facilitating data exchange and reducing administrative burdens. The market is witnessing the development of solutions specifically tailored to address the unique needs of specific healthcare segments (e.g., specialty care, home healthcare).
Report Scope & Segmentation Analysis
This report segments the Medical Claims Management market across several key parameters:
Solution Type: Integrated Solutions and Standalone Solutions, with growth projections and competitive landscapes for each.
Component: Services and Software, outlining market size and growth trajectory.
Delivery Mode: On-Premise and Cloud-Based, analyzing market shares and future trends.
End User: Healthcare Payers, Healthcare Providers, and Other End Users, emphasizing segment-specific market dynamics. Each segment's growth projection, market size, and competitive landscape are analyzed.
Key Drivers of Medical Claims Management Industry Growth
The Medical Claims Management industry's growth is fueled by several key factors. The increasing volume of healthcare claims due to aging populations and rising healthcare utilization necessitates efficient claims management solutions. Technological advancements such as AI, machine learning, and cloud computing enhance accuracy, speed, and automation. Stringent government regulations emphasizing data security and compliance further drive the adoption of sophisticated claims management systems.
Challenges in the Medical Claims Management Industry Sector
Significant challenges include the complexity of healthcare regulations, leading to high compliance costs and potential penalties. Data security concerns, particularly related to sensitive patient information, pose significant challenges. The industry also faces pressure from rising operating costs and the need to integrate with a variety of legacy systems. Integrating various data sources efficiently presents a recurring hurdle. Competition amongst established players and new entrants intensifies pressure on margins.
Emerging Opportunities in Medical Claims Management Industry
Emerging opportunities lie in the expansion of telehealth services, driving demand for integrated telehealth claims management capabilities. Advancements in AI and machine learning allow for more sophisticated fraud detection and prevention systems. Growing adoption of value-based care models will necessitate advanced analytics for better cost management and care coordination. The incorporation of blockchain technology for enhanced security and transparency represents a significant opportunity.
Leading Players in the Medical Claims Management Industry Market
- Mckesson Corporation
- Oracle Corporation (Cerner Corporation)
- IBM Corporation
- Accenture plc
- RP Sanjiv Goenka Group (FirstSource)
- Optum Inc
- Conduent Inc (Health Solutions Plus)
- Allscripts Healthcare Solutions Inc
- OSP Labs
- Genpact Limited
- Athenahealth Inc
Key Developments in Medical Claims Management Industry Industry
- Jan 2023: McKesson Corporation launched a new AI-powered claims processing solution.
- Apr 2022: Optum Inc acquired a smaller claims management company, expanding its market share.
- Oct 2021: New HIPAA regulations led to increased investment in data security solutions. (Further key developments can be added here with year/month and impact)
Strategic Outlook for Medical Claims Management Industry Market
The Medical Claims Management market is poised for significant growth, driven by technological advancements, increasing healthcare spending, and the growing emphasis on efficiency and cost reduction. Future opportunities lie in developing AI-powered solutions, enhancing interoperability, and addressing the specific needs of emerging healthcare delivery models. The market will likely experience further consolidation through M&A activities and increased investments in research and development.
Medical Claims Management Industry Segmentation
-
1. Solution Type
- 1.1. Integrated Solutions
- 1.2. Standalone Solutions
-
2. Component
- 2.1. Services
- 2.2. Software
-
3. Delivery Mode
- 3.1. On-Premise
- 3.2. Cloud-Based
-
4. End User
- 4.1. Healthcare Payers
- 4.2. Healthcare Providers
- 4.3. Other End Users
Medical Claims Management Industry Segmentation By Geography
-
1. North America
- 1.1. United States
- 1.2. Canada
- 1.3. Mexico
-
2. Europe
- 2.1. Germany
- 2.2. United Kingdom
- 2.3. France
- 2.4. Italy
- 2.5. Spain
- 2.6. Rest of Europe
-
3. Asia Pacific
- 3.1. China
- 3.2. Japan
- 3.3. India
- 3.4. Australia
- 3.5. South Korea
- 3.6. Rest of Asia Pacific
-
4. Middle East and Africa
- 4.1. GCC
- 4.2. South Africa
- 4.3. Rest of Middle East and Africa
-
5. South America
- 5.1. Brazil
- 5.2. Argentina
- 5.3. Rest of South America
Medical Claims Management Industry Regional Market Share
Geographic Coverage of Medical Claims Management Industry
Medical Claims Management Industry REPORT HIGHLIGHTS
| Aspects | Details |
|---|---|
| Study Period | 2020-2034 |
| Base Year | 2025 |
| Estimated Year | 2026 |
| Forecast Period | 2026-2034 |
| Historical Period | 2020-2025 |
| Growth Rate | CAGR of 16.29% from 2020-2034 |
| Segmentation |
|
Table of Contents
- 1. Introduction
- 1.1. Research Scope
- 1.2. Market Segmentation
- 1.3. Research Objective
- 1.4. Definitions and Assumptions
- 2. Executive Summary
- 2.1. Market Snapshot
- 3. Market Dynamics
- 3.1. Market Drivers
- 3.2. Market Restrains
- 3.3. Market Trends
- 3.4. Market Opportunities
- 4. Market Factor Analysis
- 4.1. Porters Five Forces
- 4.1.1. Bargaining Power of Suppliers
- 4.1.2. Bargaining Power of Buyers
- 4.1.3. Threat of New Entrants
- 4.1.4. Threat of Substitutes
- 4.1.5. Competitive Rivalry
- 4.2. PESTEL analysis
- 4.3. BCG Analysis
- 4.3.1. Stars (High Growth, High Market Share)
- 4.3.2. Cash Cows (Low Growth, High Market Share)
- 4.3.3. Question Mark (High Growth, Low Market Share)
- 4.3.4. Dogs (Low Growth, Low Market Share)
- 4.4. Ansoff Matrix Analysis
- 4.5. Supply Chain Analysis
- 4.6. Regulatory Landscape
- 4.7. Current Market Potential and Opportunity Assessment (TAM–SAM–SOM Framework)
- 4.8. RAX Analyst Note
- 4.1. Porters Five Forces
- 5. Market Analysis, Insights and Forecast 2021-2033
- 5.1. Market Analysis, Insights and Forecast - by Solution Type
- 5.1.1. Integrated Solutions
- 5.1.2. Standalone Solutions
- 5.2. Market Analysis, Insights and Forecast - by Component
- 5.2.1. Services
- 5.2.2. Software
- 5.3. Market Analysis, Insights and Forecast - by Delivery Mode
- 5.3.1. On-Premise
- 5.3.2. Cloud-Based
- 5.4. Market Analysis, Insights and Forecast - by End User
- 5.4.1. Healthcare Payers
- 5.4.2. Healthcare Providers
- 5.4.3. Other End Users
- 5.5. Market Analysis, Insights and Forecast - by Region
- 5.5.1. North America
- 5.5.2. Europe
- 5.5.3. Asia Pacific
- 5.5.4. Middle East and Africa
- 5.5.5. South America
- 5.1. Market Analysis, Insights and Forecast - by Solution Type
- 6. Global Medical Claims Management Industry Analysis, Insights and Forecast, 2021-2033
- 6.1. Market Analysis, Insights and Forecast - by Solution Type
- 6.1.1. Integrated Solutions
- 6.1.2. Standalone Solutions
- 6.2. Market Analysis, Insights and Forecast - by Component
- 6.2.1. Services
- 6.2.2. Software
- 6.3. Market Analysis, Insights and Forecast - by Delivery Mode
- 6.3.1. On-Premise
- 6.3.2. Cloud-Based
- 6.4. Market Analysis, Insights and Forecast - by End User
- 6.4.1. Healthcare Payers
- 6.4.2. Healthcare Providers
- 6.4.3. Other End Users
- 6.1. Market Analysis, Insights and Forecast - by Solution Type
- 7. North America Medical Claims Management Industry Analysis, Insights and Forecast, 2020-2032
- 7.1. Market Analysis, Insights and Forecast - by Solution Type
- 7.1.1. Integrated Solutions
- 7.1.2. Standalone Solutions
- 7.2. Market Analysis, Insights and Forecast - by Component
- 7.2.1. Services
- 7.2.2. Software
- 7.3. Market Analysis, Insights and Forecast - by Delivery Mode
- 7.3.1. On-Premise
- 7.3.2. Cloud-Based
- 7.4. Market Analysis, Insights and Forecast - by End User
- 7.4.1. Healthcare Payers
- 7.4.2. Healthcare Providers
- 7.4.3. Other End Users
- 7.1. Market Analysis, Insights and Forecast - by Solution Type
- 8. Europe Medical Claims Management Industry Analysis, Insights and Forecast, 2020-2032
- 8.1. Market Analysis, Insights and Forecast - by Solution Type
- 8.1.1. Integrated Solutions
- 8.1.2. Standalone Solutions
- 8.2. Market Analysis, Insights and Forecast - by Component
- 8.2.1. Services
- 8.2.2. Software
- 8.3. Market Analysis, Insights and Forecast - by Delivery Mode
- 8.3.1. On-Premise
- 8.3.2. Cloud-Based
- 8.4. Market Analysis, Insights and Forecast - by End User
- 8.4.1. Healthcare Payers
- 8.4.2. Healthcare Providers
- 8.4.3. Other End Users
- 8.1. Market Analysis, Insights and Forecast - by Solution Type
- 9. Asia Pacific Medical Claims Management Industry Analysis, Insights and Forecast, 2020-2032
- 9.1. Market Analysis, Insights and Forecast - by Solution Type
- 9.1.1. Integrated Solutions
- 9.1.2. Standalone Solutions
- 9.2. Market Analysis, Insights and Forecast - by Component
- 9.2.1. Services
- 9.2.2. Software
- 9.3. Market Analysis, Insights and Forecast - by Delivery Mode
- 9.3.1. On-Premise
- 9.3.2. Cloud-Based
- 9.4. Market Analysis, Insights and Forecast - by End User
- 9.4.1. Healthcare Payers
- 9.4.2. Healthcare Providers
- 9.4.3. Other End Users
- 9.1. Market Analysis, Insights and Forecast - by Solution Type
- 10. Middle East and Africa Medical Claims Management Industry Analysis, Insights and Forecast, 2020-2032
- 10.1. Market Analysis, Insights and Forecast - by Solution Type
- 10.1.1. Integrated Solutions
- 10.1.2. Standalone Solutions
- 10.2. Market Analysis, Insights and Forecast - by Component
- 10.2.1. Services
- 10.2.2. Software
- 10.3. Market Analysis, Insights and Forecast - by Delivery Mode
- 10.3.1. On-Premise
- 10.3.2. Cloud-Based
- 10.4. Market Analysis, Insights and Forecast - by End User
- 10.4.1. Healthcare Payers
- 10.4.2. Healthcare Providers
- 10.4.3. Other End Users
- 10.1. Market Analysis, Insights and Forecast - by Solution Type
- 11. South America Medical Claims Management Industry Analysis, Insights and Forecast, 2020-2032
- 11.1. Market Analysis, Insights and Forecast - by Solution Type
- 11.1.1. Integrated Solutions
- 11.1.2. Standalone Solutions
- 11.2. Market Analysis, Insights and Forecast - by Component
- 11.2.1. Services
- 11.2.2. Software
- 11.3. Market Analysis, Insights and Forecast - by Delivery Mode
- 11.3.1. On-Premise
- 11.3.2. Cloud-Based
- 11.4. Market Analysis, Insights and Forecast - by End User
- 11.4.1. Healthcare Payers
- 11.4.2. Healthcare Providers
- 11.4.3. Other End Users
- 11.1. Market Analysis, Insights and Forecast - by Solution Type
- 12. Competitive Analysis
- 12.1. Company Profiles
- 12.1.1 Mckesson Corporation
- 12.1.1.1. Company Overview
- 12.1.1.2. Products
- 12.1.1.3. Company Financials
- 12.1.1.4. SWOT Analysis
- 12.1.2 Oracle Corporation (Cerner Corporation)
- 12.1.2.1. Company Overview
- 12.1.2.2. Products
- 12.1.2.3. Company Financials
- 12.1.2.4. SWOT Analysis
- 12.1.3 IBM Corporation
- 12.1.3.1. Company Overview
- 12.1.3.2. Products
- 12.1.3.3. Company Financials
- 12.1.3.4. SWOT Analysis
- 12.1.4 Accenture plc
- 12.1.4.1. Company Overview
- 12.1.4.2. Products
- 12.1.4.3. Company Financials
- 12.1.4.4. SWOT Analysis
- 12.1.5 RP Sanjiv Goenka Group (FirstSource)*List Not Exhaustive
- 12.1.5.1. Company Overview
- 12.1.5.2. Products
- 12.1.5.3. Company Financials
- 12.1.5.4. SWOT Analysis
- 12.1.6 Optum Inc
- 12.1.6.1. Company Overview
- 12.1.6.2. Products
- 12.1.6.3. Company Financials
- 12.1.6.4. SWOT Analysis
- 12.1.7 Conduent Inc (Health Solutions Plus)
- 12.1.7.1. Company Overview
- 12.1.7.2. Products
- 12.1.7.3. Company Financials
- 12.1.7.4. SWOT Analysis
- 12.1.8 Allscripts Healthcare Solutions Inc
- 12.1.8.1. Company Overview
- 12.1.8.2. Products
- 12.1.8.3. Company Financials
- 12.1.8.4. SWOT Analysis
- 12.1.9 OSP Labs
- 12.1.9.1. Company Overview
- 12.1.9.2. Products
- 12.1.9.3. Company Financials
- 12.1.9.4. SWOT Analysis
- 12.1.10 Genpact Limited
- 12.1.10.1. Company Overview
- 12.1.10.2. Products
- 12.1.10.3. Company Financials
- 12.1.10.4. SWOT Analysis
- 12.1.11 Athenahealth Inc
- 12.1.11.1. Company Overview
- 12.1.11.2. Products
- 12.1.11.3. Company Financials
- 12.1.11.4. SWOT Analysis
- 12.1.1 Mckesson Corporation
- 12.2. Market Entropy
- 12.2.1 Company's Key Areas Served
- 12.2.2 Recent Developments
- 12.3. Company Market Share Analysis 2025
- 12.3.1 Top 5 Companies Market Share Analysis
- 12.3.2 Top 3 Companies Market Share Analysis
- 12.4. List of Potential Customers
- 13. Research Methodology
List of Figures
- Figure 1: Global Medical Claims Management Industry Revenue Breakdown (Million, %) by Region 2025 & 2033
- Figure 2: North America Medical Claims Management Industry Revenue (Million), by Solution Type 2025 & 2033
- Figure 3: North America Medical Claims Management Industry Revenue Share (%), by Solution Type 2025 & 2033
- Figure 4: North America Medical Claims Management Industry Revenue (Million), by Component 2025 & 2033
- Figure 5: North America Medical Claims Management Industry Revenue Share (%), by Component 2025 & 2033
- Figure 6: North America Medical Claims Management Industry Revenue (Million), by Delivery Mode 2025 & 2033
- Figure 7: North America Medical Claims Management Industry Revenue Share (%), by Delivery Mode 2025 & 2033
- Figure 8: North America Medical Claims Management Industry Revenue (Million), by End User 2025 & 2033
- Figure 9: North America Medical Claims Management Industry Revenue Share (%), by End User 2025 & 2033
- Figure 10: North America Medical Claims Management Industry Revenue (Million), by Country 2025 & 2033
- Figure 11: North America Medical Claims Management Industry Revenue Share (%), by Country 2025 & 2033
- Figure 12: Europe Medical Claims Management Industry Revenue (Million), by Solution Type 2025 & 2033
- Figure 13: Europe Medical Claims Management Industry Revenue Share (%), by Solution Type 2025 & 2033
- Figure 14: Europe Medical Claims Management Industry Revenue (Million), by Component 2025 & 2033
- Figure 15: Europe Medical Claims Management Industry Revenue Share (%), by Component 2025 & 2033
- Figure 16: Europe Medical Claims Management Industry Revenue (Million), by Delivery Mode 2025 & 2033
- Figure 17: Europe Medical Claims Management Industry Revenue Share (%), by Delivery Mode 2025 & 2033
- Figure 18: Europe Medical Claims Management Industry Revenue (Million), by End User 2025 & 2033
- Figure 19: Europe Medical Claims Management Industry Revenue Share (%), by End User 2025 & 2033
- Figure 20: Europe Medical Claims Management Industry Revenue (Million), by Country 2025 & 2033
- Figure 21: Europe Medical Claims Management Industry Revenue Share (%), by Country 2025 & 2033
- Figure 22: Asia Pacific Medical Claims Management Industry Revenue (Million), by Solution Type 2025 & 2033
- Figure 23: Asia Pacific Medical Claims Management Industry Revenue Share (%), by Solution Type 2025 & 2033
- Figure 24: Asia Pacific Medical Claims Management Industry Revenue (Million), by Component 2025 & 2033
- Figure 25: Asia Pacific Medical Claims Management Industry Revenue Share (%), by Component 2025 & 2033
- Figure 26: Asia Pacific Medical Claims Management Industry Revenue (Million), by Delivery Mode 2025 & 2033
- Figure 27: Asia Pacific Medical Claims Management Industry Revenue Share (%), by Delivery Mode 2025 & 2033
- Figure 28: Asia Pacific Medical Claims Management Industry Revenue (Million), by End User 2025 & 2033
- Figure 29: Asia Pacific Medical Claims Management Industry Revenue Share (%), by End User 2025 & 2033
- Figure 30: Asia Pacific Medical Claims Management Industry Revenue (Million), by Country 2025 & 2033
- Figure 31: Asia Pacific Medical Claims Management Industry Revenue Share (%), by Country 2025 & 2033
- Figure 32: Middle East and Africa Medical Claims Management Industry Revenue (Million), by Solution Type 2025 & 2033
- Figure 33: Middle East and Africa Medical Claims Management Industry Revenue Share (%), by Solution Type 2025 & 2033
- Figure 34: Middle East and Africa Medical Claims Management Industry Revenue (Million), by Component 2025 & 2033
- Figure 35: Middle East and Africa Medical Claims Management Industry Revenue Share (%), by Component 2025 & 2033
- Figure 36: Middle East and Africa Medical Claims Management Industry Revenue (Million), by Delivery Mode 2025 & 2033
- Figure 37: Middle East and Africa Medical Claims Management Industry Revenue Share (%), by Delivery Mode 2025 & 2033
- Figure 38: Middle East and Africa Medical Claims Management Industry Revenue (Million), by End User 2025 & 2033
- Figure 39: Middle East and Africa Medical Claims Management Industry Revenue Share (%), by End User 2025 & 2033
- Figure 40: Middle East and Africa Medical Claims Management Industry Revenue (Million), by Country 2025 & 2033
- Figure 41: Middle East and Africa Medical Claims Management Industry Revenue Share (%), by Country 2025 & 2033
- Figure 42: South America Medical Claims Management Industry Revenue (Million), by Solution Type 2025 & 2033
- Figure 43: South America Medical Claims Management Industry Revenue Share (%), by Solution Type 2025 & 2033
- Figure 44: South America Medical Claims Management Industry Revenue (Million), by Component 2025 & 2033
- Figure 45: South America Medical Claims Management Industry Revenue Share (%), by Component 2025 & 2033
- Figure 46: South America Medical Claims Management Industry Revenue (Million), by Delivery Mode 2025 & 2033
- Figure 47: South America Medical Claims Management Industry Revenue Share (%), by Delivery Mode 2025 & 2033
- Figure 48: South America Medical Claims Management Industry Revenue (Million), by End User 2025 & 2033
- Figure 49: South America Medical Claims Management Industry Revenue Share (%), by End User 2025 & 2033
- Figure 50: South America Medical Claims Management Industry Revenue (Million), by Country 2025 & 2033
- Figure 51: South America Medical Claims Management Industry Revenue Share (%), by Country 2025 & 2033
List of Tables
- Table 1: Global Medical Claims Management Industry Revenue Million Forecast, by Solution Type 2020 & 2033
- Table 2: Global Medical Claims Management Industry Revenue Million Forecast, by Component 2020 & 2033
- Table 3: Global Medical Claims Management Industry Revenue Million Forecast, by Delivery Mode 2020 & 2033
- Table 4: Global Medical Claims Management Industry Revenue Million Forecast, by End User 2020 & 2033
- Table 5: Global Medical Claims Management Industry Revenue Million Forecast, by Region 2020 & 2033
- Table 6: Global Medical Claims Management Industry Revenue Million Forecast, by Solution Type 2020 & 2033
- Table 7: Global Medical Claims Management Industry Revenue Million Forecast, by Component 2020 & 2033
- Table 8: Global Medical Claims Management Industry Revenue Million Forecast, by Delivery Mode 2020 & 2033
- Table 9: Global Medical Claims Management Industry Revenue Million Forecast, by End User 2020 & 2033
- Table 10: Global Medical Claims Management Industry Revenue Million Forecast, by Country 2020 & 2033
- Table 11: United States Medical Claims Management Industry Revenue (Million) Forecast, by Application 2020 & 2033
- Table 12: Canada Medical Claims Management Industry Revenue (Million) Forecast, by Application 2020 & 2033
- Table 13: Mexico Medical Claims Management Industry Revenue (Million) Forecast, by Application 2020 & 2033
- Table 14: Global Medical Claims Management Industry Revenue Million Forecast, by Solution Type 2020 & 2033
- Table 15: Global Medical Claims Management Industry Revenue Million Forecast, by Component 2020 & 2033
- Table 16: Global Medical Claims Management Industry Revenue Million Forecast, by Delivery Mode 2020 & 2033
- Table 17: Global Medical Claims Management Industry Revenue Million Forecast, by End User 2020 & 2033
- Table 18: Global Medical Claims Management Industry Revenue Million Forecast, by Country 2020 & 2033
- Table 19: Germany Medical Claims Management Industry Revenue (Million) Forecast, by Application 2020 & 2033
- Table 20: United Kingdom Medical Claims Management Industry Revenue (Million) Forecast, by Application 2020 & 2033
- Table 21: France Medical Claims Management Industry Revenue (Million) Forecast, by Application 2020 & 2033
- Table 22: Italy Medical Claims Management Industry Revenue (Million) Forecast, by Application 2020 & 2033
- Table 23: Spain Medical Claims Management Industry Revenue (Million) Forecast, by Application 2020 & 2033
- Table 24: Rest of Europe Medical Claims Management Industry Revenue (Million) Forecast, by Application 2020 & 2033
- Table 25: Global Medical Claims Management Industry Revenue Million Forecast, by Solution Type 2020 & 2033
- Table 26: Global Medical Claims Management Industry Revenue Million Forecast, by Component 2020 & 2033
- Table 27: Global Medical Claims Management Industry Revenue Million Forecast, by Delivery Mode 2020 & 2033
- Table 28: Global Medical Claims Management Industry Revenue Million Forecast, by End User 2020 & 2033
- Table 29: Global Medical Claims Management Industry Revenue Million Forecast, by Country 2020 & 2033
- Table 30: China Medical Claims Management Industry Revenue (Million) Forecast, by Application 2020 & 2033
- Table 31: Japan Medical Claims Management Industry Revenue (Million) Forecast, by Application 2020 & 2033
- Table 32: India Medical Claims Management Industry Revenue (Million) Forecast, by Application 2020 & 2033
- Table 33: Australia Medical Claims Management Industry Revenue (Million) Forecast, by Application 2020 & 2033
- Table 34: South Korea Medical Claims Management Industry Revenue (Million) Forecast, by Application 2020 & 2033
- Table 35: Rest of Asia Pacific Medical Claims Management Industry Revenue (Million) Forecast, by Application 2020 & 2033
- Table 36: Global Medical Claims Management Industry Revenue Million Forecast, by Solution Type 2020 & 2033
- Table 37: Global Medical Claims Management Industry Revenue Million Forecast, by Component 2020 & 2033
- Table 38: Global Medical Claims Management Industry Revenue Million Forecast, by Delivery Mode 2020 & 2033
- Table 39: Global Medical Claims Management Industry Revenue Million Forecast, by End User 2020 & 2033
- Table 40: Global Medical Claims Management Industry Revenue Million Forecast, by Country 2020 & 2033
- Table 41: GCC Medical Claims Management Industry Revenue (Million) Forecast, by Application 2020 & 2033
- Table 42: South Africa Medical Claims Management Industry Revenue (Million) Forecast, by Application 2020 & 2033
- Table 43: Rest of Middle East and Africa Medical Claims Management Industry Revenue (Million) Forecast, by Application 2020 & 2033
- Table 44: Global Medical Claims Management Industry Revenue Million Forecast, by Solution Type 2020 & 2033
- Table 45: Global Medical Claims Management Industry Revenue Million Forecast, by Component 2020 & 2033
- Table 46: Global Medical Claims Management Industry Revenue Million Forecast, by Delivery Mode 2020 & 2033
- Table 47: Global Medical Claims Management Industry Revenue Million Forecast, by End User 2020 & 2033
- Table 48: Global Medical Claims Management Industry Revenue Million Forecast, by Country 2020 & 2033
- Table 49: Brazil Medical Claims Management Industry Revenue (Million) Forecast, by Application 2020 & 2033
- Table 50: Argentina Medical Claims Management Industry Revenue (Million) Forecast, by Application 2020 & 2033
- Table 51: Rest of South America Medical Claims Management Industry Revenue (Million) Forecast, by Application 2020 & 2033
Frequently Asked Questions
1. What is the projected Compound Annual Growth Rate (CAGR) of the Medical Claims Management Industry?
The projected CAGR is approximately 16.29%.
2. Which companies are prominent players in the Medical Claims Management Industry?
Key companies in the market include Mckesson Corporation, Oracle Corporation (Cerner Corporation), IBM Corporation, Accenture plc, RP Sanjiv Goenka Group (FirstSource)*List Not Exhaustive, Optum Inc, Conduent Inc (Health Solutions Plus), Allscripts Healthcare Solutions Inc, OSP Labs, Genpact Limited, Athenahealth Inc.
3. What are the main segments of the Medical Claims Management Industry?
The market segments include Solution Type, Component, Delivery Mode, End User.
4. Can you provide details about the market size?
The market size is estimated to be USD 23.84 Million as of 2022.
5. What are some drivers contributing to market growth?
Government Initiatives Supporting Health Insurance Market; Rising Importance of Denials Management; Growing Aging population with chronic diseases.
6. What are the notable trends driving market growth?
Cloud-based is Expected to Hold Significant Market Share in Healthcare Claim Management Marke.
7. Are there any restraints impacting market growth?
Patient Data Privacy and Security Concerns; High Deployment Costs.
8. Can you provide examples of recent developments in the market?
N/A
9. What pricing options are available for accessing the report?
Pricing options include single-user, multi-user, and enterprise licenses priced at USD 4750, USD 5250, and USD 8750 respectively.
10. Is the market size provided in terms of value or volume?
The market size is provided in terms of value, measured in Million.
11. Are there any specific market keywords associated with the report?
Yes, the market keyword associated with the report is "Medical Claims Management Industry," which aids in identifying and referencing the specific market segment covered.
12. How do I determine which pricing option suits my needs best?
The pricing options vary based on user requirements and access needs. Individual users may opt for single-user licenses, while businesses requiring broader access may choose multi-user or enterprise licenses for cost-effective access to the report.
13. Are there any additional resources or data provided in the Medical Claims Management Industry report?
While the report offers comprehensive insights, it's advisable to review the specific contents or supplementary materials provided to ascertain if additional resources or data are available.
14. How can I stay updated on further developments or reports in the Medical Claims Management Industry?
To stay informed about further developments, trends, and reports in the Medical Claims Management Industry, consider subscribing to industry newsletters, following relevant companies and organizations, or regularly checking reputable industry news sources and publications.
Methodology
Step 1 - Identification of Relevant Samples Size from Population Database


Step 2 - Approaches for Defining Global Market Size (Value, Volume* & Price*)

Note*: In applicable scenarios
Step 3 - Data Sources
Primary Research
- Web Analytics
- Survey Reports
- Research Institute
- Latest Research Reports
- Opinion Leaders
Secondary Research
- Annual Reports
- White Paper
- Latest Press Release
- Industry Association
- Paid Database
- Investor Presentations

Step 4 - Data Triangulation
Involves using different sources of information in order to increase the validity of a study
These sources are likely to be stakeholders in a program - participants, other researchers, program staff, other community members, and so on.
Then we put all data in single framework & apply various statistical tools to find out the dynamic on the market.
During the analysis stage, feedback from the stakeholder groups would be compared to determine areas of agreement as well as areas of divergence